I evaluate around 1,400 stocks using a multidimensional factor model, with each dimension on a scale from 0 to 100. Recently, I’ve started applying this analysis to my own portfolio as well—so each of my positions receives the same score as every other stock in the universe. The results are revealing, especially where the model rates my stocks poorly.
Let’s start at the top:
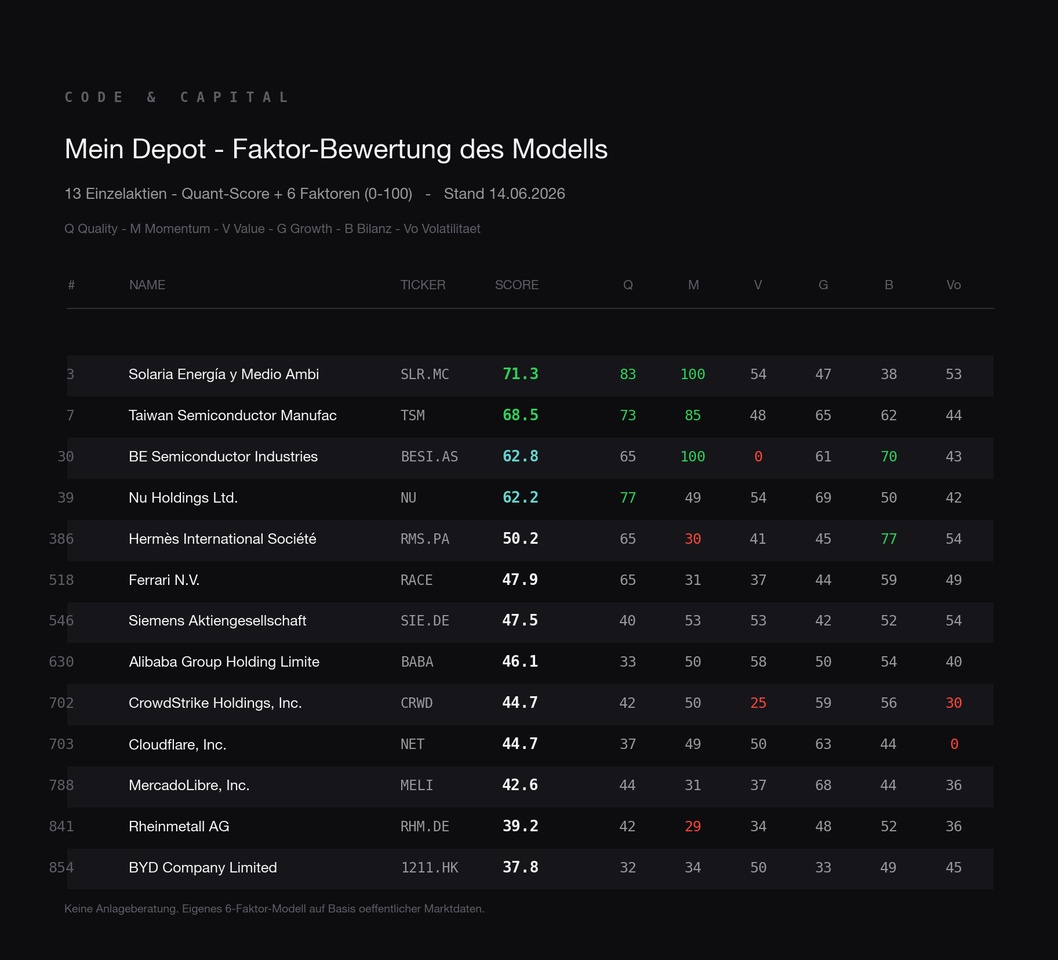
$SLR (-0,2%) Ranked 3 out of 865, $TSM (+4,04%) at 7, $BESI (-3,48%) at 30, $NU (+1,12%) at 39. At BE Semiconductor, I find the breakdown particularly instructive: an extremely strong momentum score meets a valuation score of practically zero, with a P/E ratio of around 149. So the model doesn’t say “good stock” or “bad stock,” but describes exactly what you’re holding—a strong trend at a high price. This distinction is more important to me than a single overall score.
Now for the bottom half:
Because that’s actually the more interesting part. $RHM (-4,04%) It’s way down the list, $1211 (-0,54%) almost at the end of the universe, $MELI (+3,81%) and also deep. The reason is almost the same everywhere: The 12-month momentum has collapsed following the correction, and at the same time, valuations are high. So two factors are pulling it down at the same time. With Rheinmetall, there’s the added factor that the stock is simply no longer cheap after its strong run—the model sees this objectively, regardless of the story surrounding it.
My software stocks are a special case:
$NET (+3,06%) , $CRWD (+1,38%) and $NOW (+2,93%) . They also end up in the lower range because their high stock-based compensation weighs on quality and balance sheet metrics. This is a well-known issue with growth-oriented software companies: A large portion of employee compensation is paid in stock, which dilutes and burdens margins when factored in honestly. I tested exactly that—I built a variant that excludes the SBC burden and thus rates these stocks more leniently. The backtest yielded a worse result. So I discarded it again and am sticking with the stricter approach. I’d rather have a consistent model that measures all stocks the same way in a verifiable manner than one I tweak for individual favorites. It’s precisely this tweaking that’s the fastest way to a model that looks great in backtesting but doesn’t work in real-world trading.
Bottom line:
for me, these are two types of positions. I bought some because of their scores—Solaria and BESI, for example; the model is what led me to them in the first place. I hold the others deliberately against the score, out of my own conviction. But I want to see the number and take it seriously, rather than pretending it doesn’t exist. That’s the whole point of the exercise.
The purely systematic version—that is, strictly the top-scoring stocks, excluding my conviction-based positions—has been running as a Wikifolio (ISIN: DE000LS9V052) since March and became tradable this week.
What do you think:
Do you tend to trust your own thesis, or the system behind it?