
$NOVO B (-2,34%)
$NVO (-2,49%)
$ZTS (-0,49%)
$CMG (+0,59%)
$GRMN (-0,52%)
$FI (-2,05%)
$TLNC34
$CELH
Found an interesting article on x:
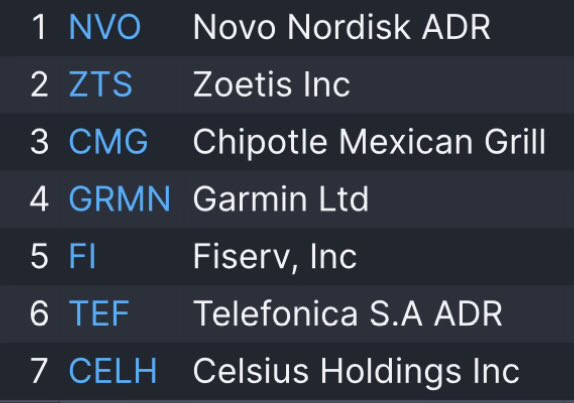
There are over 850 stocks with a market capitalization of at least $10 billion.
Of these 850+, only 7 currently have a daily RSI below 20.
Most interesting for me $NOVO B (-2,34%) and $ZTS (-0,49%) , $CELH I will probably have to take a closer look again.
Another reason why I increased $NOVO B (-2,34%) I also topped up again yesterday.
Certainly also interesting from a trading perspective. Which companies on this list are the most interesting for you and why? 🫡
Explanation RSI:
The Relative Strength Index (RSI) is a technical indicator designed to measure the strength or weakness and direction of an asset. It was developed by Welles Wilder in 1978 and has since become one of the most widely used indicators in technical analysis.
The RSI is calculated by comparing the price fluctuations of an underlying asset over time. It is then converted into an index value from 0 to 100. A value above 70 is interpreted as "overbought" and a value below 30 as "oversold".
It is recommended to calculate the RSI with a period of 14 periods. However, some traders also experiment with other time periods. The RSI is an extremely flexible indicator and can be applied to different time periods and assets.
The RSI offers traders two types of signals:
A buy signal and a sell signal. A buy signal is generated when the RSI falls below a certain threshold, usually 30, which is considered oversold and signals that the price is likely to recover in the near future.
A sell signal is generated when the RSI rises above a certain threshold, usually 70, which is considered overbought and signals that the price is likely to correct in the near future.
However, the RSI alone is not sufficient to make informed trading decisions. Rather, it should be used in conjunction with other indicators and analysis methods to gain a more comprehensive understanding of market conditions.
It should also be noted that the RSI, like any other indicator, is prone to error and is not always perfect. For example, if the RSI is stuck in overbought or oversold territory for a long time, this may indicate a trend continuation and not necessarily an impending correction.
Overall, the RSI is a valuable indicator that can help traders assess the trend strength or weakness of an asset and identify potential reversal points.
However, the RSI should be used in conjunction with other indicators and analysis methods to gain a more comprehensive understanding of market conditions. It is also important to be aware of potential sources of error and to interpret RSI signals accordingly in order to make successful investment decisions.
There are numerous other indicators that can help traders determine the strength or weakness of an asset.
Some of the most popular alternatives to the RSI are:
- The Moving Average Convergence Divergence (MACD)This indicator measures the divergence between two moving averages and is often used to identify trends and turning points.
- The Stochastic IndicatorThis indicator measures the relationship between the closing price of an asset and its price range over a certain period of time and makes it easier to identify an overbought or oversold market.
- The Williams %R indicatorSimilar to the RSI, Williams %R measures the ratio of the highest and lowest price of an asset within a given time period. There are differences in the calculation of the RSI and Williams %R, but the results are similar.
- The On-Balance Volume (OBV)This indicator measures the trading volume in relation to the price movements of an asset and is used to identify potential buy or sell signals.
- The Money Flow Index (MFI)This indicator is similar to the RSI, but also includes trading volume in the calculation and helps to identify overbought and oversold market conditions.
Each indicator has its own strengths and weaknesses, and none of them are perfect. It is best to use multiple indicators to gain a more comprehensive understanding of market conditions and compare the results with other analysis methods and charting indicators.
https://de.investing.com/academy/trading/rsi-indikator-erklaerung/
@TomTurboInvest
@Multibagger what's in it for you? 😄


