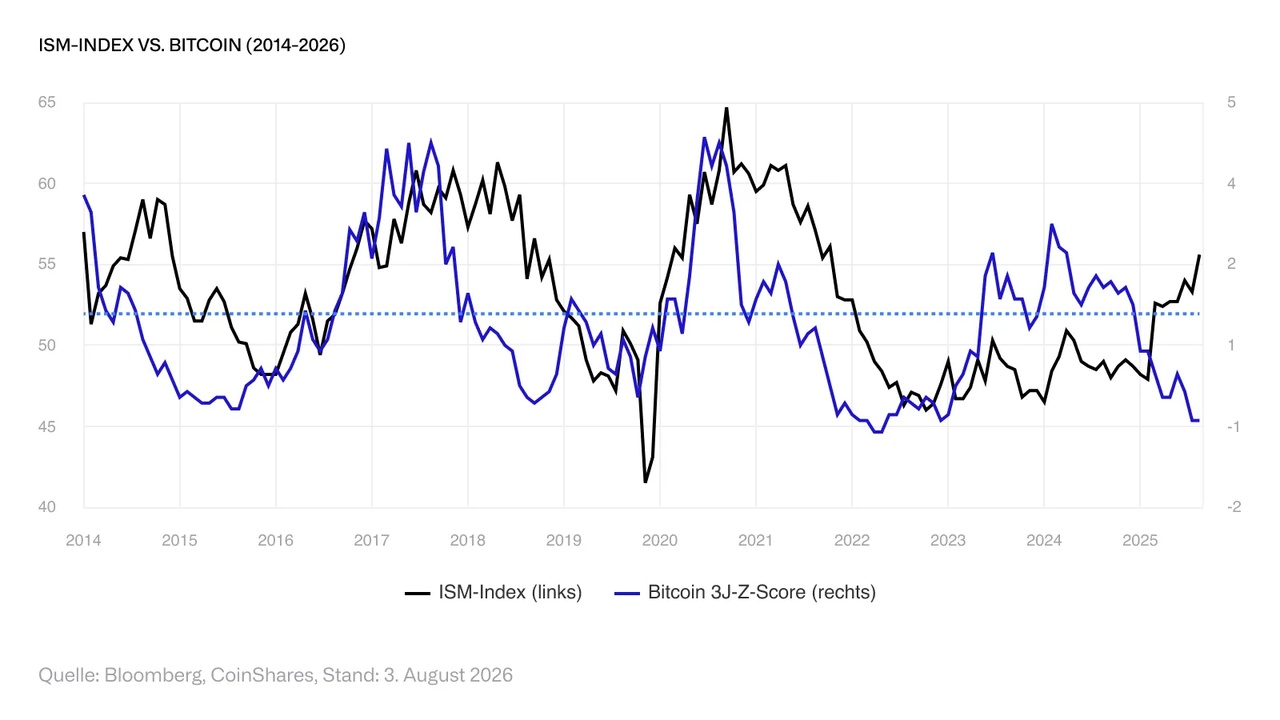
The ISM Manufacturing Index (Institute for Supply Management Index), a key indicator of U.S. manufacturing activity, continued to strengthen in July, driven by robust investment in AI infrastructure. This upward trend is likely to continue in the coming months, given the very strong export data from Taiwan. The index is now firmly in expansionary territory and has remained above the 52 mark for several months. Historically, any sustained movement above this threshold following a contraction has been associated with strong $BTC (+0,25%)price gains—the current divergence is therefore unusual. Our analysis of the #bitcoinvariance suggests that the price continues to be driven primarily by the dominant macroeconomic factor, which is closely linked to global growth. If this relationship remains intact, $BTC (+0,25%) ultimately benefit from the ongoing improvement in manufacturing activity. Currently, however, $BTC (+0,25%) , however, from a lack of investor interest. This partly reflects the market shift toward AI, although this increasingly overcrowded trend is showing the first signs of fatigue. Meanwhile, sentiment toward cryptocurrencies remains subdued, with many valuation metrics still hovering in a range typically associated with the later stages of a bear market.
At the same time, several indicators have begun to improve. ETF inflows have turned positive again, and funding rates on perpetual futures returned in July. The main catalyst remains a more significant improvement in the inflation outlook. Significant progress in this area would likely give the market a strong boost. Overall, the signs increasingly suggest that we are approaching the final phase of the bear market, although it is unlikely to be over yet.
You can invest in Bitcoin through the following vehicle: $BITC (-1,13%)