
A little more today $965515 (-3,57%) in the form of a beautiful coin🥳 What was your buy of the day?

Physical Gold (1 Ounce)
Materia prima
Materia prima
ISIN: LS000IGOLD01
Ticker: 965515
LS000IGOLD01
965515
Price
Discussione su 965515
Messaggi
77
1Mes·
All that glitters is not gold
This time already ... my portfolio was increased again, and a little silver was also added.
Now definitely put on hold - from now on, all other budget will flow back into ETFs / stocks.
What did you buy this / last week?
66
2 Commenti
1Mes
Bought more gold at 4600 USD equivalent
Silver a but too early at around 90 USD
And loaded the dip of $KGH like crazy, averaging down position and making sure I'm locked for a good upside in the coming days, weeks 😎
Silver a but too early at around 90 USD
And loaded the dip of $KGH like crazy, averaging down position and making sure I'm locked for a good upside in the coming days, weeks 😎
•
11
•
1Mes·
Presentation after 5 years Getquin
Having been a more or less silent reader here for a few years now, I would like to introduce myself, my investor history and my goals. I would also be pleased to receive portfolio feedback.
About me: 31, married for 6 years, Dinki (double income, no kids), savings rate currently approx. 1200€ (my wife invests a similar amount separately), live in a condominium with a garden that has not yet been paid off, hobbies: traveling and gardening.
If you don't want to read everything, I've divided the introduction into three chapters:
-My stock market history
-Portfolio allocation
-Targets/Plans
My stock market history
I started with the stock market in 2020 when I started my first real job. But I had no idea, no specific goals and was actually totally overwhelmed by the huge choice. As I come from a very humble background and had nothing to do with financial education, let alone wealth, it was hardly surprising. I just knew I had to do something about the nasty "pension gap". After all.
So of course I made all sorts of beginner's mistakes: trading back and forth, watching out for hypes, buying blindly, fomo, only looking at dividend yields, investing in 100 different shares with very small amounts, constantly changing my "strategy", buying the occasional unsuspecting co-note. It's amazing that I made 1-2% p.a. at all.
Then I sold all the stuff in the meantime to have money to finance our property and basically started again.
I realized that the previous approach was nonsense, as I had educated myself further in financial matters, not least because of and motivated by getquin. So I switched to a "concentrated" portfolio with a core ETF and 25 shares and a focus on dividends, a little gold and even less Bitcoin. But at the end of 2024, I also realized that managing this portfolio, if you want to do it properly (reading quarterly reports, constantly reanalyzing companies, etc.), is too time-consuming for these relatively small amounts.
So I decided to leave out the individual shares. At the same time, I read a lot and took the articles on strategy diversification and asset diversification to heart. It simply couldn't have been ACWI Buy and Hold. At that time he published @Epi published many articles on his 3xGTAA strategy, which was well explained and researched with a lot of effort and really tested something that I could also imagine for my portfolio. So the Wikifolio came at just the right time for me.
In this respect, I have divided my portfolio as follows since January 2025 (new start also in my Getquin portfolio):
Portfolio allocation
30% 3xGTAA
25% gold
25% Equities ETFs
20% Bitcoin
The rather large number of ETFs is due to the fact that I like to have ACWI 50/50 Eur-hedged and unhedged in order to be less exposed to currency fluctuations ( $SPP1 (-1,89%) and $SPYY (-1,14%) ). The $IWDA (-1,63%) still comes from 2021, into which my capital-forming benefits flow. $XNAS (-1,54%) is fed by the cashback from the Traderepublic credit card. It's kind of nice to see what happens to that little bit of cashback every month.
Overall, I think this portfolio is sufficiently diversified and concentrated in terms of strategies and asset classes. In addition, the return should be well above pure ACWI buy and hold and yet not have extreme drawdowns like this one. It is important to me to have various uncorrelated asset classes, but still have a strong overall return.
Bitcoin $BTC (-0,32%) does harbor risks for deep drawdowns, but also opportunities. I myself consider Bitcoin to be an extremely good store of value that will see further adaptation.
Gold $965515 (-3,57%) has a very high share due to its low correlation with other assets. This level will be maintained for at least another six years, as the final installment for our property of around €30,000 will then be due. If the stock markets/Bitcoin/3xGTAA are at a low at that time, the final payment can be covered by the sale of gold alone.
Goals/plans
Without goals, of course, everything is nothing. We would like to pay off our property in the short to medium term (approx. 6 years to go). The amount of the final installment should come from my portfolio. Depending on how the assets are doing, we will sell accordingly. Due to the rather high savings rate, I don't see any risk of not being able to raise 30,000 in 6 years, which is why I won't save this sum in cash. The risk of losing money seems higher to me if the money is not invested for this time. Special repayments are not an issue, as the interest rate is 0.8%.
Once the rather high monthly installments are gone and 1-2 promotions are added (the first one will be next year), the wealth accumulation will really take off. Low costs and high income will be an incredible lever.
In the medium to long term (10 years+), the portfolio will be used to be away from Germany for at least part of the year, preferably in winter. Depending on how things go in Germany, perhaps even longer or permanently. Ideally without having to rely on earned income. In any case, we have already chosen a country for this and have already traveled extensively. We haven't yet decided whether we want to buy one (or more) properties there, but there are many indications that we will.
Basically, there is no target amount that I am chasing, the aim is to accumulate as much wealth as possible over the next few years with a fixed strategy in order to become as independent as possible.
Thank you for all the great contributions over the last 5 years, many of them have helped me a lot, made me think and research and ultimately turned a clueless beginner into a slightly less clueless beginner. And if you like: please roast my portfolio :)
7Posizioni
23,64%
3232
36 Commenti
1Mes
I think your portfolio is great! Uncorrelated asset classes and strategies in a number and weighting that seems to make sense. You've really learned a lot here on Getquin. 👍
One question: What is the principle of your weighting? Max Sharpe ratio? Max Min Drawdown? Inverse vola? This is where strategy could possibly come in.
One question: What is the principle of your weighting? Max Sharpe ratio? Max Min Drawdown? Inverse vola? This is where strategy could possibly come in.
•
77
•
2Mes·
I'll take it with me!
The Bild said: Buy gold!
Then I'll take some profits. Exactly 2 years holding period, almost to the day.
A little story about it:
It was physical gold. Yesterday my daughter and I waited for almost 2 hours in a well-known precious metal dealer. The store was full, of course with the prices, but when I say full I mean full, with a queue on the sidewalk. Everyone wants to buy. Everyone who enters the store shouts out whether they want to buy or sell in order to be assigned to the respective queue. (Very indiscreet, but a bit of a stock market package feeling). With this strong euphoria, even among small investors and the grandma next door, I was encouraged to take profits and leave 1.25 ounces of gold and several ounces of silver. (Silver EK 2020 at €23, got a price of €77 yesterday).

2Mes·
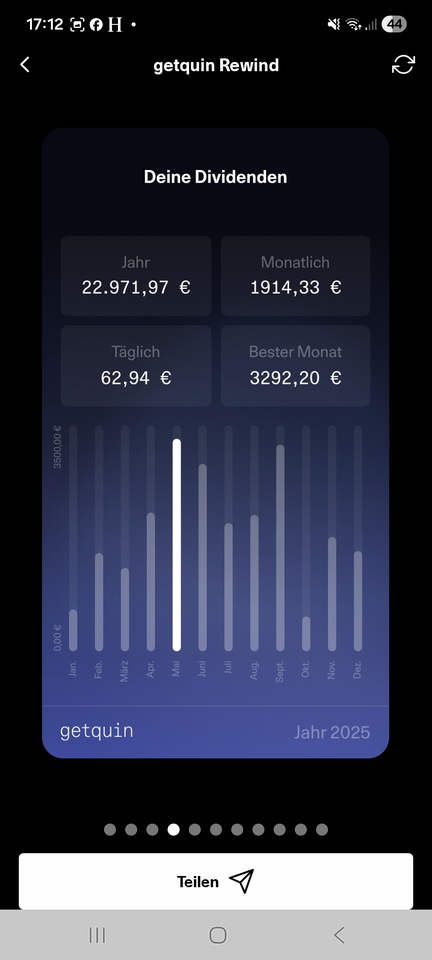
Dividendenopi inside (Part 1 )..... Dividendenopi Rewind2025
A little later, but not too late, I'll also have my say at the end of the year, together with an insight into the goings-on of the Opi before @Tenbagger2024 , @SAUgut777 and some others get impatient, as you know, old people are a bit slower. I would also like to take this opportunity to thank and appreciate all those who contribute here on GQ with great analyses and strong contributions, critical comments and a wonderful exchange. I'm deliberately not naming any individuals now, otherwise I won't be able to finish. All of you together are great, whether you're a veteran or a newcomer. The community is alive and I am happy to be a part of it. Thanks also to @christian and the Getquin team, who make this possible by maintaining the platform, even if things sometimes don't run smoothly. The Bavarian says: Basst scho
The year 2025 was exciting and, from my point of view, successful in terms of my expectations. If you don't feel like evaluating a boring dividend strategy, don't want to read about overnight and fixed-term deposits, aren't interested in certificates and don't like the Sparkasse, you are welcome to leave here after Rewind 2025. Many thanks to everyone else for reading and, if necessary, commenting.
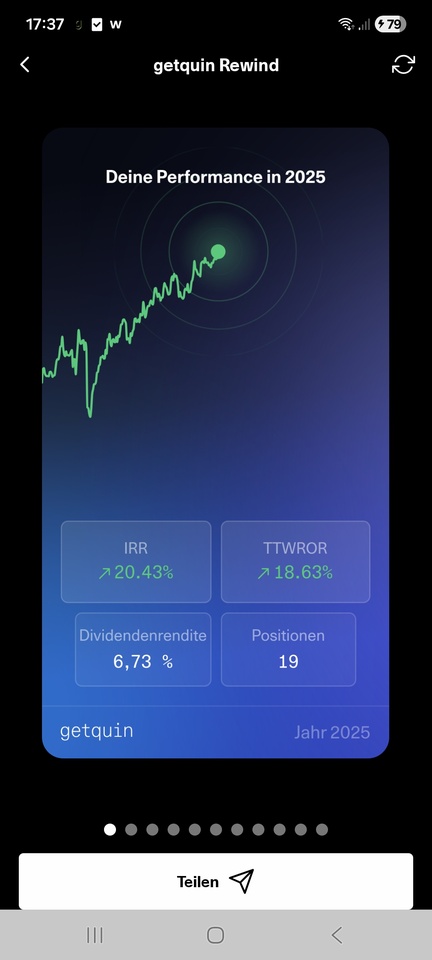
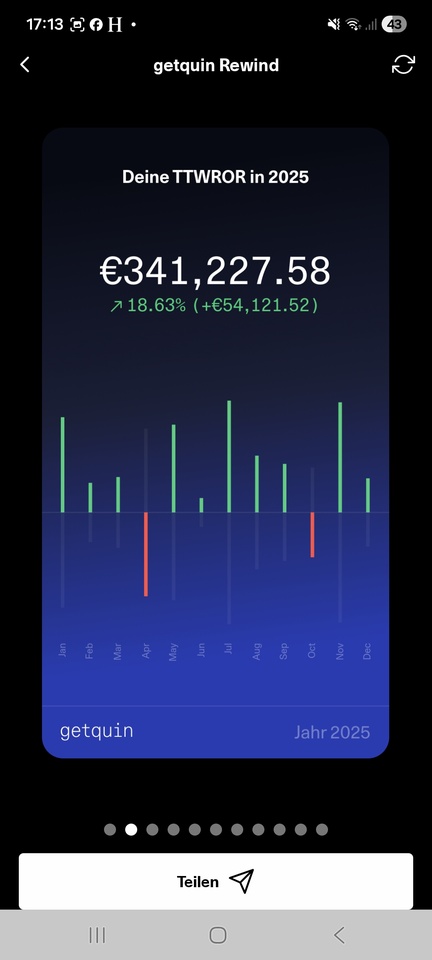
At least as far as the majority of shares are concerned, I am known to be invested in dividend stocks in order to generate the highest possible cash flow. I am now almost 62 years old and do not value excessive performance but would like to make a living from the income from my assets and decided to stop working at the beginning of the year when the company where I was employed was dissolved. I see myself as a buy and hold a while. Nothing lasts forever, especially with high-dividend shares. There are regular reallocations without getting into an operational frenzy. In 2025, for example $TRMD A (-3,16%) and a large position $HAUTO (-4,63%) had to leave the portfolio, the high dividend expectations were significantly reduced. The $QYLE (-1,38%) has not recovered from April, $EQNR (+1,36%) and $VICI (-3,35%) led to the brink of capital loss despite respectable dividends and had to give way, as did $MUX (+0,36%) with its inconsistencies. New additions were $NN (-2,48%) , $PFE (-1,6%) , $DTE (-2,35%) and a first position at the end of the year $ARCC (-0,83%) You can see the composition in my profile. I generally try to limit myself to +/- 20 positions and weight them according to purchase. A maximum of 20k per position is invested. This results in the calculation of my dividends and expected income. In its current composition, the portfolio shown here has a value of just over € 340,000 as at 31.12.2025 and has generated gross dividends of just under € 23,000 this year. This corresponds to a dividend yield of 6.73%
The time-weighted yield was 18.63% and therefore well above average, at least better than 67% of the getquin community. I wasn't able to beat the DAX, but at least I outperformed the S&P500 and beat the relevant MSCI World index by some distance. Even on a 5-year view I am on a par. Tobacco stocks did very well $BATS (-2,47%) , $IMB (-2,56%) and $MO (-0,83%) , $HSBA (-3,36%) , and $RIO (-2,35%) and of course $965515 (-3,57%) that I physically hold and the $EWG2 (-1,59%) .
That's all there is to the part of my investments shown here in GQ. What follows is a piece of my life story and the first part inside Dividendenopi.
As I said, I now live off my assets. This amounts to just under € 1.2 million in all the forms of investment I hold. Is that enough for a carefree life? For me in any case. Because on top of that, I have a debt-free, owner-occupied property (a single-family home with a large garden in a quiet rural location near a city of 600,000 inhabitants) and a rented two-family home, appropriately enough, as a neighboring property. Partly financed, rent surplus after installment to the bank a good € 700 per month, flows completely into the maintenance reserve. Claims from BAV, life insurance, building society savings contracts will be added on top in the next few years, but are not taken into account here. There's even a savings account with €18,000..... half of which belongs to my wife and she doesn't want to close it.
My wife (still) works and has a decent income despite working part-time and has other liquid assets in the lower six-figure range. She does it herself, the stock market is the devil's work. Her story is not included here either.
So I / we are doing pretty well after all. It wasn't always like that, anyone who is or was self-employed knows that. But consistent financial planning is important, no matter what the situation, as is sticking to your savings rate. I started investing in real estate at the beginning of the 1990s and have been liquidating it over the last few years. In conjunction with my own wealth accumulation and an inheritance, I am now in a comfortable situation for me.
What do I do with the rest of the money outside the getquin portfolio? A good € 500,000 is (still) in call money and fixed-term deposit accounts. Interest rate hopping on call money and fixed-term deposits from 2 years ago yields around 3% on call money and over 4% on fixed-term deposits. The remaining capital is invested in certificates. Mainly in fixed-coupon express certificates with quarterly payout and partly in bonus certificates with CAP and barrier.
My investments currently generate a net monthly cash flow of € 4000, which is enough for me to live on. Plus € 800 ALG on top until the beginning of 2027.... But before the company closed, I only worked 16.5 hours a week. With my wife's income, that's a good €6500, which is bearable. You can certainly do more with your assets, depending on your needs. We live rather modestly, don't have any children and aren't the consumer type.
How am I invested outside of dividends, why certificates and which broker, where and how overnight and fixed-term deposits? I thought that would go beyond the scope of this article, so I'll come back to it in a second part. Thanks for your participation so far and see you soon
129129
32 Commenti
Congratulations on retiring at 62 as a private citizen. 🫡
Significantly, you can see here that not having children is now the best provision for old age. Not an accusation, just an observation. 🤷♂️
Significantly, you can see here that not having children is now the best provision for old age. Not an accusation, just an observation. 🤷♂️
•
44
•2Mes·
Gold all-time high - where is the journey going?
Driver of the increase:
-Geopolitical tension/uncertainties
-Weak economic outlook (expected - falling interest rates, weakening US labor market)
-Weakening dollar 💸 💵 💲
What do you think?
22
5 Commenti2Mes
I'm afraid gold is more complicated than the usual headlines suggest.
Z. For example, gold has performed wonderfully in recent years despite a latently rising USD.
The development of the USD's real interest rate differential is probably more relevant. But that is too complicated for Mainstreet. So they talk about a weak USD. Everyone understands that. 🤷
Z. For example, gold has performed wonderfully in recent years despite a latently rising USD.
The development of the USD's real interest rate differential is probably more relevant. But that is too complicated for Mainstreet. So they talk about a weak USD. Everyone understands that. 🤷
•
66
•3Mes·
Gold, baby gold!
Gold is also constantly being bought up. Yes, I know, above the spot price - but they are old physical coins, which is why I consciously pay more!
Do you also have $GOLD in your portfolio?
77
5 Commenti
3Mes
I also own and hold physical old gold coins. Gold Eagle from 1889/1904, Liberty Head, Mexican Centenarios and Gold Rubles. Which ones did you buy? 😄
•
11
•


6Mes·
Gold new asset rocket? 🚀😜
Woah 😦 $965515 (-3,57%) Gold has in this month more than 5% return made!
That's why I'm very interested in these questions:
What do you.
Why is that the case?
What do you with the info?
Is it about...
Because of an coming crisis?📉
Because of the September stock market slump?🤫😂Or simply because of chance?🤡
How do you see you that?
Write it in!
Let's exchange!
1010
33 Commenti
What am I doing with this information?
Patting myself on the back for adding gold to my portfolio a year ago
Patting myself on the back for adding gold to my portfolio a year ago
•
1616
•
6Mes·
21Shares BOLD ETP - Gold meets Bitcoin in a balanced investment product
Have you ever thought about how you can not only diversify your portfolio, but also make it more stable? For example, through a mix of gold and Bitcoin, which together can help to reduce the drawdown and at the same time increase the potential returns?
The 21Shares Bytetree BOLD ETP (ISIN CH1146882308) $BOLD (-2,27%) combines the characteristics of gold and Bitcoin in one product. The weighting is adjusted monthly according to the principle of inverse volatility: The less volatile asset receives a higher weighting, while the more volatile asset is weighted correspondingly lower. This creates a dynamic balance between stability and growth opportunities.
The ETP is physically backed, i.e. the units are actually backed by gold and Bitcoin. With annual costs of around 0.65% and accumulation of income, the product has a transparent structure. The fund volume is still small at around EUR 20-30 million, but the performance since launch has been very strong: in 2023 it was around +14%, in 2024 even +58%. Over the year (as at summer 2025), the return is around +40 %, with volatility of around 27 %.
Risks of the 21Shares BOLD ETP (CH1146882308)
1. high volatility
Despite the "balance" strategy, Bitcoin remains a very volatile asset. Price fluctuations of double-digit percentages in a short period of time are possible.
2. issuer risk
This is an ETN. This means that you are a creditor of the issuer (21Shares). In the event of insolvency, there could be problems with repayment - despite physical collateralization.
3. low fund volume
With a current fund size of only around EUR 20-30 million, the product is relatively small. This can have an impact on tradability (liquidity, spread).
4. market risk of gold
Gold also fluctuates, albeit much less than Bitcoin. Gold can come under pressure, particularly in phases of rising interest rates.
5 Regulatory risk
Cryptocurrencies are heavily dependent on regulation. Changes in legislation could have an impact on tradability or taxation.
6. costs
At 0.65% TER, the product is more expensive than traditional ETFs. However, it can provide tax savings in the custody account as you do not have to reallocate.
7. currency risk
The product is traded in CHF/EUR/GBP. If you invest in euros, you also have an exchange rate risk against the US dollar (as gold and Bitcoin are quoted in USD).
"Possible 1-year scenarios of the 21Shares BOLD ETP (example: USD 10,000 investment) from the fact sheet" - recalculations
Stress scenario (2017-2018): USD 530 → -94.7%
Pessimistic scenario (2018-2019): USD 2,710 → -72.9 %
Medium scenario (2023-2024): USD 14,970 → +49.7 %
Optimistic scenario (2016-2017): 143,770 USD → +1,337.7 %
What does your asset allocation look like? What do you think of BOLD? How do you weight gold, BTC etc.?
BOLD | 21Shares Bitcoin Gold ETP https://share.google/n1eapJCeUCXvoxcd9

www.21shares.comBOLD | 21shares Bitcoin Gold ETP
1616
32 Commenti
What is missing are getquin coins. Here you have some.
•
1010
•Titoli di tendenza
I migliori creatori della settimana
<contenitore>Dati LSX</contenitore> · Dati finanziari di FactSet