
If you don't want to read the report...below is a short summary
1. the US labor market and the risk of recession
The US economy is in a precarious phase. The S&P 500 has fallen below its 200-day line for the first time since October 2023. Even more critical is the price ratio of the S&P 500 to US Treasuries ($TLT)which is once again at the 200DMA line, essentially a support level that has served as a psychological barrier against a bear market since December 2020 (Chart 2). The most recent Februar-Payroll-Daten with 151k new jobs was right in the middle of nowhere. A jobs report of over 200k would have been a strong reading and would have indicated that the US economy is robust enough to withstand higher interest rates. Stock markets would have stabilized as there was no imminent threat of recession; a report of 125k would have been a weak reading and would have indicated a cooling economy and falling corporate profits. The market would have slipped into a bear market phase, while bonds would have benefited as a safe haven.151k jobs lie exactly between these thresholds and offer no clear basis for interpretation.

Another alarming signal comes from the ratio of US consumer discretionary stocks to Staples stockswhich has reached an all-time high (Chart 5). For decades, this ratio has been a reliable early indicator of an imminent weak phase for the S&P 500. You could say that the USA is one payroll report away from a recession. The background to this is the dwindling influence of government job subsidies: In January 2025, the following 70% des Arbeitsmarktwachstums came from the public sector, a significant decline from 85% in the previous year. At the same time, the household savings rate is rising.

2 Global military spending: Europe in a fiscal dilemma
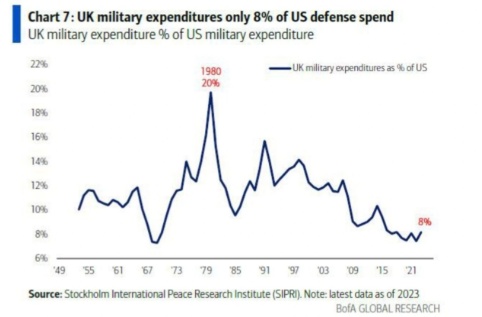
Germany's military expenditure amounts to only 7% of US spending, the United Kingdom reaches 8% (Charts 6 and 7). This explains why European budget deficits are exploding: For Germany, an average deficit of -4% of GDP is forecast for Germany for the period 2025-2030 (Chart 9). The "Whatever-it-takes" policy on Merz is driving the yields of German Bundesanleihen to over 3% (15-year high) and British Gilts to over 5,5% (27-year high).
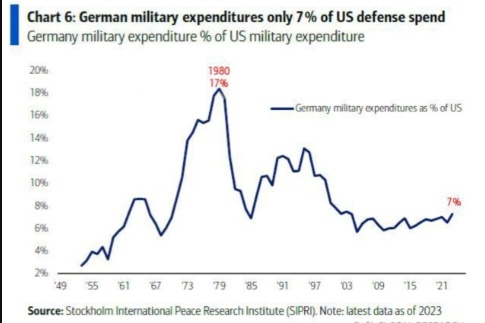
German Bund yields could overtake US Treasuries this year (Chart 3).
3. flight to safety, exodus at risk
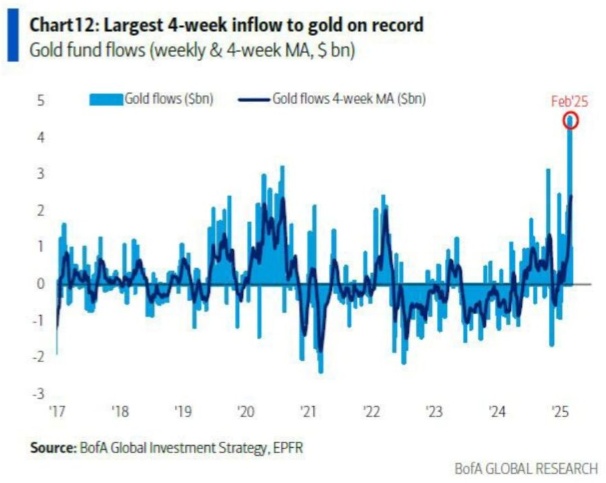
- $965515 (+0,19%) recorded the largest 4-week inflow of all time (USD 9.9 bn, chart 12). Gold is seen as a safe haven as investors seek hedges in the face of geopolitical uncertainty and looming recessions.
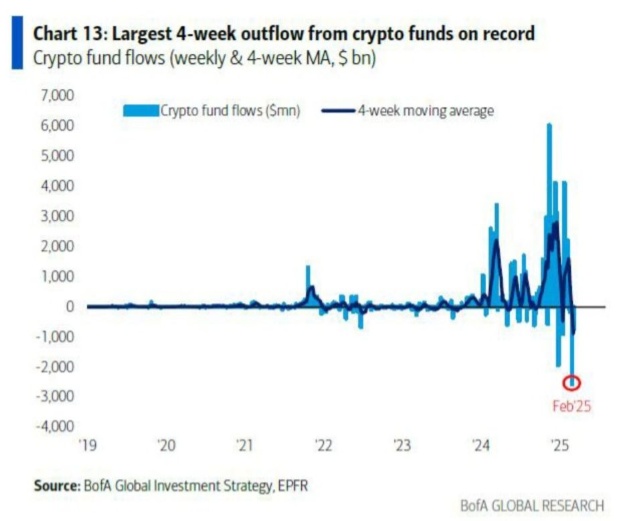
- Crypto funds experienced a record outflow of USD 3.6 billion (Chart 13), the largest since records began. Volatility in Bitcoin and Ethereum and regulatory concerns are deterring institutional investors.
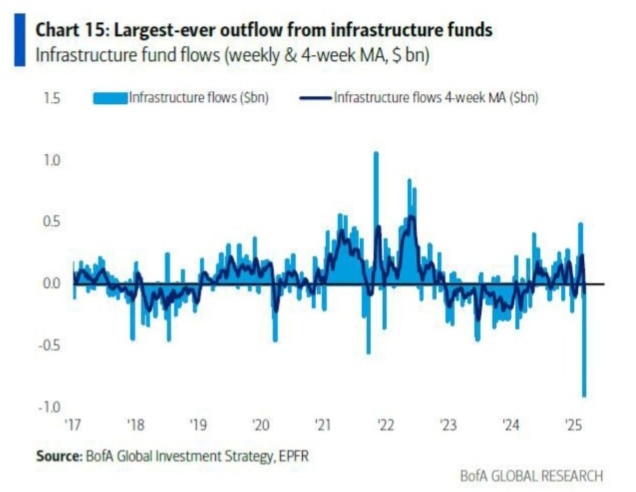
- Infrastructure funds recorded the largest outflow of all time (USD 0.9 bn, Chart 15) as rising interest rates weigh on the valuation of long-term projects.
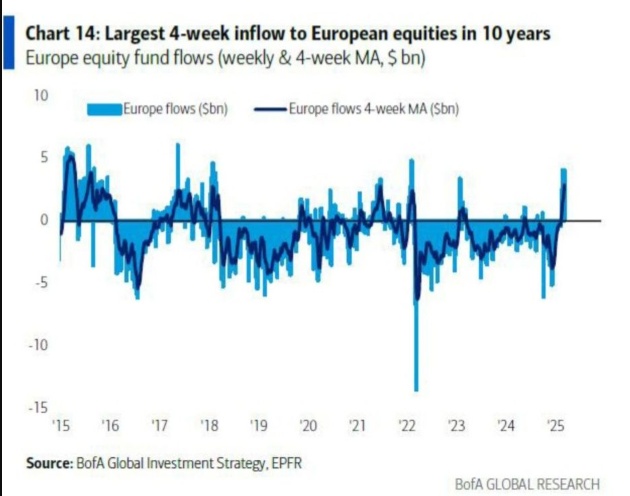
- European equities saw the strongest 4-week inflow since August 2015 (USD 12 bn, chart 14). The drivers are the relatively low valuations and the focus on European industrial companies and banks.
- Emerging markets saw the largest inflow in three months (USD 2.4 bn), supported by China's tech revival and India's reform momentum.
- TIPS saw an 8-week inflow streak, the longest since December 2021, as investors want to be prepared for potential stagflation.
4 AI shock and tech
The DeepSeek AI shock has rearranged the tech bubble. The Magnificent 7 ($AAPL (+0,03%) , $MSFT (-0,18%) , $NVDA (-0,2%) , $AMZN (-0,21%) , $GOOGL (-0,15%) , $META (+0%) ) lost 3 trillion USD in market capitalization and are now known as the Lagnificent 7 are mocked. At the same time, the market capitalization of China's BATX ($9888 (-2,39%) , $9988 (-1,31%) , $700 (-1,26%) , $1810 (+0,75%)) to 1.6 trillion USDa sign that Chinese companies are catching up in the AI sector.
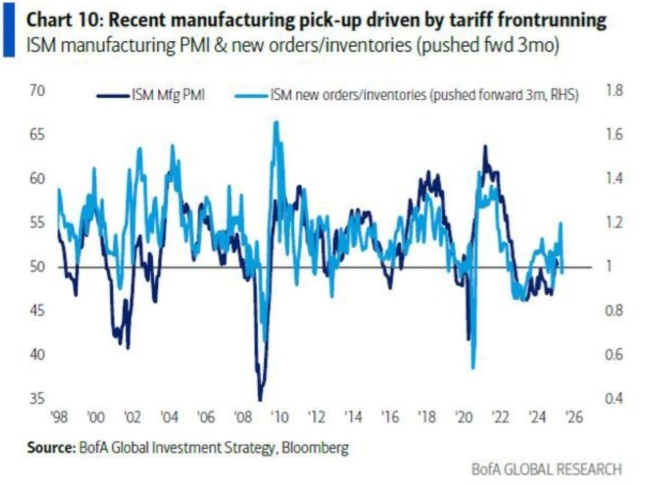
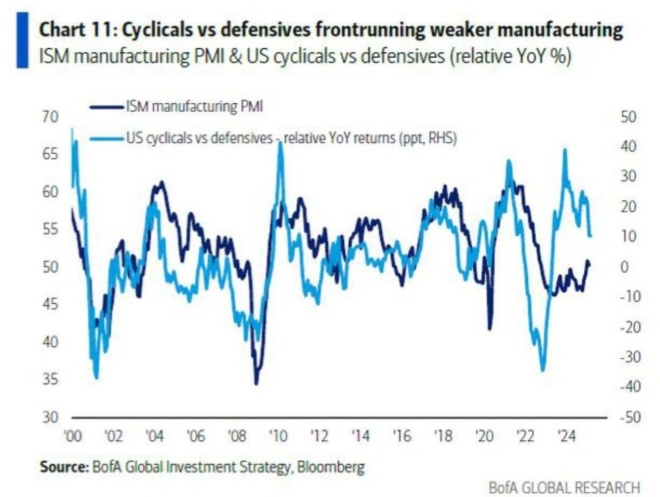
This shift is also reflected in the US-ISM-Manufacturing-PMI-Daten (Charts 10 & 11): The recent rise to 55 points is seen as tariff frontrunning interpreted. Companies stocked up their inventories ahead of time in order to circumvent expected trade barriers (e.g. new US tariffs on Chinese semiconductors). However, this short-term upswing masks structural weaknesses: The cyclicals vs. defensives ratio (Chart 11) points to an imminent slowdown in industrial activity. The cyclicals vs. defensives ratio compares the performance of cyclical stocks (industrials, commodities, consumer goods) with that of defensive stocks (utilities, healthcare, consumer staples). Basically serves as a leading indicator for economic expectations.
5. forecasts 2025: strategic decisions
Recommendation: Buy 30YUST with a yield target of below 4%. Reasons:
- The US government is ending its 5-year phase of excessive spending, leading to a decline in demand.
- 70% of job growth in January 2025 came from the public sector, a sign of private sector weakness.
At the same time, one can UK Gilts & EU bonds can be classified as sell candidates. The yields of UK gilts are at 5,5% (27-year high), driven by the cost of rearmament and a budget deficit of 6.1% of GDP.
Equities: Europe and China in focus
- European markets: The DAX (+18% YTD) and the Euro Stoxx 50 (+13% YTD) are benefiting from undervalued industrial companies and banks. Despite a net outflow of USD 255 bn since 2022 flowed for the first time in the last 4 weeks 4 bn USD returned for the first time, a good sign.
- China: H-shares (+23% YTD) are attracting capital as Chinese tech companies benefit from the AI revolution and government subsidies.
- India: Small caps are 21% below their September 2024 high (Chart 4), but offer long-term opportunities in the context of the Make in India Initiative
Weak dollar, strong exporters
A weak US dollar favors European and Chinese exporters. At the same time US semiconductors could experience a recovery: The equal-weighted Semiconductor Index($esox) has 73% of its gains since the ChatGPT hype in May 2023. The tech sector also saw an inflow for the first time in 5 weeks (USD 2.6bn).
6. trouble spots: Japan and the ticking debt bomb
The 30-jährigen JGB-Renditen are quoted at 2,5% (17-year high), while the Bank of Japan with a key interest rate of 0,5% well behind the wage growth (5-6%) is lagging behind wage growth. Should the BoJ tighten its policy in order to regain credibility, there is a risk of a Nikkei Sell Offsimilar to the in August 2024when the yen appreciated sharply and Carry-Trades collapsed. If it fails to act, the weakness of the yen could push up import costs further and exacerbate stagflation.
7. summary 2025
2025 will be dominated by three megatrends:
- Long-dated US Treasuries and gold serve as protection against recession and stagflation.
- Europe and China take advantage of the weakness of the US dollar and technological upheavals.
- Japan's debt crisis, Europe's fiscal overheating and the fragility of the US labor market.
- Buy: European industrial stocks ($SIE (-1,49%) , $ASML (-0,03%) ), China's BATX, 30-year US Treasuries, gold.
- Dont's: UK/EU bonds, crypto, infrastructure funds.
- Wacth: BoJ policy, US payroll data, Indo-Pacific geopolitics.
