$WFC (-3,48%)
🔹 EPS: $1.39 (Est. $1.24) 🟢; UP +16% YoY
🔹 Revenue: $20.15B (Est. $20.73B) 🔴; DOWN -3% YoY
🔹 NII: $11.50B (Est. $11.81B) 🔴; DOWN -6% YoY
🔹 Net Income: $4.89B; UP +6% YoY
🔹 Provision for Credit Losses: $932M; inline YoY
🔹 ROE: 11.5% (vs. 10.5% YoY)
🔹 ROTCE: 13.6% (vs. 12.3% YoY)
🔹 Efficiency Ratio: 69% (Flat YoY)
Balance Sheet Metrics (Average):
🔹 Average Loans: $908.2B; DOWN -2% YoY
🔹 Average Deposits: $1.34T; Flat YoY
🔹 CET1 Ratio: 11.1% (vs. 11.2% YoY)
🔹 Liquidity Coverage Ratio (LCR): 125%
Capital Returns:
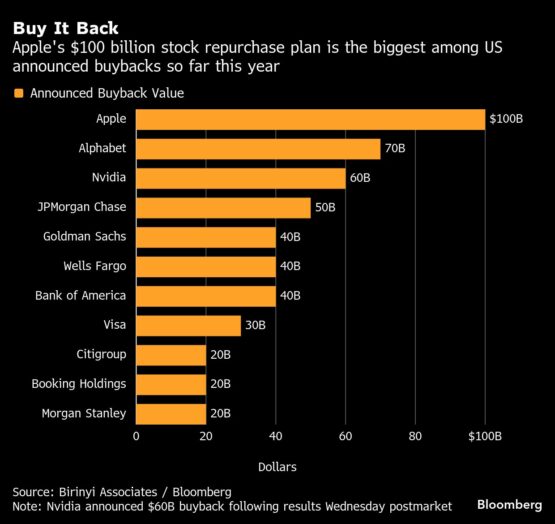
🔹 Share Repurchases: $3.5B (44.5M shares)
🔹 Discrete Tax Benefit: $313M (or $0.09/share)
🔹 Gain on Servicing Sale: $263M (or $0.06/share)
🔹 Loss on Debt Securities Repositioning: $(149)M (or $(0.03)/share)
Segment Highlights
Consumer Banking & Lending:
🔹 Revenue: $8.91B; DOWN -2% YoY
🔹 Net Income: $1.69B; DOWN -1% YoY
🔹 Average Loans: $318.1B; DOWN -4% YoY
🔹 Average Deposits: $778.6B; UP +1% YoY
🔸 Credit Card Revenue: UP +2%
🔸 Auto Lending: DOWN -21%
🔸 Personal Lending: DOWN -10%
🔸 Home Lending: Flat YoY
Commercial Banking:
🔹 Revenue: $2.93B; DOWN -7% YoY
🔹 Net Income: $794M; DOWN -19% YoY
🔹 Net Interest Income: DOWN -13%
🔸 Higher treasury & investment banking fees helped offset rate pressure
🔹 Average Loans: $223.8B; Flat YoY
🔹 Average Deposits: $182.9B; UP +11% YoY
Corporate & Investment Banking:
🔹 Revenue: $5.06B; UP +2% YoY
🔹 Net Income: $1.94B; DOWN -2% YoY
🔸 Investment Banking Revenue: UP +13%
🔸 Commercial Real Estate: UP +18%
🔸 Markets Revenue: Flat
🔹 Average Loans: $277.3B; DOWN -2% YoY
🔹 Average Deposits: $203.9B; UP +11% YoY


