
🔹 Revenue: $3.5B (Est. $3.42B) 🟢 +2% YoY
🔹 EPS: $0.51 (Est. $0.45) 🟢
🔹 Comparable Sales: +2% (Est. +1.6%) 🟢
Tariff Impact:
🔸 Minimal in Q2.
🔸 FY gross impact of $250M–$300M if tariffs stay; after mitigation, net ~$100M–$150M weighted to H2.
FY Outlook
🔹 Revenue: +1% to +2% (vs. $15.1B in FY24)
🔹 Operating Income: +8% to +10% (vs. $1.1B in FY24)
🔹 Net Interest Income: ~$15M
🔹 Effective Tax Rate: ~26%
🔹 CapEx: ~$600M
🔹 Net Store Closures: ~35
Q2 Outlook
🔹 Revenue: Flat YoY
🔹 Gross Margin: Similar to Q1 (41.8%)
🔹 Operating Expense (% of Sales): Slight leverage YoY
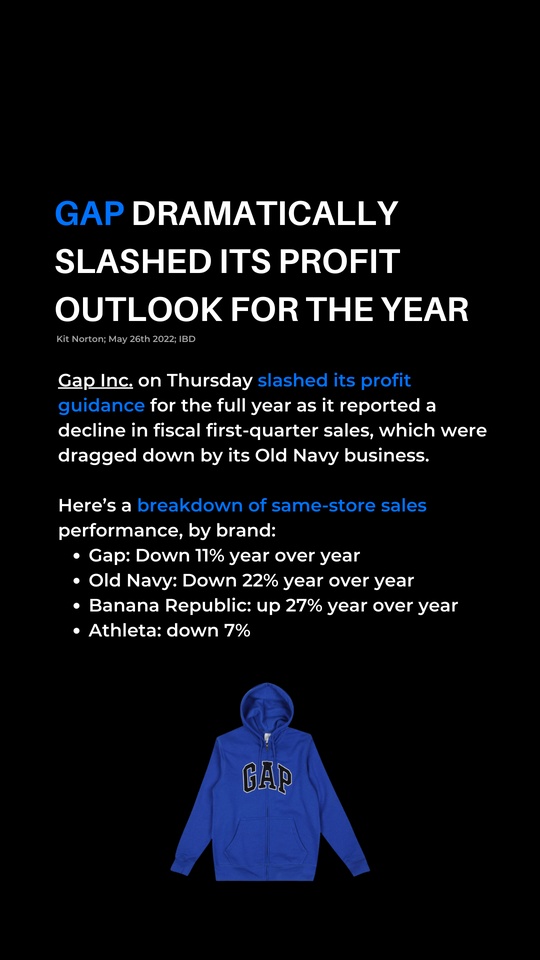
Brand-Level Comparable Sales (Q1 FY25)
🔹 Old Navy: +3% (9th straight quarter of share gains)
🔹 Gap: +5% (6th straight positive comps, 8th quarter share gain)
🔹 Banana Republic: Flat (Net sales -3%)
🔹 Athleta: -8% (Net sales -6%)
Other Q1 Metrics:
🔹 Gross Margin: 41.8% (+60 bps YoY)=
🔹 Online Sales: +6% YoY; 39% of total sales
🔹 Store Sales: Flat YoY; 2,496 company-operated out of ~3,500 total stores=
🔹 Inventory: $2.1B (+7% YoY)
🔹 Cash & Short-Term Investments: $2.2B (+28% YoY)
🔹 Free Cash Flow: -$223M
🔹 Shareholder Return: $131M via dividends and buybacks
🔹 Shares Repurchased: 4M for $70M
🔹 Dividend: $0.165/share approved for Q2
CEO Commentary
🔸 "Exceeded expectations. Positive comps for the 5th straight quarter. Brand reinvigoration is working. Staying focused on controllables for long-term growth." – Richard Dickson, CEO