With $SOFI (+1,93 %) not to have joined? I certainly did in the past and I missed out. Now, with the cooling economy in the USA, I see more risks than opportunities at the current level.
Investing.com - The US stock market has told many stories in recent months - of price setbacks, AI euphoria and fears of recession. One story stands out in particular: that of SoFi Technologies (NASDAQ:SOFI). The digital finance company reached a milestone last year that many fintechs never achieve: GAAP profits. SoFi is thus proving that it can not only grow, but also earn money sustainably.
For investors, the question now is: Is SoFi still a buy at the current price level of USD 25.76 - or is the air already out?
A "one-stop store" for all financial needs
SoFi has long been much more than a niche provider in the US. The platform offers a full range of digital financial services: loans, savings and current accounts, investments and insurance. In particular, the bank charter that SoFi received in 2022 gives the company a clear competitive advantage. Unlike pure fintechs, SoFi can refinance loans with low-cost deposits - an advantage that is clearly reflected in margins in the current interest rate environment.
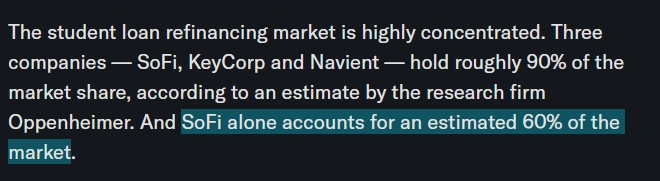
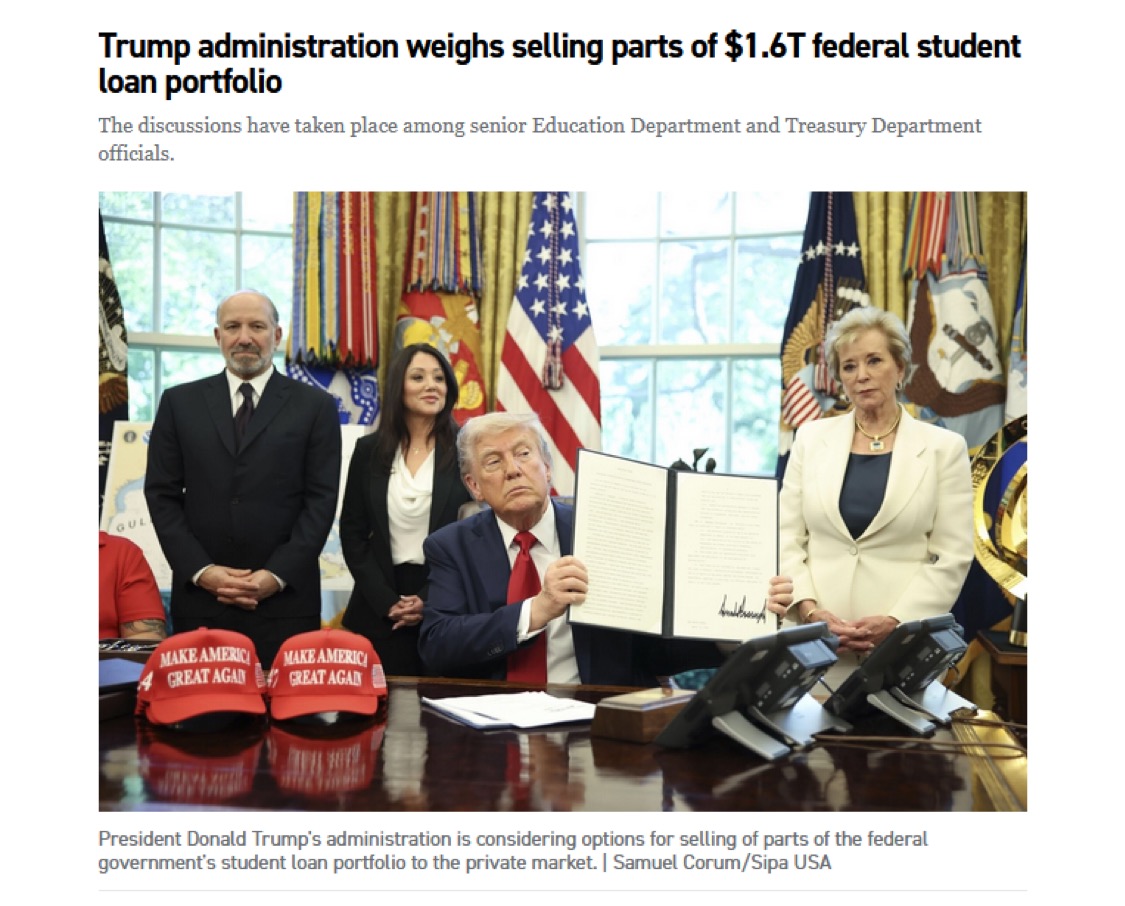
The most important growth driver is the Loan Platform Business (LPB). Originally launched as a student loan specialist, SoFi now finances a broad portfolio. The LPB alone reaches an annual volume of over USD 9.5 billion and generates more than USD 500 million in high-margin fee income - after just one year.
Diversification as a second pillar
But SoFi is no longer just a lender. More than half of its revenue now comes from the Financial Services and Technology Platform divisions. In the second quarter of 2025, the company generated a record fee of 378 million US dollars, an increase of 72% compared to the previous year. This shows how successfully SoFi is making the transition to low-capital, recurring income.
At the same time, the member base is growing rapidly: 850,000 new users joined in the second quarter of 2025 alone. In total, SoFi now has over 11.7 million members, an increase of 34% year-on-year. This dynamic not only ensures economies of scale, but also increasing brand awareness: with 8.5% unsupported awareness, SoFi has reached a new high in the US financial sector.
Analysts are betting on rising share prices
The positive development has not gone unnoticed by analysts. Mizuho recently raised its price target to USD 31 and Needham has a buy recommendation at USD 29. This corresponds to a price potential of between 12 and 20 percent.
It is interesting to look at the figures from InvestingPro: while the tool shows a fair value of USD 18.12 (i.e. around 30% below the current price), analysts see the value at USD 21 - only slightly below the market price. The difference makes it clear that investors are currently paying a high premium on the future expectations of SoFi.
Source: InvestingPro
Growth story meets risk
There is no doubt that SoFi delivers impressive growth figures. Over the past five years, sales have risen by an average of 43% annually. Sales of 3.43 billion US dollars are expected for 2025, rising to 4.25 billion US dollars by 2026.
Source: InvestingPro
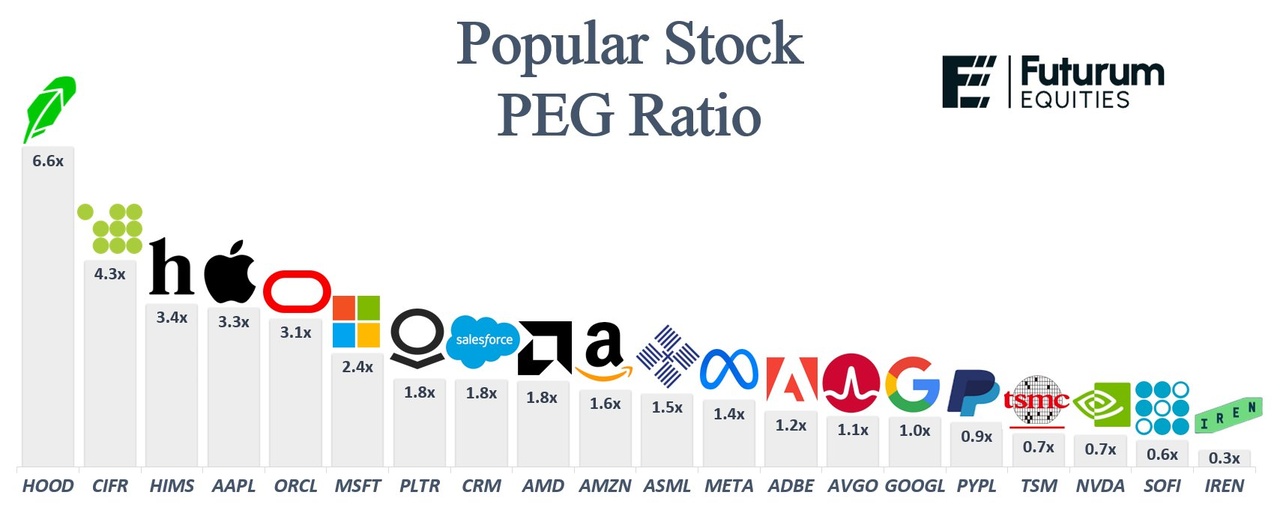
However, the valuation is high: with a current P/E ratio of 54.9 (based on the last 12 months) and a forward P/E ratio of almost 81, investors are paying a steep premium. By comparison, the historical three-year P/E ratio is just under 18.
Source: InvestingPro
The balance sheet also harbors risks. Credit quality is robust - the average SoFi customer has a FICO score of 743 and an income of USD 161,000. Nevertheless, the business model remains sensitive to economic downturns. Should unemployment rise or the credit markets falter, defaults could increase rapidly. Neither of these issues is currently acute, but they should still be kept in mind.
There is also competition: traditional banks are strengthening their digital offerings, while other fintechs are entering the market with aggressive growth strategies.
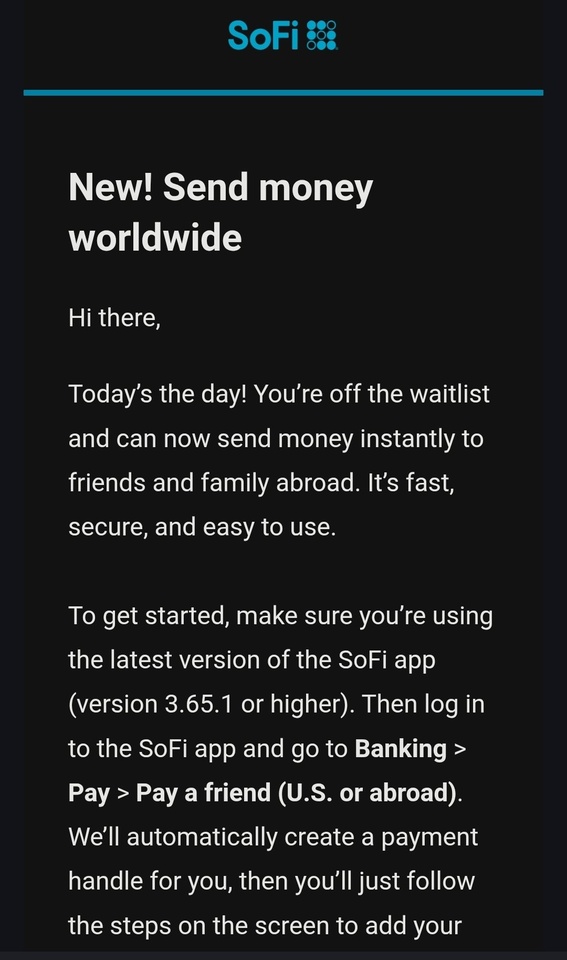
Despite these risks, SoFi is investing heavily in the future. With projects such as blockchain-based money transfers and a return to crypto trading, the company is trying to tap into additional sources of income.
Particularly exciting: the AI initiative "Cash Coach". This tool analyzes members' liquidity and provides individual recommendations on how they can improve their returns. SoFi is thus positioning itself not just as a lender or broker, but as a next-generation digital financial advisor.
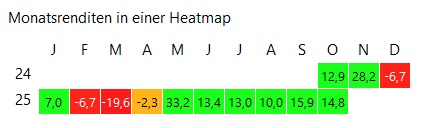
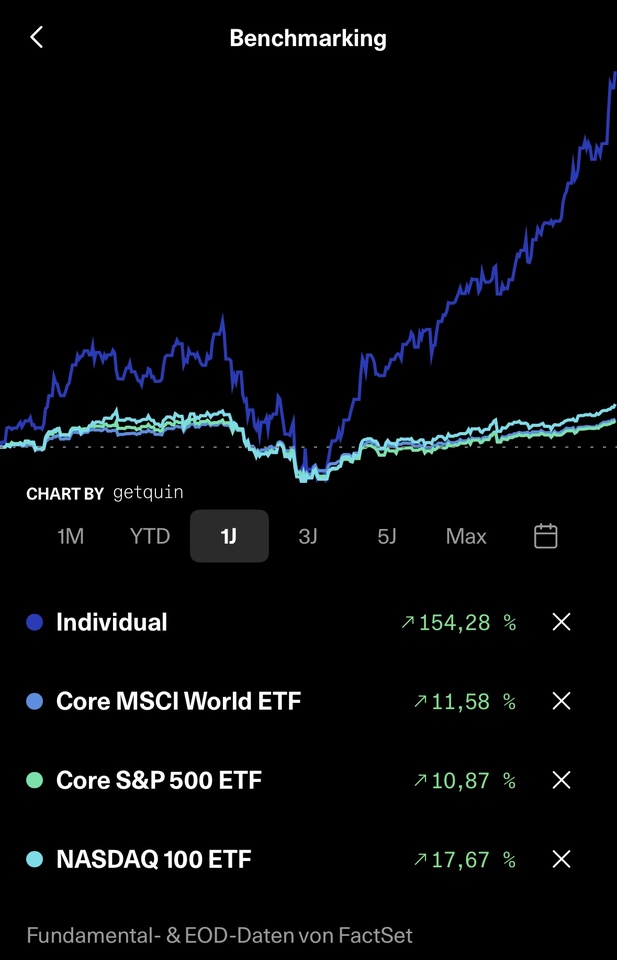
Since the beginning of the year, the share price has risen by over 67%, and by as much as 230% over a twelve-month period. Anyone who bought in three years ago is now sitting on a gain of over 400 percent. The downside: high volatility. With a beta of 1.94, the share price fluctuates almost twice as much as the market as a whole - not for the faint-hearted.
Source: InvestingPro
Conclusion: A bet on the future
SoFi is one of the most exciting fintech companies on the market. The mix of strong member growth, innovative products and a profitable business model makes the stock attractive - provided you are prepared to accept the high valuation and the risk of economic setbacks.
For long-term investors who want to play growth opportunities for years to come, SoFi can be a worthwhile component of a portfolio.