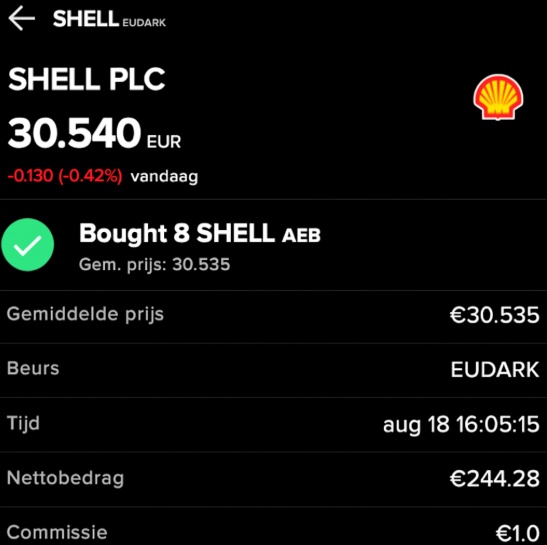
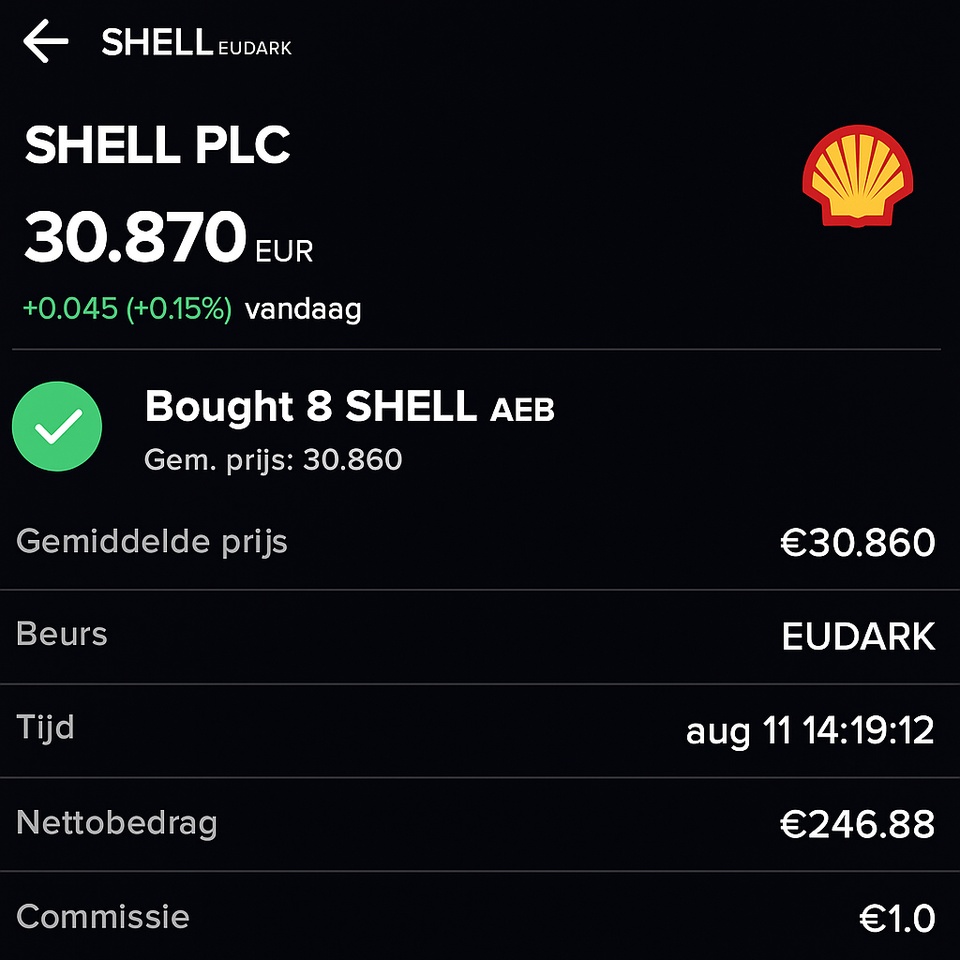
New weekly update with another purchase.
#dividend
#dividends
#etfs
#investing
$SHEL (-0,39 %)
$BP. (-0,07 %)
$XOM (+0,42 %)
$CVX (+0,43 %)
$TTE (-1,22 %)
Postes
86New weekly update with another purchase.
#dividend
#dividends
#etfs
#investing
$SHEL (-0,39 %)
$BP. (-0,07 %)
$XOM (+0,42 %)
$CVX (+0,43 %)
$TTE (-1,22 %)
$CVX (+0,43 %) am building up a long-term dividend position here. Who else is on board with CVX? RR
The tanker market in late March 2025 is firing on multiple fronts. VLCC rates shot up as Middle East cargoes snapped up ships, while Suezmax hit a yearly high in the Mediterranean with Kazakh oil pumping strong. Aframax lags with patchy demand, but clean tankers—LRs, MRs, and Handymax—are riding an Eastern wave of gains. U.S. sanctions are slamming shadow fleets, proposed port fees on Chinese ships spark debate, and Red Sea tensions stretch routes. Venezuela’s export shake-up looms, and Russian oil keeps flowing through sneaky transfers. It’s a high-stakes scene with solid rates and big uncertainties brewing.
This update breaks down VLCC, Suezmax, Aframax, and LR/MR/Handymax trends, plus the forces rocking the boat. From freight spikes to geopolitical jolts, here’s the full picture—laid out clear and simple.
⏬ VLCC Market: Rates Jump, Eyes on April
VLCCs, the giants of crude shipping, saw rates leap to $52,100/day on Middle East-to-Asia runs—a 33% weekly jump—as Saudi April cargoes drained a tight tonnage pool.
A MEG/Korea trip hit WS 67.5 ($51,536/day TCE), nudging toward WS 70, while West Africa to China (TD15) climbed to WS 66.75 ($49,598/day) and U.S. Gulf to China (TD22) rose to $7.797M ($40,321/day).
Atlantic support comes from Brazil and West Africa, but U.S. Gulf stumbles—tariff threats of $1.5M per port call on Chinese-built ships slow exports, though TD22 gained $455,000.
Sanctions nabbed five VLCCs like Kohana (Iran-linked) and tracked Sovcomflot’s STS off Hong Kong—700,000 barrels to Hannah—yet India (1.6M bpd) and China keep Russian oil flowing.
Venezuela’s 790,000 bpd exports face a Chevron $CVX (+0,43 %) exit—Clarksons predicts a 0.5% tonne-mile boost if Middle East crude fills the U.S. gap.
The Daban’s month-long Russian oil trek ended in Qingdao, dodging sanctions via three Sovcomflot Aframaxes—shadow fleets adapt fast.
Fearnley sees yields over 10% for Frontline $FRO (-3,46 %) and DHT $DHT (-1,6 %) —rates could stick above $50,000/day if April stays hot, though futures lag the spot surge.
Activity’s set to hum—Atlantic production rises as peak export season nears, keeping owners hopeful.
⏳ Suezmax Market: Med Peaks, West Wavers
Suezmax in the Mediterranean soared to $63,000/day—a year-high—driven by 38 CPC cargoes from Kazakhstan’s Tengiz field (960,000 bpd via Black Sea).
Globally, rates averaged $52,000/day, up 21%, but Nigeria to UK (TD20) slipped to WS 95.56 ($40,980/day), and CPC/Med (TD6) eased to WS 129.25 ($62,910/day).
West Africa and U.S. Gulf softened—TD20 dropped 7 points, and a Wilhelmshaven relet fell to WS 92.5 after a WS 100 sub—charterers dodged a hike past WS 90.
Germany seized the Eventin (152,000 dwt) with Russian oil in the Baltic—a $30M prize—signaling rare crackdowns on shadow fleets.
Middle East’s TD23 held steady at WS 92.5-93, despite ships shifting west—9M barrels head to Asia in March, 3M more booked for April.
Ukrainian drone hits on CPC pipelines didn’t dent loadings—Kazakh cuts for OPEC+ loom, but no big slowdown shows yet.
Allied notes Western momentum, though Atlantic demand lags—rates might climb further if tonnage stays tight and Asia pulls more.
Owners eye a spillover—West Africa’s steady gains could tighten things up if Med strength holds.
⏱️ Aframax Market: Flat but Flickers
Aframax, the smaller crude runners, stayed muted—North Sea’s TD7 parked at WS 107.5 ($25,500/day), while U.S. Gulf’s TD26 rose to WS 135.83 ($26,577/day).
Mediterranean’s TD19 ticked up to WS 120.61 ($29,000/day), but demand’s weak—March stems are scarce, pushing dates to early April.
U.S. Gulf to UK (TD25) gained to WS 145.56 ($34,697/day), hinting at life as ships ballast out—sanctions hit three Sovcomflot units like Volans.
Russian oil STS off Hong Kong (700,000 barrels) and Nakhodka Bay glitches (e.g., Canis Power) highlight shadow fleet risks—lists still show surplus tonnage.
CPC Aframax loadings fell to 25 in February from 33, with Suezmax taking the load—Kazakh shifts keep things lopsided.
North Sea and CPC lack punch—U.S. firming could lift rates to $30,000/day, but it’s a waiting game for now.
Owners see quiet fixes—consistency’s missing, though Atlantic flickers offer a slim chance of a push.
1 Year T/C - VLCC SUEZMAX AFRAMAX ECO / SCRUBBER - March 19th
⏸️ LR/MR/Handymax Market: Clean Gains East
LR2s in the MEG topped out at WS 166.94 on TC1 (75kt to Japan), now WS 164.17, with TC20 to UK at $4.2M—Med/East (TC15) dipped to $3.04M.
LR1s climbed—TC5 (55kt MEG/Japan) reached WS 180.94, TC8 to UK hit $3.33M—while UK’s TC16 stayed flat at WS 112.5.
MRs roared in the MEG—TC17 to East Africa soared to WS 262.86—UK’s TC2 rose to WS 172.5 ($21,004/day), and U.S. Gulf’s TC14 jumped to WS 121.79.
Handymax rallied—Med’s TC6 hit WS 268.33, UK’s TC23 crossed WS 200 to WS 207.5—naphtha demand from Asia’s petrochemical boom drives it.
Sanctions cut scrubber premiums to $400/day—VLSFO ($497/tonne) edges out HSFO ($439.50)—some owners ditch scrubbers for profit.
U.S. Gulf MRs woke up—TC18 to Brazil hit WS 175.71, TC21 to Caribbean rose 40% to $617,857—Atlantic TCE basket climbed to $27,847.
Eastern rates rule—West gains traction, but Asia’s petrochemical pull keeps clean tankers humming strong.
🌐 What’s Stirring It: Sanctions and Shifts
U.S. sanctions target Iran (Shandong refiner, eight tankers) and Russia (Sovcomflot STS)—India, China, and Venezuela (790,000 bpd) adapt fast.
FMC eyes chokepoints (e.g., Suez) for bans—$1M-$100M fees on Chinese ships could clog U.S. ports, says Bimco—coal and grain face big cost hikes.
Red Sea airstrikes vs. Houthis stretch routes—Clarksons sees container rates up by June—crude pivots to Atlantic as Russia/Iran tighten.
Kazakh CPC oil (960,000 bpd) and Asian demand juice Suezmax and clean tankers—U.S. Gulf lags under tariff clouds.
Venezuela’s Chevron $CVX (+0,43 %) exit could shift long-haul crude—sanctions and fees might reshape flows, not kill them.
It’s a sanctions-loaded, trade-twisting mix—rates ride high now, but disruption’s lurking.
USS Harry S. Truman carrying out strikes against the Houthis
🚨 Outlook: Hot Streaks, Big Risks
VLCCs might hold $50,000+/day if April cargoes pile on—Atlantic could add steam as exports peak.
Suezmax peaks in the Med at $60,000+/day—West needs a demand jolt—sanctions keep tightening the vise.
Aframax waits for traction—$30,000/day’s in reach if U.S. stirs—clean LR/MR/Handymax bank on Asia’s heat.
Port fees and Red Sea chaos could spike costs—volatility’s brewing, but strength’s got legs for now.
💬 What’s Your View?
Riding VLCC highs, or betting on Suezmax’s Med run? Drop your thoughts—let’s dig in! 🚢
*The Worldscale (WS) rate is a system used to calculate tanker freight rates, where WS 100 represents a standard base rate for a specific route. Rates above or below this benchmark indicate how much more or less a charterer will pay relative to the base cost. A higher WS rate means better earnings for shipowners, while a lower WS rate means lower transportation costs for charterers.
Chevron has now also smelled a rat. I will continue to buy more from time to time.
In uncertain times, it is important to keep a watchlist so that you can pick up stable shares at bargain prices. I hope we go down a few more levels, another -20% would be nice, even if the short to medium-term price losses hurt.
I currently have almost 30 stocks on my watchlist, some of which are attractive in terms of price, while others are still far too high for me. I have not listed stocks that are already in my portfolio and that I would like to buy (in order of dividend amount):
Hercules Capital $HTGC (-0,08 %) or Main Street Capital $MAIN (-0,27 %)
Chevron $CVX (+0,43 %)
Vinci SA $DG (-1,75 %)
United Parcel Service $UPS (-0,28 %)
3i Infrastructure $3IN (+1,1 %)
Iron Mountain $IRM (-0,06 %)
Micro Star International $MSS
Nextera Energy $NEE (+1,15 %)
Partners Group $PGHN (-3,84 %)
Itochu Shoji $8001 (-2,67 %)
Canadian National Railway $CNR (-1,15 %)
Svenska Cellulosa $SCA B (-2,57 %)
VAT $VAT
Investor AB $IVSB
Assa Abloy $ASSA B (-0,81 %)
Linde $LIN (-0,02 %)
John Deere $DE (-1,51 %)
Landstar Systems $LSTR (+0,37 %)
Dover Corporation $DOV (-0,48 %)
Alimentation Couche-Tard $ATD (-0,13 %)
ASML $ASML (-3,38 %)
Infineon Technologies $IFX (-3,71 %)
Sherwin-Williams $SHW (-0,14 %)
Tencent $700 (-2,67 %)
Microsoft $MSFT (-0,86 %)
S&P Global Inc. $SPGI (+0,1 %) or Moody's Corp. $MCO (-0,29 %)
Visa $V (-0,53 %) or Mastercard $MA (-0,72 %)
Ferrari $RACE (-1,21 %)
Which stocks do you have on your watchlist?
In the still young year, the DAX has already recorded 16 record highs, the last one only yesterday. Most other stock market indices are also close to their all-time highs.
Where can you still invest now?
Handelsblatt experts have analyzed 1,000 stocks worldwide and identified 15 recommendations in three categories:
$FTNT (-0,71 %) Fortinet | $NOVO B (-1,5 %) Novo Nordisk | $GDDY (+0,61 %) GoDaddy | $PLD (+0,37 %) ProLogis | $NOW (-0,59 %) Service Now
$PEP (+1,48 %) PepsiCo | $CVX (+0,43 %) Chevron | $FPE Fuchs Petrolab | $NWN (+0,82 %) Northwest Natural Holding | $SAN (-1,81 %) Sanofi
$SLB (-0,06 %) Schlumberger | $BIIB (+0,16 %) Biogen | $GPN (-0,18 %) Global Payments | $MAKSY Marks & Spencer | $VOW (-4,46 %) Volkswagen
Detailed analysis can be found at "Handelsblatt"
Source: Handelsblatt | Image: ChatGPT
- Oil
- gas
- EU emissions trading
- Copper
- Aluminum
- Gold
- Silver
Link: https://shorturl.at/5VrEF
#gold
#silber
#öl
#oiel
#kupfer
#aluminium
#metall
#edelmetalle
$SHEL (-0,39 %)
$TTE (-1,22 %)
$ABX (+2,16 %)
$GLDA (+1,35 %)
$GOLD (+2,77 %)
$LNVA
$GOLD
$DE000EWG0LD1 (+1,21 %)
$B7GN
$PAAS (+1,93 %)
$PHAG (+0,08 %)
$SLV (+0,3 %)
$1BRN
$IOIL00 (+0,72 %)
$WTI
$WTI
$CVX (+0,43 %)
$XOM (+0,42 %)
$OXYP34
$ALEX
$OD7A
$ALUM (-0,41 %)
$COPA (-1,48 %)
$OD7C
$SCCO (-2,37 %)
$GLEN (-4,84 %)
$RIO (-4,2 %)
$RIO (-3,71 %)
$RIO (-3,1 %)
In the following post, I would like to discuss the new US tariffs and their potential economic consequences. The background and the potential impact on inflation and companies, as well as the winners and losers on the stock market, will be discussed.
Again, of course, the stocks mentioned do not constitute investment advice, but merely serve as examples of possible beneficiaries or losers of tightening trade restrictions. Historical developments are no guarantee of future returns.
__________
In this post:
__________
The topic of "tariffs" is currently not only very present in the media, but the term "tariffs" has also been discussed with a strong increase in the past earnings calls of companies in the S&P 500, as the following chart shows [1].
The chart shows that the discussion about tariffs has intensified in recent months and is having an ever greater impact on the outlook in companies' annual reports.
The data is presented as a three-month average and broken down into various sectors, including e.g. industry, healthcare, consumer goods, information technology, etc.
I am curious to see how the stock markets will behave in the coming week. In addition to the current reporting season, the topic of "tariffs" will certainly dominate.
After the tough tariffs announced after Trump took office were not immediately enforced and there was a "slight" sigh of relief, there could now be a new reaction on the markets, as there was on Friday evening. slightly was already slightly noticeable on Friday evening when the markets turned towards the evening.
A looming trade conflict could not only affect individual companies, but also further fuel inflation in the US:
💰 Influence on inflation
On January 31, Deutsche Bank published a forecast on the potential impact of tariffs on the inflation rate [2]:
The chart compares the current forecast with the forecast before the "Trump" era and takes into account various scenarios for the passing on of tariffs (pass-through) by Canada and Mexico.
Two scenarios are considered: one with a 50% pass-through of tariffs (additional increase shown in dark green) and one with a 75% pass-through (light green). It is clear that the inflation rate could rise sharply again this year and fall again by 2027.
🛃 New tariffs in force & further measures planned
As of today, February 1, 2025, the US government and Donald Trump have imposed new import tariffs on Mexico, Canada and China:
According to the White House spokesperson, these measures are, among other things, a response to the failure of these countries to stop the influx of fentanyl and illegal immigrants into the USA. [3]
But this is just the beginning:
From mid-February, the USA will also impose tariffs on strategic goods [4], including:
🚨 Trump relies on escalation - Canada announces retaliation
Yesterday, Canadian government representatives, including Foreign Minister Mélanie Joly, tried to prevent the tariffs in Washington, but to no avail.
Trump made it clear before his departure to Mar-a-Lago [5]:
"We have a 200 billion dollar trade deficit with Canada. Why should we subsidize Canada?"
The EU could also soon be targeted, as Trump hinted:
"Absolutely! The European Union has treated us so terribly!"
🔄 Canada's reaction:
Prime Minister Justin Trudeau announced that Canada will not back down and will respond with "swift and robust countermeasures".
The government is planning a three-stage retaliation strategy [5]:
However, this last step in particular would be a double-edged sword, as Canada is heavily dependent on energy cooperation with the USA.
Economic experts in the US are already warning of the consequences of a trade war [5]:
But Trump remains firm:
"Maybe there will be short-term disruption, but in the long run the tariffs will make us very rich and very strong."
🌎 Possible consequences for the global economy
(a) Rising prices in the USA
(b) Retaliation & new trade wars?
(c) Effects on the stock market
🏆 Winners & losers - which companies will benefit, which will suffer?
Possible beneficiaries of the tariffs
US manufacturers of steel, aluminum & copper
Domestic pharmaceutical and biotech companies
Energy companies with US production
Chip manufacturers with US production
😥 Companies that could suffer from the tariffs
Chip manufacturers with global supply chains
Car manufacturers with global suppliers
Companies with strong export business
US retailers with a high import share
🧠 Possible investment strategies
Favor defensive sectors:
Exploit long-term opportunities in "reshoring":
Conclusion: Will the trade conflict escalate further?
With the new tariffs, Trump is taking a confrontational stance and Canada, Mexico and China are preparing for retaliatory measures. If further tariffs on European goods follow, the situation could worsen.
❓Which stocks do you think could be most affected? Which beneficiaries do you see?
Thanks for reading! 🤝
__________
Sources:
[4]
[5] https://www.tagesschau.de/ausland/amerika/usa-trump-strafzoelle-100.html
🔹 Adj. EPS: $2.06 (Est. $2.19) 🔴; DOWN -40.3% YoY
🔹 Revenue: $48.3B (Est. $47.0B) 🟢; DOWN -7.5% YoY
🔹 Net Income: $3.2B (Est. $4.03B) 🔴; DOWN -52% YoY
🔹 Operating Cash Flow (CFFO): $8.7B (Est. $8.68B) 🟡; DOWN -29.8% YoY
Segment Performance:
🔹 Upstream Earnings: $4.30B (Est. $2.34B) 🟢; UP +171.4% YoY
🔹 U.S. Upstream Earnings: $1.42B (Est. $1.98B) 🔴
🔹 International Upstream Earnings: $2.88B (Est. $2.47B) 🟢
🔹 Downstream Earnings: -$248M (Est. $188.5M) 🔴
🔹 U.S. Downstream Earnings: -$348M (Est. $132M) 🔴
🔹 International Downstream Earnings: $100M (Est. $194M)
Production Metrics:
🔹 Total Production: 3,350K BOE/d (UP +7% YoY)
🔹 U.S. Production: 1,646K BOE/d (UP +19% YoY)
🔹 International Production: 1,704K BOE/d (DOWN -5% YoY)
🔹 Liquids Production (U.S.): 1,189K BBL/d
🔹 Liquids Production (Intl.): 797K BBL/d
🔹 Natural Gas Production (U.S.): 2,743 MMCF/d
🔹 Natural Gas Production (Intl.): 5,437 MMCF/d
Financial & Operational Metrics:
🔹 Free Cash Flow (FCF): $4.4B (Est. $7.57B) 🔴; DOWN -45.7% YoY
🔹 Capital Expenditure (Capex): $4.3B (Est. $4.08B) 🟡
🔹 Dividend Increase: +5% to $1.71/share, payable March 10, 2025
FY25 Guidance & Strategic Updates:
🔹 FY25 Initial Oil Production Target: 1M BOE/d
🔹 Organic Capex Range: $14B-$16B (Prev. $14.5B-$15.5B)
🔹 Buyback Commitment: $10B-$20B per year, depending on market conditions
🔹 **Targeting $2B-$3B in structural cost reductions by end of 2026
CEO Mike Wirth's Commentary:
🔸 "In 2024, we delivered record production, returned a record $27B to shareholders, and made key strategic advancements, including major project startups and acquisitions."
Hello everyone 🤘🏻👨🏻💻,
for fun I let ChatGPT play as my investment advisor and asked how he could invest 3.500 € in shares in shares. His answer:
📌 4x $CVX (+0,43 %)
📌 5x $TTE (-1,22 %)
📌 3x $ALV (-1,6 %)
📌 3x $JPM (-1,85 %)
📌 1x $ASML (-3,38 %)
📌 1x $AVGO (-1,92 %)
📌 10x $VHYL (-0,93 %)
Doesn't sound so wrong to me 👀.
How would you currently invest €3,500? 👆🏻🤓