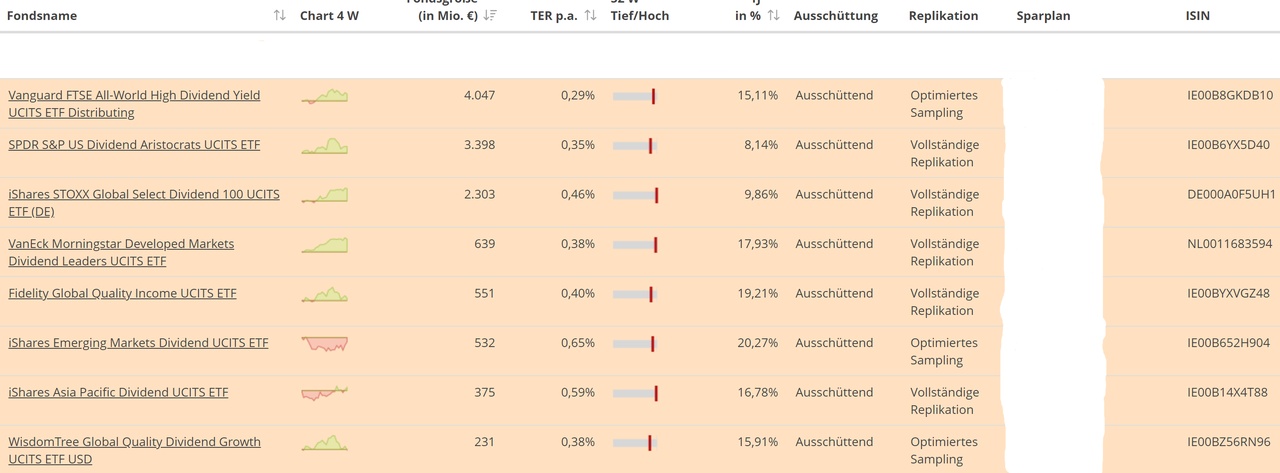
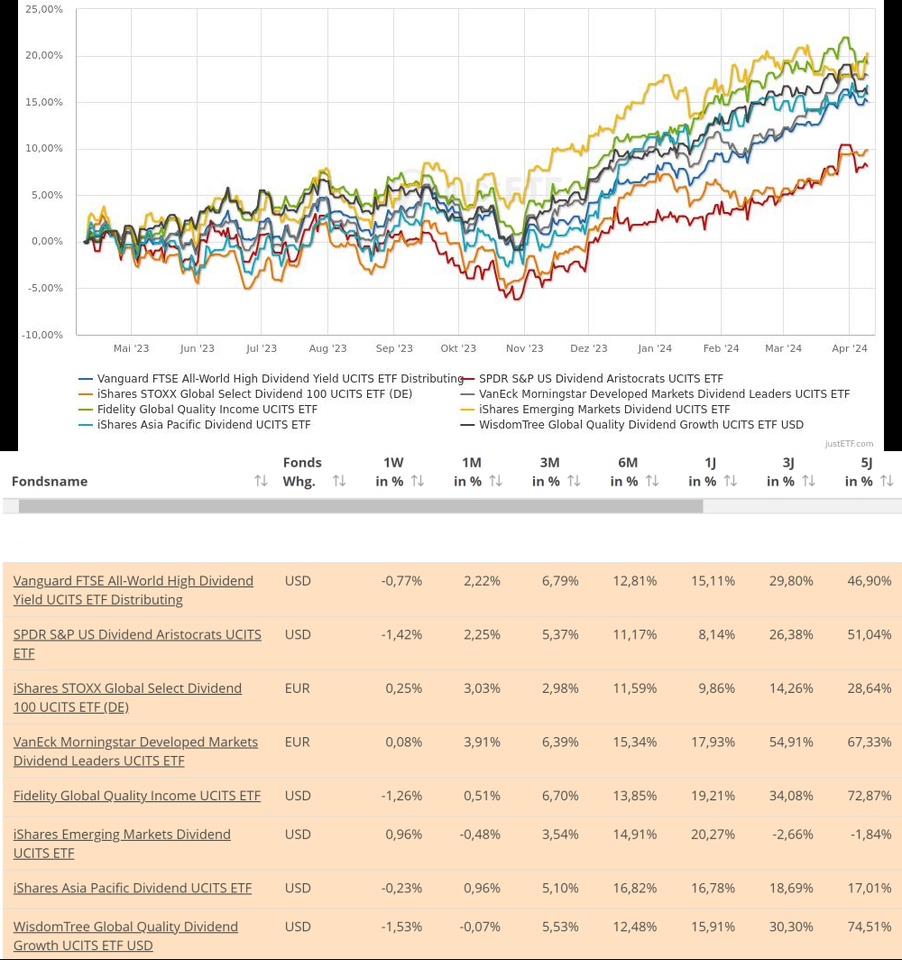
(Intended as an incentive and to make searching easier - as of 29.02.2024)
$VHYL (+1,77 %) - Vanguard FTSE All-World High Dividend Yield UCITS ETF
$SPYD (+1,42 %) - SPDR S&P US Dividend Aristocrats UCITS ETF
$ISPA (+1,11 %) - iShares STOXX Global Select Dividend 100 UCITS ETF
$TDIV (+1,56 %) - VanEck Morningstar Developed Markets Dividend Leaders UCITS ETF
$SEDY (+1,06 %) - iShares Emerging Markets Dividend UCITS ETF
$IAPD (+1,35 %) - iShares Asia Pacific Dividend UCITS ETF
$FGEQ (+2,68 %) - Fidelity Global Quality Income UCITS ETF
$GGRP (+2,36 %) - WisdomTree Global Quality Dividend Growth UCITS ETF USD
Overview:

Chart and performance comparison:

Details:
$VHYL (+1,77 %) - Vanguard FTSE All-World High Dividend Yield UCITS ETF
Distribution yield 2024 = 3.05
Distribution interval Quarterly

Description:
The Vanguard FTSE All-World High Dividend Yield UCITS ETF Distributing tracks the FTSE All-World High Dividend Yield Index. The FTSE All-World High Dividend Yield Index provides access to global equities with high dividend yields.
The TER (total expense ratio) of the ETF is 0.29% p.a.. The Vanguard FTSE All-World High Dividend Yield UCITS ETF Distributing is the cheapest and largest ETF that tracks the FTSE All-World High Dividend Yield Index. The ETF replicates the performance of the index through a sampling process (purchase of a selection of the index components). The dividend income in the ETF is distributed to investors. distributed to investors (quarterly).
The Vanguard FTSE All-World High Dividend Yield UCITS ETF Distributing is a very large ETF with a fund volume of 4,047 million euros fund volume.
Largest 10 positions:
Weight of the largest 10 positions - 14.05% of a total of 1,855 positions
Broadcom 2.04%
JP Morgan Chase 1.95%
Exxon Mobil 1.54%
Johnson 1.41%
Home Depot 1.39%
P&G 1.36%
Merck & Co 1.17%
AbbVie 1.13%
Toyota Motor 1.05%
Nestle 1.01%
Dividends:
$SPYD (+1,42 %) - SPDR S&P US Dividend Aristocrats UCITS ETF
Distribution yield 2024 = 2.05 %
Distribution interval Quarterly

Description:
The SPDR S&P US Dividend Aristocrats UCITS ETF tracks the S&P High Yield Dividend Aristocrats Index. The S&P High Yield Dividend Aristocrats Index provides access to stocks in the S&P Composite 1500 Index that have increased their dividends over the last 20 consecutive years.
The TER (total expense ratio) of the ETF is 0.35% p.a.. The SPDR S&P US Dividend Aristocrats UCITS ETF is the only ETF that tracks the S&P High Yield Dividend Aristocrats Index. The ETF replicates the performance of the index through full replication (purchase of all index components). The dividend income in the ETF is distributed to investors. distributed to investors (quarterly).
The SPDR S&P US Dividend Aristocrats UCITS ETF is a very large ETF with a fund volume of 3,398 million euros fund volume.
Largest 10 positions:
Weight of the largest 10 positions - 17.69% - of a total of 136 positions
3M 2,18%
Realty Income 2.04%
Edison International 1.83%
IBM 1.74%
AbbVie 1.72%
Chevron 1.71%
T Rowe Price Group 1.67
Exxon Mobil 1.60%
Kimberly- Clark 1.60%
Eversource Energy 1.60%
$ISPA (+1,11 %) - iShares STOXX Global Select Dividend 100 UCITS ETF

Distribution yield 2024 = 5.9%
Distribution interval Quarterly
Description:
The iShares STOXX Global Select Dividend 100 UCITS ETF (DE) tracks the STOXX® Global Select Dividend 100 Index. The STOXX® Global Select Dividend 100 Index tracks the performance of the 100 companies with the highest dividend yields in Europe, America and Asia.
The TER (total expense ratio) of the ETF is 0.46% p.a.. The iShares STOXX Global Select Dividend 100 UCITS ETF (DE) is the cheapest and largest ETF that tracks the STOXX® Global Select Dividend 100 Index. The ETF replicates the performance of the index through full replication (purchase of all index components). The dividend income in the ETF is distributed to investors. distributed to investors (at least annually).
The iShares STOXX Global Select Dividend 100 UCITS ETF (DE) is a very large ETF with a fund volume of 2,303 million euros fund volume.
Largest 10 positions
Weight of the largest 10 positions -23.11% of a total of 100 positions
SITC International Hldgs 3.26%
Mitsui OSK Lines 3.04%
Yancoal Australia 3.04%
Pacific Basin Shipping 2.27%
JB Hi-Fi 2.19%
Fortescue 2.00%
Woodside Energy Group 1.93
Harvey Norman Holdings 1.90%
New Hope 1.76%
Taylor Wimpey 1.72%
$TDIV (+1,56 %) - VanEck Morningstar Developed Markets Dividend Leaders UCITS ETF
Total expense ratio (TER): 0.38%
Replication method: Physical (full replication)
Distribution yield 2024 = 4.62%
Distribution interval Quarterly
Description:
The VanEck Morningstar Developed Markets Dividend Leaders UCITS ETF tracks the Morningstar Developed Markets Large Cap Dividend Leaders Screened Select Index. The Morningstar Developed Markets Large Cap Dividend Leaders Index provides access to companies that demonstrate consistency and sustainability in dividend payments and meet the screening criteria. Only stocks from developed markets are included in the index. The stocks included are filtered according to ESG criteria (environmental, social and governance).
The TER (total expense ratio) of the ETF is 0.38% p.a.. The VanEck Morningstar Developed Markets Dividend Leaders UCITS ETF is the only ETF that tracks the Morningstar Developed Markets Large Cap Dividend Leaders Screened Select Index. The ETF replicates the performance of the index through full replication (purchase of all index components). The dividend income in the ETF is distributed to investors. distributed to investors (quarterly).
The VanEck Morningstar Developed Markets Dividend Leaders UCITS ETF is a large ETF with a fund volume of 644.50 million euros fund volume.
Largest 10 positions
Weight of the largest 10 positions - 36.13 % of a total of 100 positions
Verizon Communications 5.02
Pfizer Inc 4.35
TotalEnergies 4.14
BHD Group LTD 4.08%
IBM 4.08%
HSBC Holdings PLC 3.66%
Mercedes Benz Group 3.04%
BRISTOL-MYERS SQUIBB CO 2.85%
Sanofi 2.64%
Rio Tinto PLC 2.26%
$SEDY (+1,06 %) - iShares Emerging Markets Dividend UCITS ETF

Distribution yield 2024 = 7.84%
Distribution interval Quarterly
Description:
The iShares Emerging Markets Dividend UCITS ETF tracks the Dow Jones Emerging Markets Select Dividend Index. The Dow Jones Emerging Markets Select Dividend Index provides access to emerging market companies that pay dividends and can sustain a dividend payment program over an extended period of time.
The TER (total expense ratio) of the ETF is 0.65% p.a.. The iShares Emerging Markets Dividend UCITS ETF is the only ETF that tracks the Dow Jones Emerging Markets Select Dividend Index. The ETF replicates the performance of the index using a sampling process (purchase of a selection of the index components). The dividend income in the ETF is distributed to investors. distributed to investors (quarterly).
The iShares Emerging Markets Dividend UCITS ETF is a large ETF with a fund volume of 532 million euros fund volume.
Largest 10 positions
Weight of the largest 10 positions -22.43% of a total of 104 positions
REC 3.72%
Petroleo Brasileiro 2.49%
ASUSTek Computer 2.36%
Indian Oil 2.33%
COPASA 2.15%
Coal India 2.12%
T3EX Global Holdings 1.91%
Simplo Technology 1.87%
Novatek Microelectronics 1.75%
Sitronix Technology 1.73%
$IAPD (+1,35 %) - iShares Asia Pacific Dividend UCITS ETF

Distribution yield 2024 = 5.4%
Distribution interval Quarterly
Description:
The iShares Asia Pacific Dividend UCITS ETF tracks the Dow Jones Asia/Pacific Select Dividend 50 Index. The Dow Jones Asia/Pacific Select Dividend 50 Index provides access to the 50 highest dividend paying stocks from the developed economies of the Asia Pacific region.
The TER (total expense ratio) of the ETF is 0.59% p.a.. The iShares Asia Pacific Dividend UCITS ETF is the largest ETF tracking the Dow Jones Asia/Pacific Select Dividend 50 Index. The ETF replicates the performance of the index through full replication (purchase of all index components). The dividend income in the ETF is distributed to investors. distributed to investors (quarterly).
The iShares Asia Pacific Dividend UCITS ETF has a fund volume of fund volume of 375 million euros.
Largest 10 positions
Weight of the largest 10 positions - 35.38% of a total of 50 positions
Mitsui OSK Lines 5.64%
Nippon Yusen 4.83%
Magellan Financial Group 3.42%
VTech Holdings 3.37%
JB Hi-Fi 3.19%
Nick Scali 3.19%
CSR 3.17%
Viva Energy Group 2.92%
Fortescue 2.88%
Harvey Norman Holdings 2.77%
$FGEQ (+2,68 %) - Fidelity Global Quality Income UCITS ETF

Distribution yield 2024 = 2.62%
Distribution interval Quarterly
Description:
The Fidelity Global Quality Income UCITS ETF tracks the Fidelity Global Quality Income Index. The Fidelity Global Quality Income Index provides access to high-quality companies from industrialized nations that offer high dividend yields.
The TER (total expense ratio) of the ETF is 0.40% p.a.. The Fidelity Global Quality Income UCITS ETF is the only ETF that tracks the Fidelity Global Quality Income Index. The ETF replicates the performance of the index through full replication (purchase of all index components). The dividend income in the ETF is distributed to investors. distributed to investors (quarterly).
The Fidelity Global Quality Income UCITS ETF is a large ETF with a fund volume of 551 million euros fund volume.
Largest 10 positions
Weight of the largest 10 positions - 19.75% of a total of 226 positions
Microsoft 4.96%
Apple 4.27%
Nvidia 3.34%
Eli Lilly 1.24%
Broadcom 1.17%
Visa 0.99%
Comcast 0.98%
Verizon Communications 0.95
ASML Holding 0.94%
Mastercard 0.91%
$GGRP (+2,36 %) - WisdomTree Global Quality Dividend Growth UCITS ETF USD

Distribution yield 2024 = 1.43%
Distribution interval Quarterly
Description:
The WisdomTree Global Quality Dividend Growth UCITS ETF USD tracks the WisdomTree Global Developed Quality Dividend Growth Index. The WisdomTree Global Developed Quality Dividend Growth Index provides access to global equities with growth characteristics that pay a dividend. The stocks included are filtered according to ESG criteria (environmental, social and governance). The index weights the stocks according to fundamental criteria.
The TER (total expense ratio) of the ETF is 0.38% p.a.. The WisdomTree Global Quality Dividend Growth UCITS ETF USD is the cheapest ETF that tracks the WisdomTree Global Developed Quality Dividend Growth Index. The ETF replicates the performance of the index using a sampling process (purchase of a selection of the index components). The dividend income in the ETF is distributed to investors. distributed to investors (semi-annually).
The WisdomTree Global Quality Dividend Growth UCITS ETF USD has a fund volume of fund volume of 231 million euros.
Largest 10 positions
Weight of the largest 10 positions - 25.74% of a total of 590 positions
Microsoft 5.33%
Apple 3.43%
Broadcom 2.62%
Johnson & Johnson 2.54%
P & G 2.24%
Coca Cola 2.04%
LVMH Moet Hennessy 1.97%
Nestle 1.97%
Novartis 1.96%
Roche Holding 1.64%


