$CSU (+1,67 %) a technical view as a supplement to @Tenbagger2024 analysis.
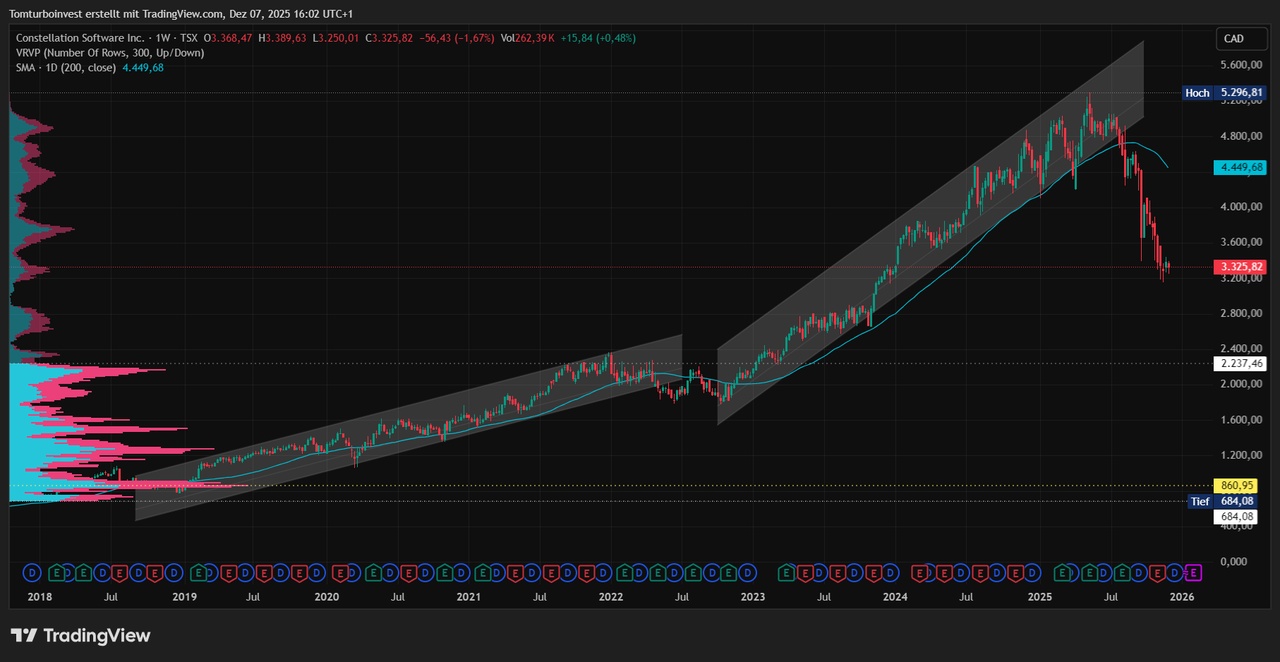
Weekly chart: $CSU (+1,67 %) was characterized by stable upward trends for long stretches. Apart from a brief interruption in 2022, the price essentially moved above the trailing SMA200. The decisive trend break occurred in July 2025. https://www.tradingview.com/x/awwZcwF5/
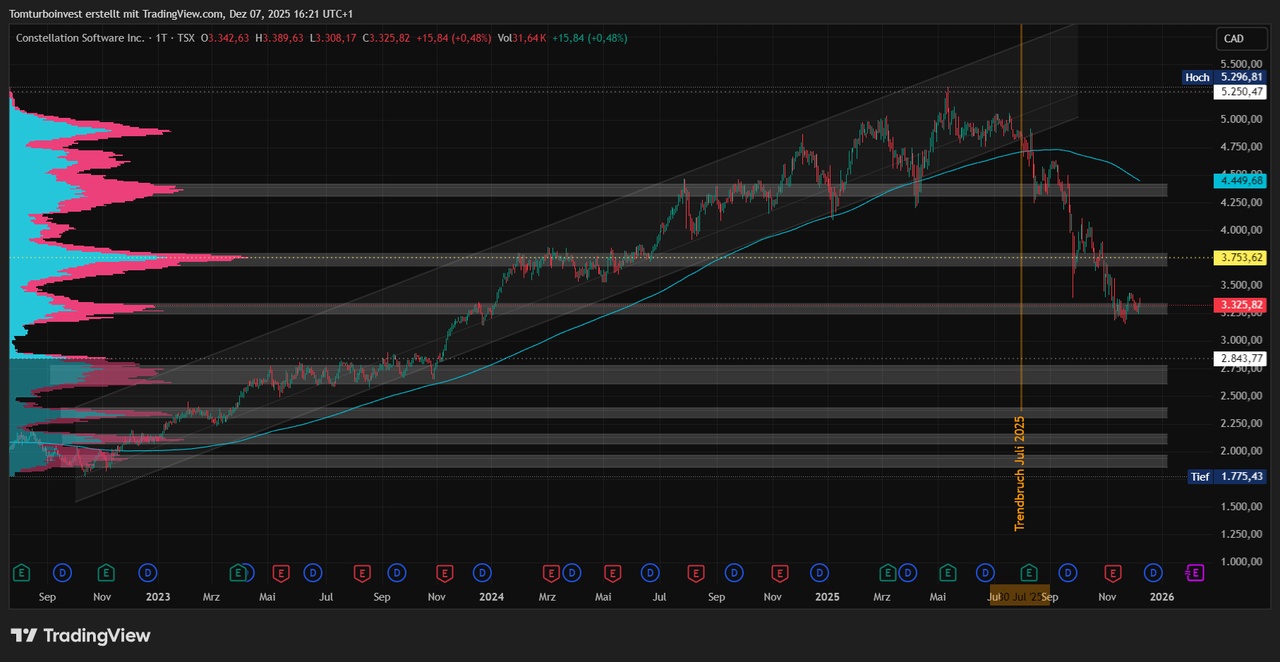
Zoom from 2022 - volume nodes: If we look at the period from 2022 onwards, the volume nodes catch the eye. These price zones with high trading volumes often have an impact:
- as supportwhen the price comes from above
- as resistancewhen the price starts from below
In the worst case of a "falling knife", the next relevant zones can be derived here https://www.tradingview.com/x/YLVEdOgL/
Valuation with anchored VWAP: For technical classification, I have applied the anchored VWAP at the trend change. This results in important marks that currently lie between the first and second divergence band. This zone is interesting for potential entries, but I remain cautious due to the overriding downtrend. https://www.tradingview.com/x/VZQjkGfV/
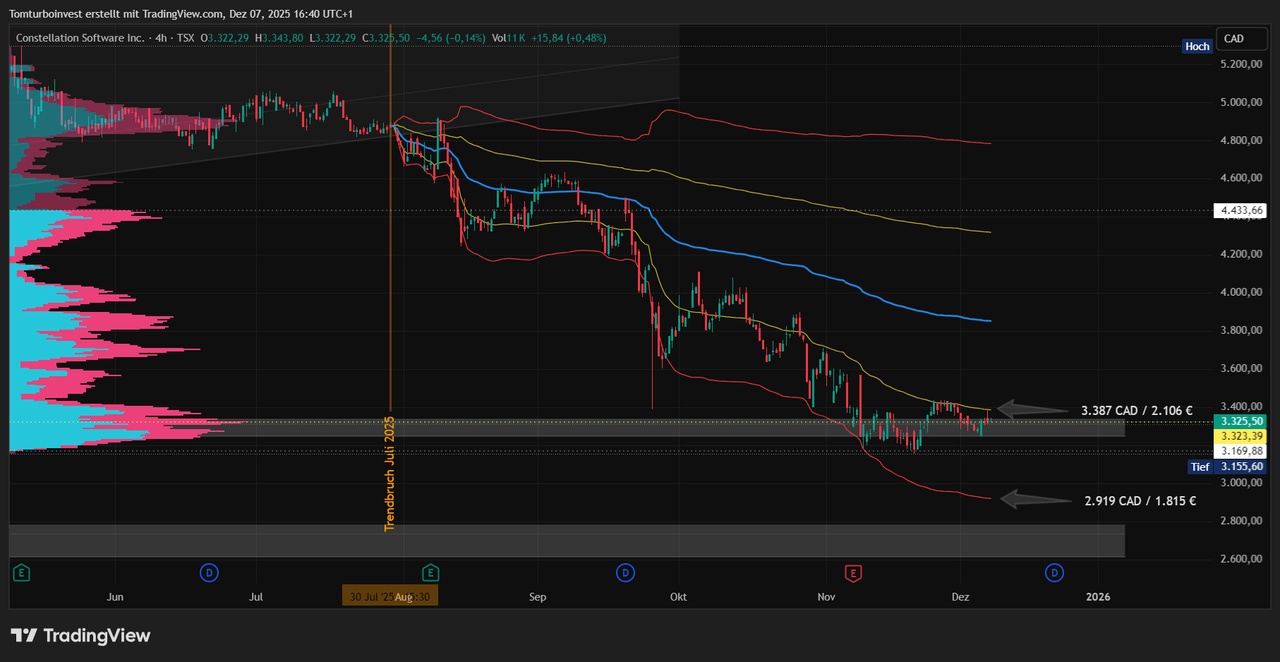
Important marks
- Bullish scenario: A breakout above 3,387 CAD (2,106 EUR) would be a positive signal in the short term.
- Bearish scenario: On the downside 2,919 CAD (1,815 EUR) should be defended, otherwise the trend is likely to continue in the direction of sins.
Conclusion:
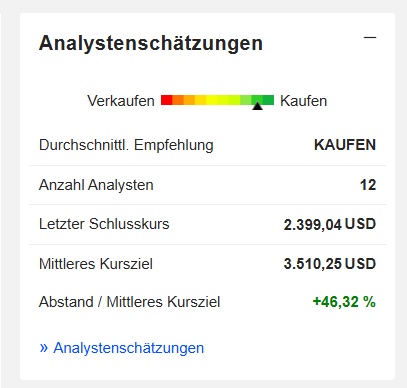
For those interested, it is worth keeping an eye on this area of approx. 300 € is worth keeping a close eye on. The analysts' estimates are positive and range from 4,500CAD to 5,600CAD.
Edit Friday 19.12.2025: 👆https://www.tradingview.com/x/SfgE2jhk/