Hello to the GQ community ✌️
My first post after being kicked about 4 weeks ago - who would have thought that solidarity towards one of the members (@Klein-Anleger ) would lead to a ban so quickly? But the goodwill of getquin was so BIG (and above all "on trial") that they graciously let me back into the holy grail of the GQ community 😉
So guys, learn from my mistakes: the goodwill here is not an Infinite Money glitch ! Save your solidarity, reduce your commitment to other members to zero and the most important thing 🚨: No surreptitious advertising for alternative financial platforms like "Cisdord" 😉😂.
Sorry, the side blow after 4 weeks of abstinence had to be 🤝
so joking aside...
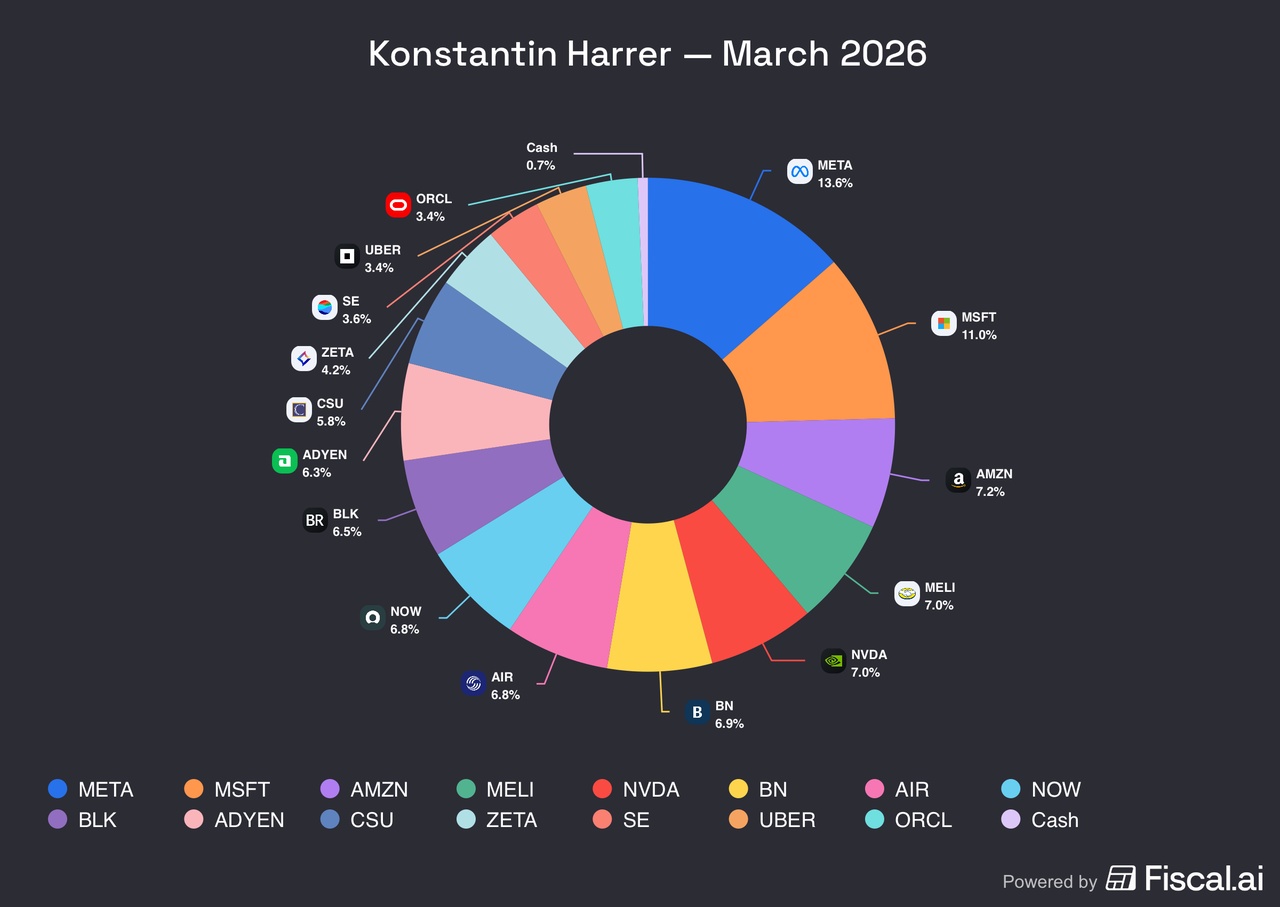
⏳The first three months of 2026 have passed. Time for a brief interim summary of the current status of my reconstruction.
Before I started rebuilding the portfolio, I naturally thought about what strategy I wanted to pursue in the coming months and years - especially with regard to stock selection and weighting.
To be honest, my original plan was to keep a portfolio with a maximum of 20 shares. In the course of time, however, I realized that it will probably not stay at 20 stocks, but that the number is more likely to increase to around 30 positions (+/-).
♟️Mein Focus & my strategy:
In a nutshell: The clear focus is on growth 🚀. Dividends tend to play a subordinate role. Here I show you my shopping list and what my portfolio should look like in the future. The stocks I have already bought are marked with a green tick and without a tick, I'm still waiting ⏳
🤖TECH:
- AMAZON $AMZN (-1,07 %) ✅
- MICROSOFT $MSFT (-0,01 %) ✅
- CROWDSTRIKE $CRWD (+0,44 %) ✅
- SYNOPSYS $SNPS (+0 %) ✅
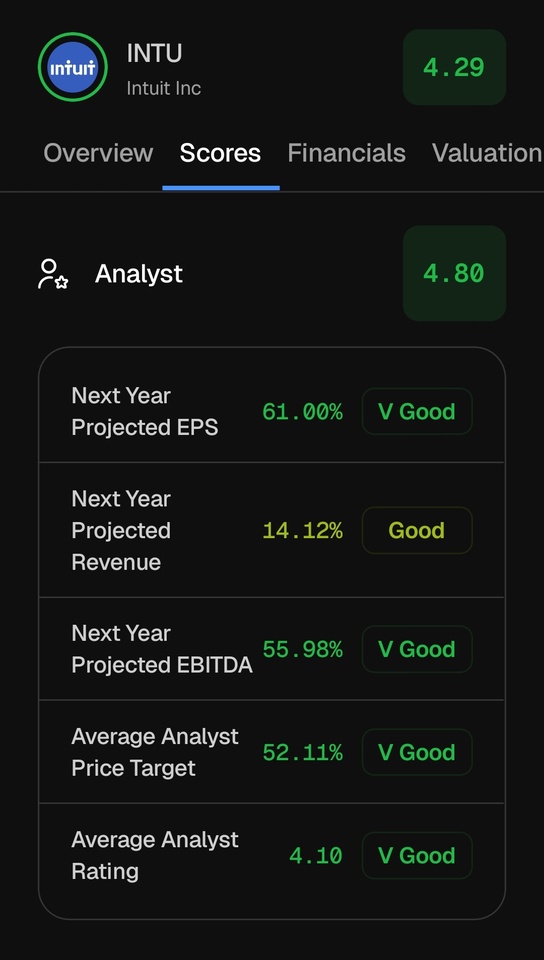
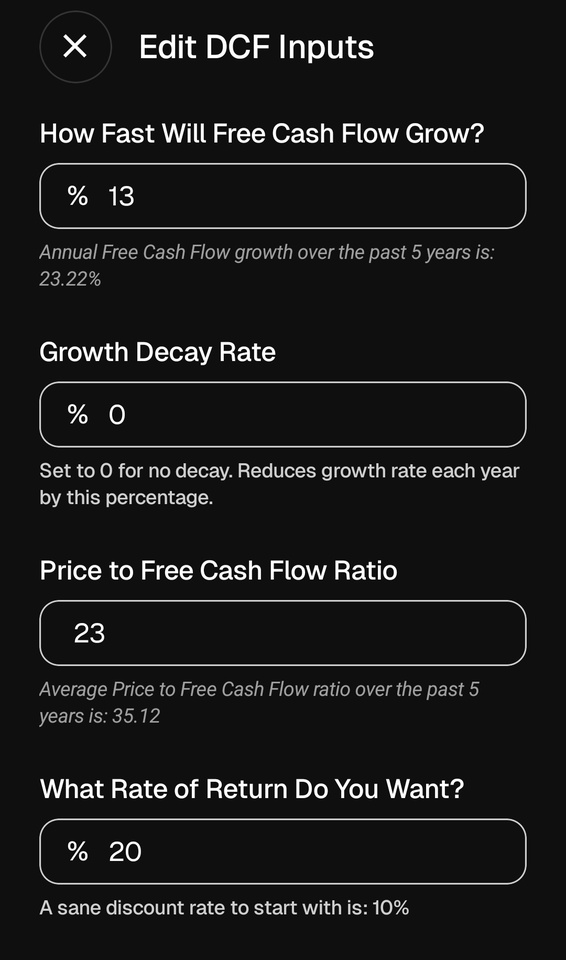
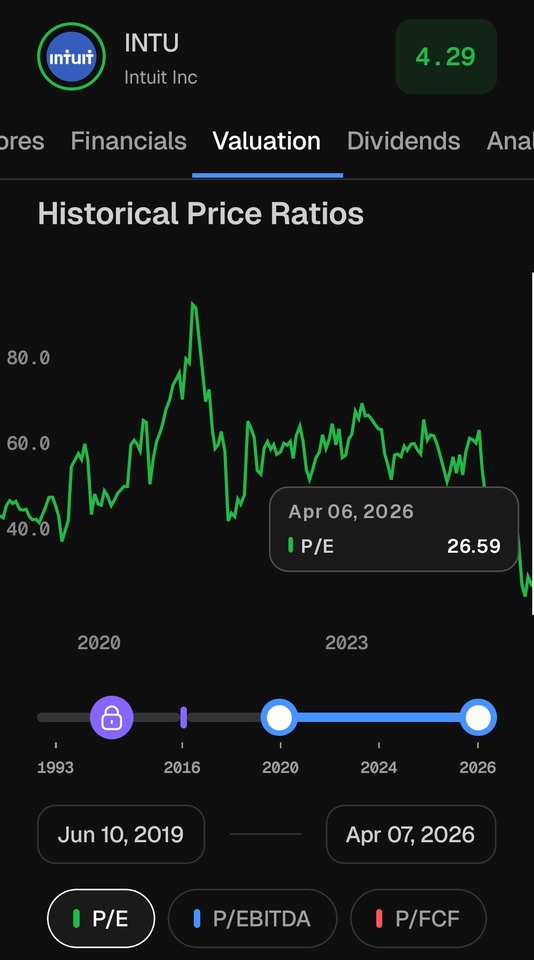
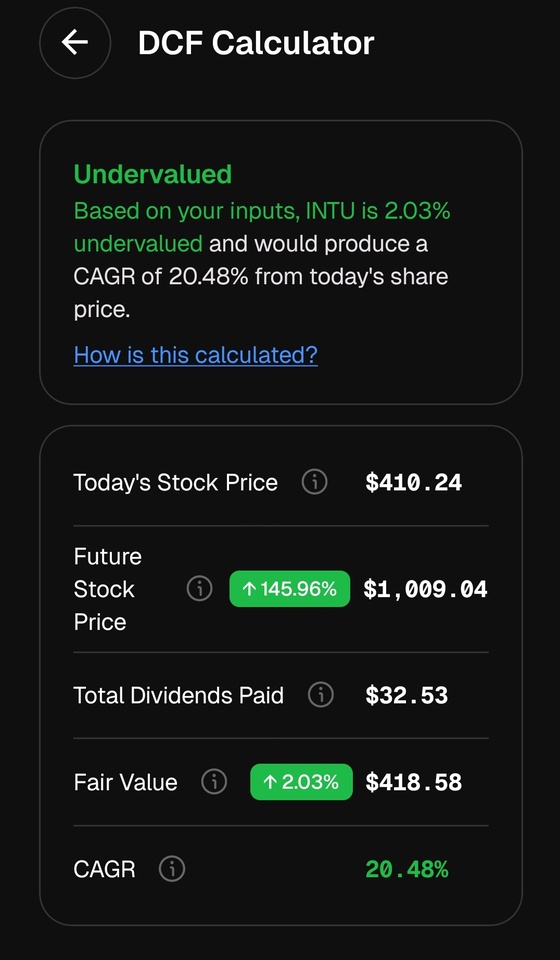
- INTUIT $INTU (+5,24 %) ✅
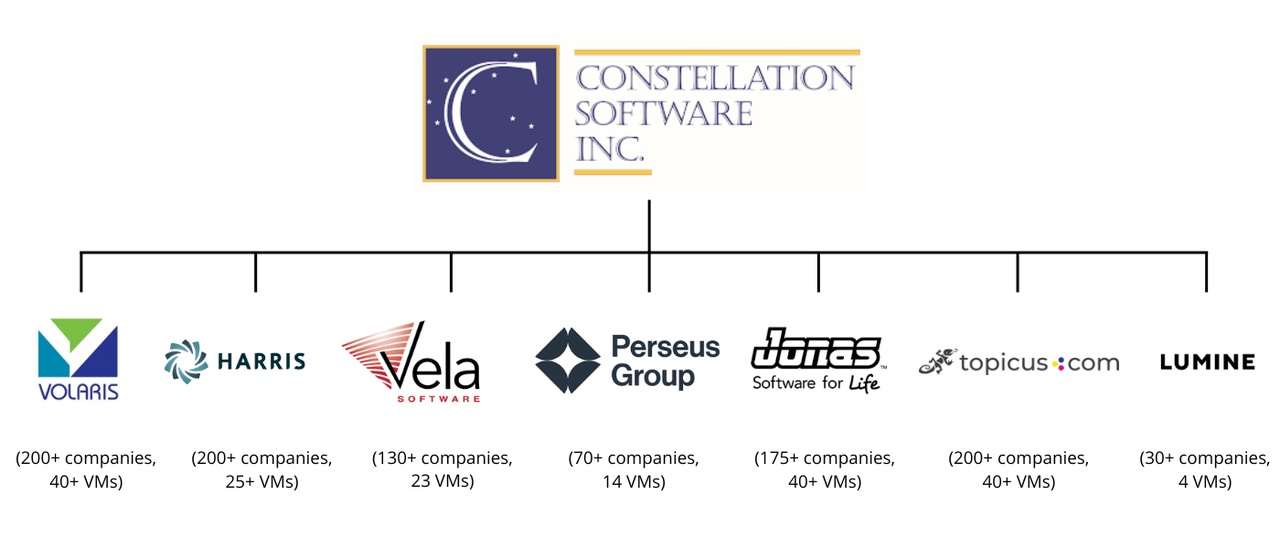
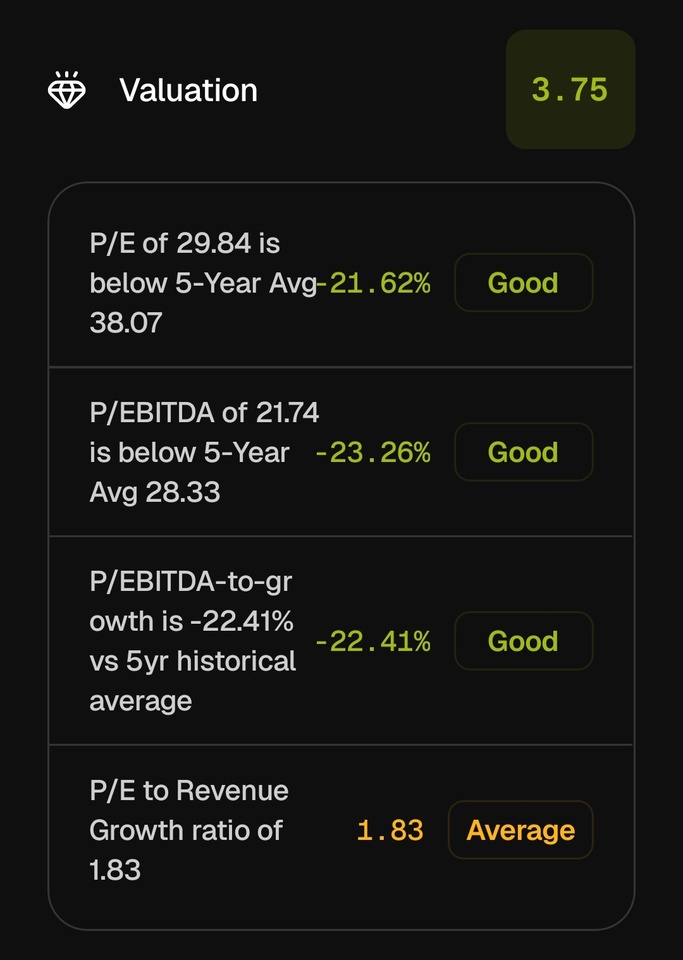
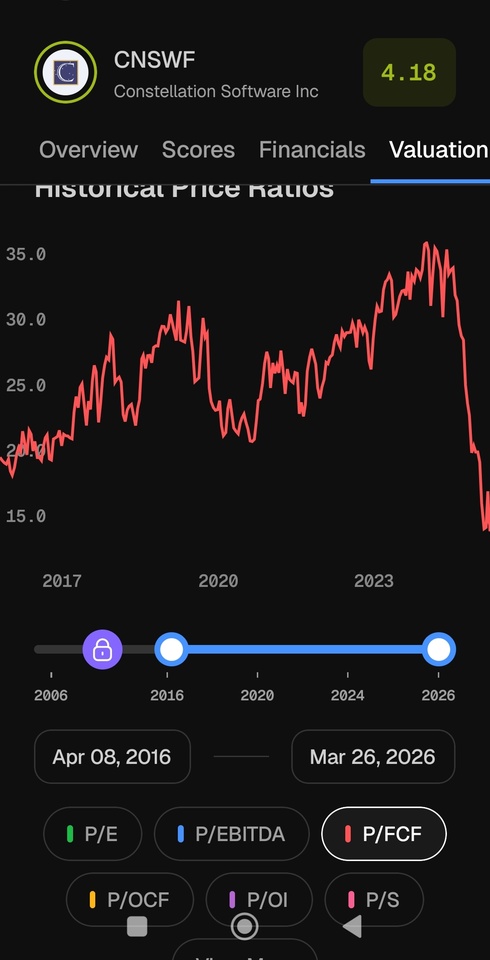
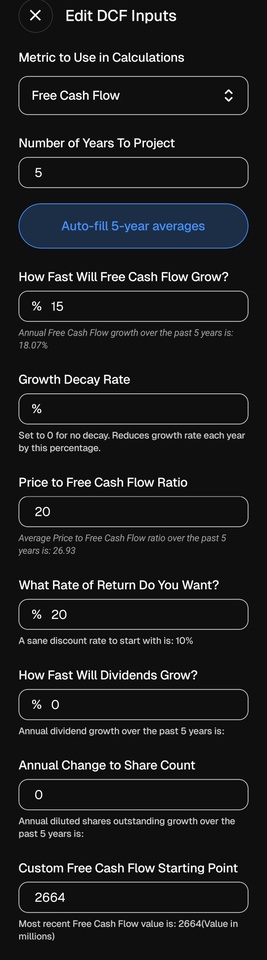
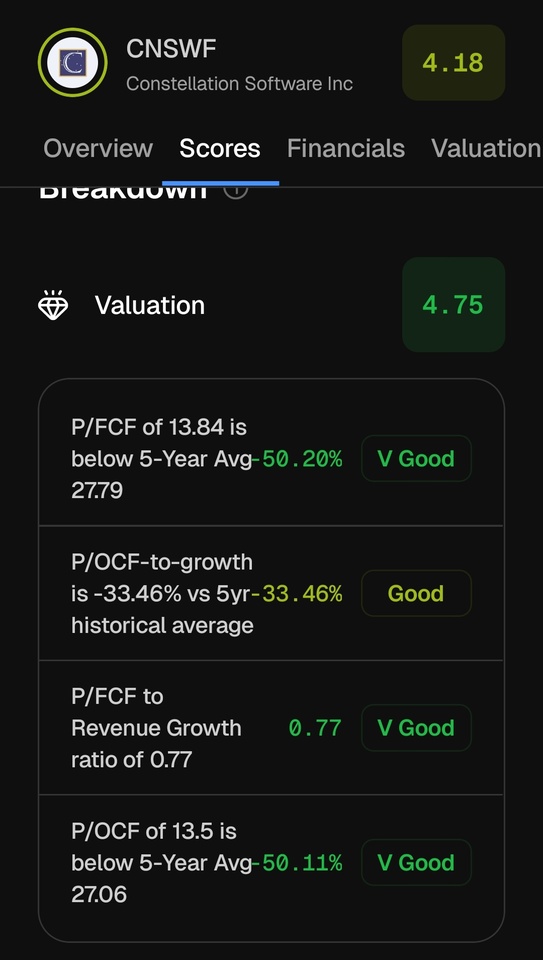
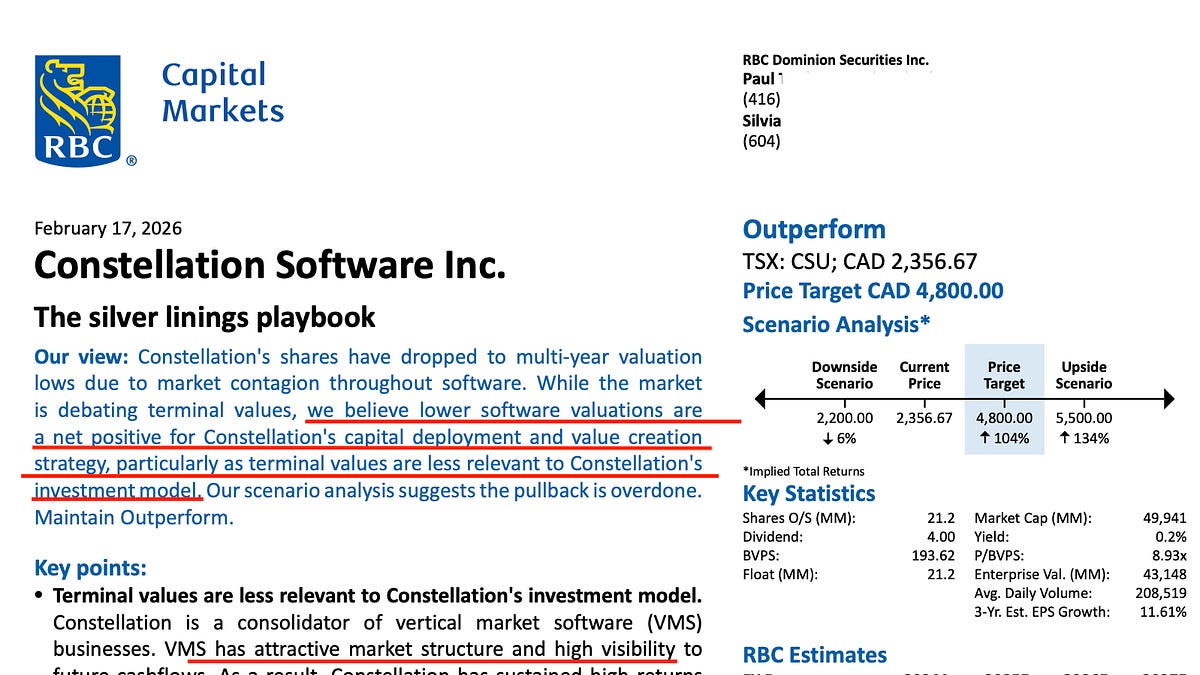
- CONSTELLATION SOFTWARE $CSU (+3,84 %) ✅
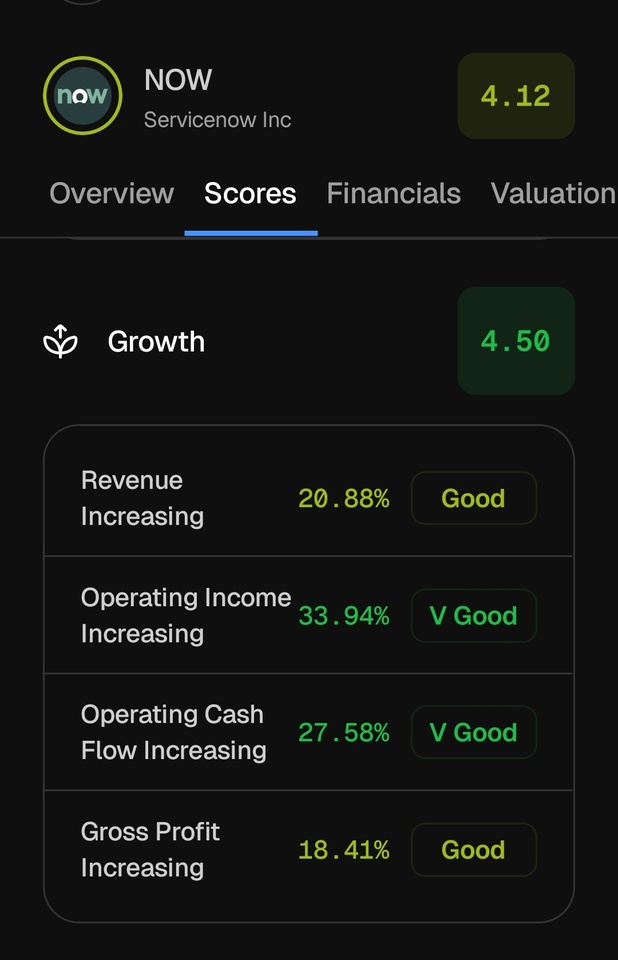
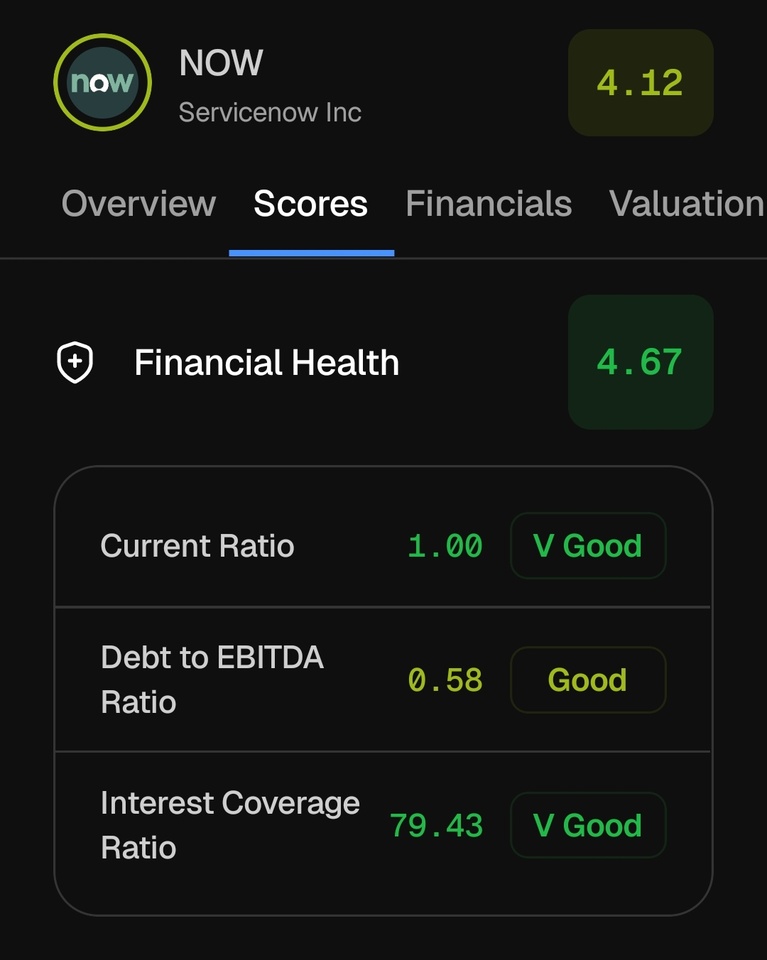
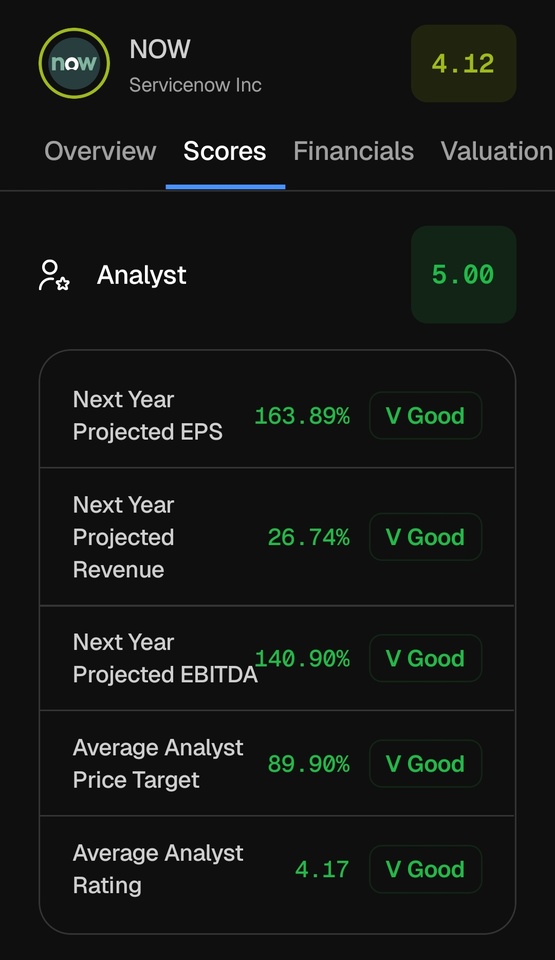
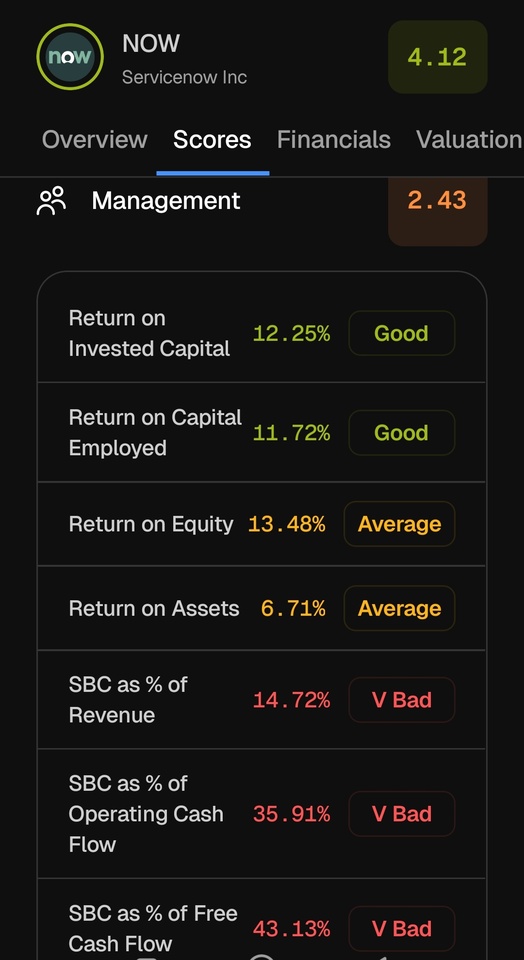
- SERVICENOW $NOW (+6,06 %) ✅
- ALPHABET $GOOGL (+0,35 %)
- NVIDIA $NVDA (-0,93 %)
- ASML $ASML (-3,54 %)
- MONOLITHIC POWER SYSTEMS $MPWR (-4,81 %)
- ARISTA NETWORKS $ANET (-2,19 %)
- KEYENCE $6861 (+1,12 %) ✅
- TSMC $TSM (-3,01 %)
- MARUWA $5344 (+0,33 %)
- LASERTEC CORP $6920 (-3,36 %)
- NETCOMPANY $NETC (+3,19 %) ✅
- CELLEBRITE DI $CLBT (+0,34 %) ✅
🏦💸FINANCE:
- SOFI TECHNOLGIES $SOFI (-1,17 %) ✅
- S&P GLOBAL $SPGI (+1,31 %) ✅
- VISA $V (+1,14 %) ✅
- MUNICH RE $MUV2 (+0,73 %) ✅
- GERMAN EXCHANGE $DB1 (+2,22 %) ✅
- PARTNERS GROUP $PGHN (+0,28 %) ✅
- BROOKFIELD CORP $BN (+0,88 %) ✅
- HOULIHAN LOKEY $HLI (+1,77 %) ✅
- BROADRIDGE $BR (+2,5 %) ✅
- CBOE GLOBAL MARKETS $CBOE (+0,24 %)
🏥🩻HEALTHCARE:
🏭🏗️INDUSTRIE & REST:
------------------------
this is my extended watchlist:
IN TECH:
RAMBUS $RMBS (-5,99 %) , QNITY ELECTRONICS $Q (-2,46 %) ,
INNODATA $INOD (-6,34 %) , NETFLIX $NFLX (+2,45 %) ,
VERTIV $VRT (-4,42 %) , PALANTIR $PLTR (+0,29 %) , VAT GROUP $VACN (-0,23 %) , BROADCOM $AVGO (-2,79 %) , AMADEUS IT $AMS (+2,73 %) , DISCO CORP $6146 (-8,31 %) , A10 NETWORKS $ATEN (-1,02 %) , RORZE $6323 , CAMTEK $CAMT (-4,5 %)
FINANCE:
APOLLO GLOBAL $APO (+2,39 %) / BLACKSTONE $BX (+4,26 %) , ALLIANZ $ALV (+0,7 %) , FIRSTCASH $FCFS (+0,69 %) , BLACKROCK $BLK (+0,79 %) SKYWARD SPECIALITY INSURANCE $SKWD , VERISK ANALYTICS $VRSK (+4,13 %) PRIMERICA $PRI (+1,48 %) , ERIE INDEMNITY $ERIE (+2,12 %)
HEALTHCARE:
MERIT MEDICAL SYSTEMS $MMSI (+1,56 %) , REGENERON PHARM $REGN (+0,68 %) , UFP TECHNOLOGIES $UFPT (+0,48 %) , COLLEGIUM PHARM $COLL (-1,28 %) , LIGAND PHARM $LGND (+0 %) , HOYA CORP $7741 (-1,05 %) , SHIONOGI $4507 (+0,64 %) , IRADIMED $IRMD (+1,22 %)
REST:
MISUMI GROUP $9962 (-2,78 %) , KANEMATSU $8020 (-0,44 %) , APPLIED INDUSTRIAL TECH $AIT (+0,93 %) , BADGER METER $BMI (+4,62 %) , CEMENT ROADSTONE HOLDING $CRH (+1,94 %) , KADANT $KAI (+1,85 %) , INTERTEK GROUP $ITRK (-0,44 %) , IDEX CORP $IEX (-0,15 %) , ORLA MINING $OLA (-0,12 %) , NEWMARKET CORP $NEU (+1,48 %) , ROTORK $ROR (+0,43 %) , POWER INTEGRATION $POWI (-10,4 %) , LINDE $LIN (+0,99 %) , GAZTRANSPORT & TECHNIGAZ $GTT (-0,3 %)
This is not yet my final stock selection/watchlist. Of course, there can always be changes if, for example, the @Tenbagger2024 continues to present such undiscovered gems 🙏🏽🧐
------------------------
What should the sector/country weighting look like?
Let's start with the "desired"
🌍country weighting:
🇺🇸🇨🇦USA ~60%
🇪🇺EUROPA ~20%
🇯🇵JAPAN/ASIA ~15%
Rest ~5%
Sector weighting should be as follows:
💻TECHNOLOGY: ~30-35%
💸FINANCE: ~ 20-25%
HEALTHCARE: ~ 10-15%
🏭INDUSTRY: ~ 10-15%
REST: ~ 5-10%
So, what has happened since the beginning of the year?
Of course there were no sales 😬
There have been a few purchases where I have a finger in the pie.
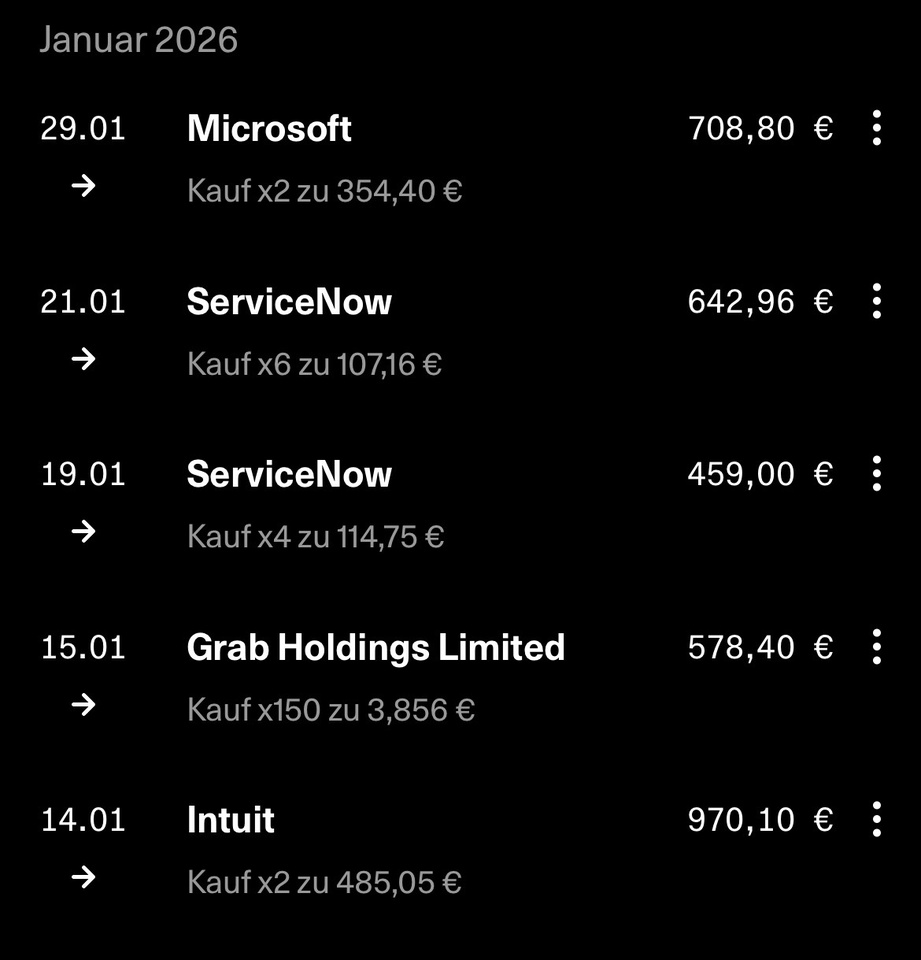
JANUARY PURCHASES
$INTU (+5,24 %)
$GRAB (+0,43 %)
$NOW (+6,06 %)
$MSFT (-0,01 %)
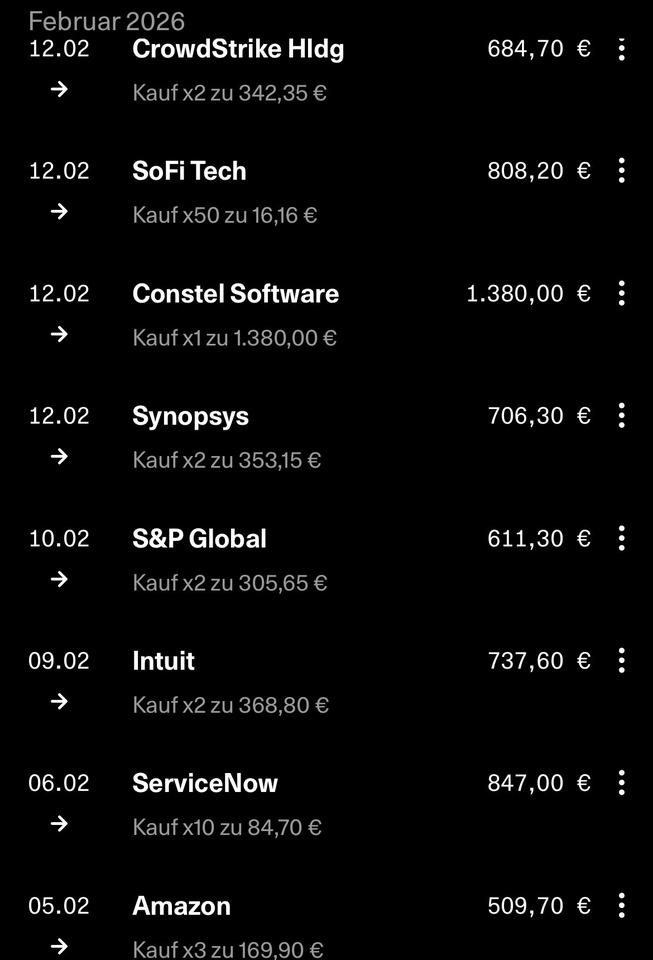
FEBRUARY PURCHASES
$NOW (+6,06 %)
$INTU (+5,24 %)
$SPGI (+1,31 %)
$SNPS (+0 %)
$CSU (+3,84 %)
$SOFI (-1,17 %)
$CRWD (+0,44 %)
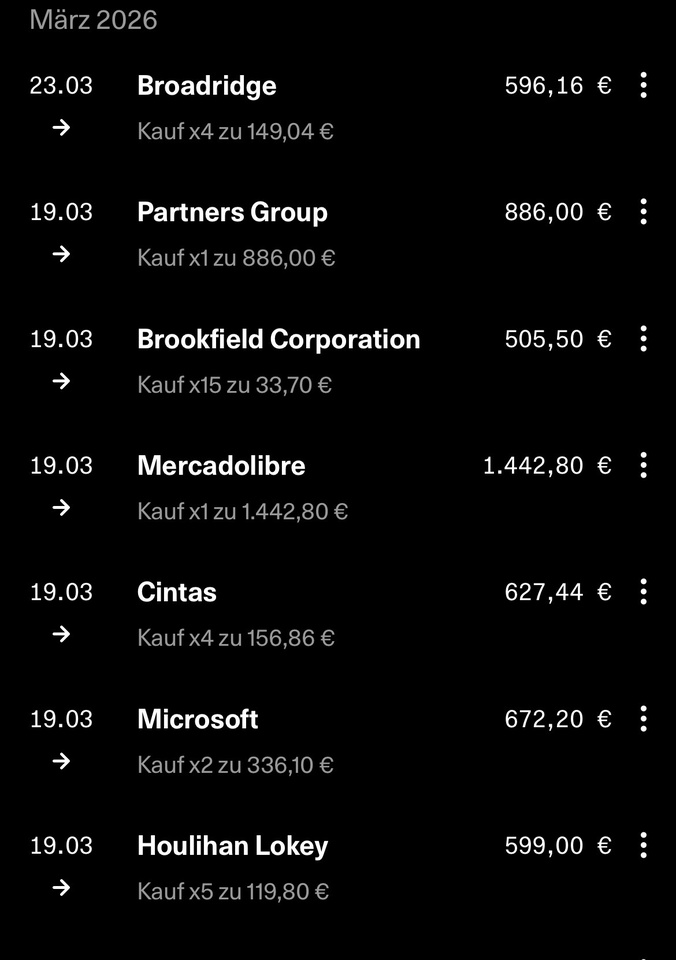
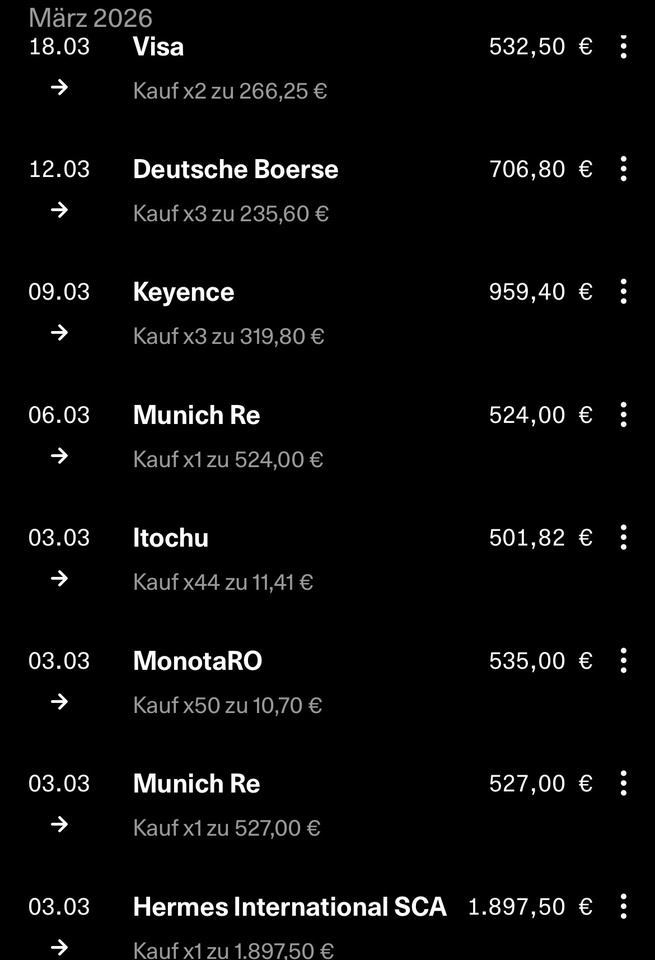
MARCH PURCHASES
$MUV2 (+0,73 %)
$3064
$8001 (-0,9 %)
$6861 (+1,12 %)
$DB1 (+2,22 %)
$V (+1,14 %)
$HLI (+1,77 %)
$MSFT (-0,01 %)
$CTAS (+2,51 %)
$MELI (+0,1 %)
$BN (+0,88 %)
$PGHN (+0,28 %)
$BR (+2,5 %)
Due to the global political situation - especially because of this 🍊 in the White House, whose tweets cause more tsunamis 🌊than real natural disasters - and the current drawdown in the S&P 500 (which is very convenient for me right now and gives me a lot of pleasure 🤩), I am accordingly under water💦🫧 with some of my purchases so far.
but hey, we're investing for the long term, aren't we? So easy going, all relaxed 🥱 I will most likely not make any more purchases in the next few days or weeks, park my cash position elsewhere or put it in overnight money and wait and see which zone the market settles in or wait for it to stabilize.
What do you have on your watchlist?
Are you currently waiting or how are you dealing with the current situation?
@Get_Rich_or_Die_Tryin
@Tenbagger2024
@Max095 and of course all other members
Ok, that's enough now 😂
that's it from me for now ✌️
your stock master