Part 5 - Size... does matter?! (Small/mid-Cap & Growth ETF)
The series continues Friends,
Reading time: 8-10 minutes
Disclaimer: No investment advice or recommendation, this article is for information purposes only. Before you decide on an ETF, take a closer look at it in terms of positions, sampling, regions, etc. I can't describe everything here as it would go beyond the scope of this article
Part 1 (Definition, Categories & Z-Score and Quality Factor): https://getqu.in/RCSY4a/
Part 2 (Value ETF): https://getqu.in/Nfnhqb/
Part 3 (Low Volatility ETF): https://getqu.in/Ub7KpG/
Part 4 (Momentum ETF): https://getqu.in/CNMgGw/
What are Growth and Small Cap ETF?
Growth ETFs place a special focus on the growth of the company. This growth is usually represented by an increase in earnings per share, price/earnings ratio and sales per share over time. Growth ETFs generally take into account both past and expected future values. In other words, unlike the value premium, the focus is not on stocks that are as undervalued as possible, but on those that are showing strong increases in their profits or sales.
Small cap shares are defined by their market capitalization. This is determined by multiplying the number of shares in a company by the share price. Depending on the resulting value, the shares are classified as small, mid or large cap. These limits change from time to time (even the best-known small-cap index, the Russel 2000, sometimes contains stocks with a market capitalization of around USD 10 billion), but the following general rule still applies:
- Small cap: < USD 2 billion
- Mid Cap: 2- 10 billion USD
- Large Cap: > 10 billion USD
- Mega Cap: > 200 billion USD
Relative classifications are also frequently used due to the rapidly aging boundaries. The Vanguard Mega Cap ETF, for example, is based on the CRSP US Mega Cap Index, which is based on the top 70% of companies with the highest market capitalization in the USA. Growth and small-cap ETFs often have a similar stock selection, as it is easier for smaller companies to show strong growth. For example, if Amazon wants to achieve 10% growth in sales per year, it would have to grow by around USD 60 billion each year (double SAP's total annual sales).
Why invest in small-cap or growth?
I'm going to take the liberty of making an excursion into portfolio theory here, a bit of a number crunching, but it's worth it for the sake of understanding.
The original capital asset pricing model (CAPM) was developed in the 1960s and serves, among other things, to reflect a risk-adjusted expected return on the portfolio.
The expected portfolio return is calculated as follows: Rp = Rf + Beta x (Rm ./. Rf)
Where: Rp = return on portfolio/security, Rf (risk-free interest rate), beta (beta factor of the portfolio/security) and Rm = expected market return
Beta simplified (portfolio volatility divided by overall market volatility), or can be found on equity analysis websites (yahoofinance,..)
Risk-free interest rate = usually government bonds (e.g. 10-year federal bond) or can be obtained from auditors (https://www.dhpg.de/de/newsroom/blog/basiszinssatz)
Example:
Expected return of MunichRe
Beta 5j = 0.85 (less volatile than the overall market)
Risk-free interest rate = 2.5
Expected market return = 7%
Rp = 2.5 % + 0.85x(7%-2.5%)
Rp = 6.33 %
MunichRe's expected return is therefore - as it is less volatile - 6.33% p.a.
In fact, MunichRe's past return over the last 5 years was approx. 13.5% p.a.
This represents a risk-adjusted outperformance (alpha) of almost 7%.
... or to put it another way, the CAPM is perhaps not really suitable for deriving a return expectation here, as only one single factor is included as a risk premium: beta.
The deviation of the market return is established in the CAPM only via the beta and thus via the volatility as the only risk criterion, the so-called > systemic risk <. Dies ist bewusst der Fall, da die – durch Studien gestützte – Annahme getroffen wurde, dass > unsystemic risks < would be diversified away in portfolios, so that only the systemic risk would remain in the overall context. However, the CAPM was often not suitable for explaining market movements, which is why it was developed further.
The Fama-French model / birth of smart beta investing
Eugene Fama and Kenneth French - two names that send a shiver down the spine of every business economist - also recognized the insufficient validity of the CAPM model in explaining returns and extended the model by 2 factors, which made it possible to explain significantly more price movements (90% of the previous 70%). The extension was based on 2 observations:
- Size-Premium: smaller companies tend to achieve higher returns than large companies
- Value premium: companies with a low price-to-book/earnings ratio tend to generate higher returns than companies with a high kbv/kgv.
The CAPM has thus been extended: Rp = Rf + Beta x (Rm ./. Rf) + smb +hml
Smb = small minus big (market capitalization / size premium)
Hml = high minus low (kbv/kgv / value premium)
In addition to the volatility premium, size and value premiums are also integrated in the model. In the MunichRe example, for example, a value premium would have brought the expected return closer to the actual realized return.
There are always discussions as to whether there are other - significant - premiums such as a liquidity premium, e.g. for private equity, with which a higher return is to be priced in as the money is not available.
Working out these "premiums" is the basis of many smart beta investing approaches (quality, dividend & value = value premium, growth and small-cap = size premium, low volatility = volatility/risk premium).
Why should we now invest in small-cap and growth?
Because there is a size premium - historically observed & proven by studies - that allows us to potentially outperform the market. Since growth often goes hand in hand with size, this also applies here, even if a purely growth-based approach has historically not been able to achieve any consistent excess returns, but has repeatedly done so in certain market phases.
Historical size premium
There are various studies on the size premium by the major investment houses:
- VanEck, for example, has highlighted a long-term outperformance of small-caps compared to the world index or even compared to emerging markets. Interesting paper here: https://www.vaneck.com.au/globalassets/home.au/home/vaneck_whitepaper_global-smallcaps_fv3.pdf
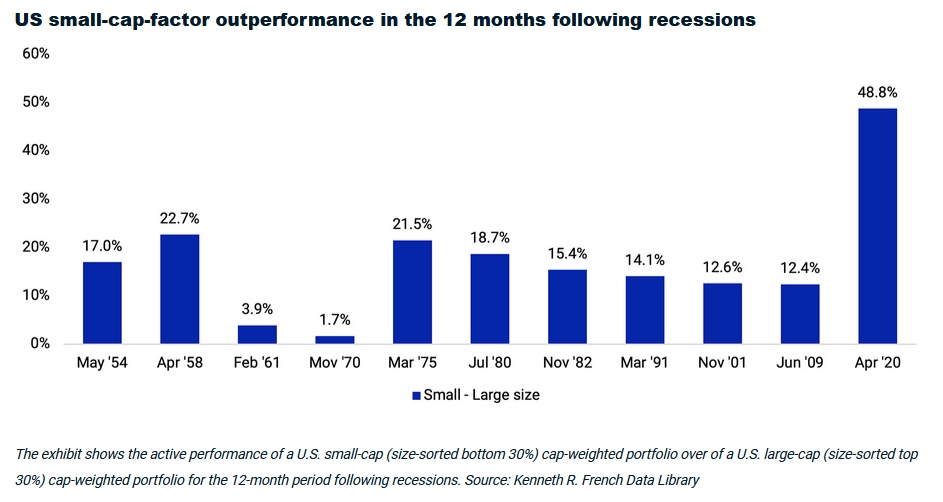
- MSCI also confirms this with an observed outperformance of the MSCI World Small Cap Index of 2.69% p.a. compared to the MSCI World Index since 1998. They also see an outperformance especially after reviews. Over an investment period of 15 years, small caps have outperformed large caps in around 9 out of 10 cases, as measured by the respective MSCI indices. (https://www.msci.com/www/blog-posts/small-caps-have-been-a-big/03951176075):
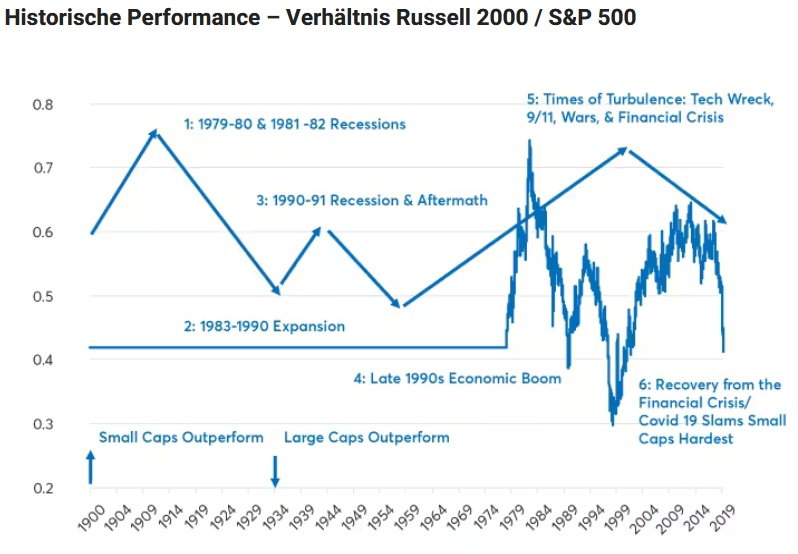
- A very long study since 1900 shows that the size premium often comes in waves. The following chart for the US market shows an outperformance of the size premium with an upward arrow, underperformance with a downward arrow (https://www.finanztrends.de/russell-2000-vergleich-mit-dem-sp-500-fuer-sie-zusammengefasst/):
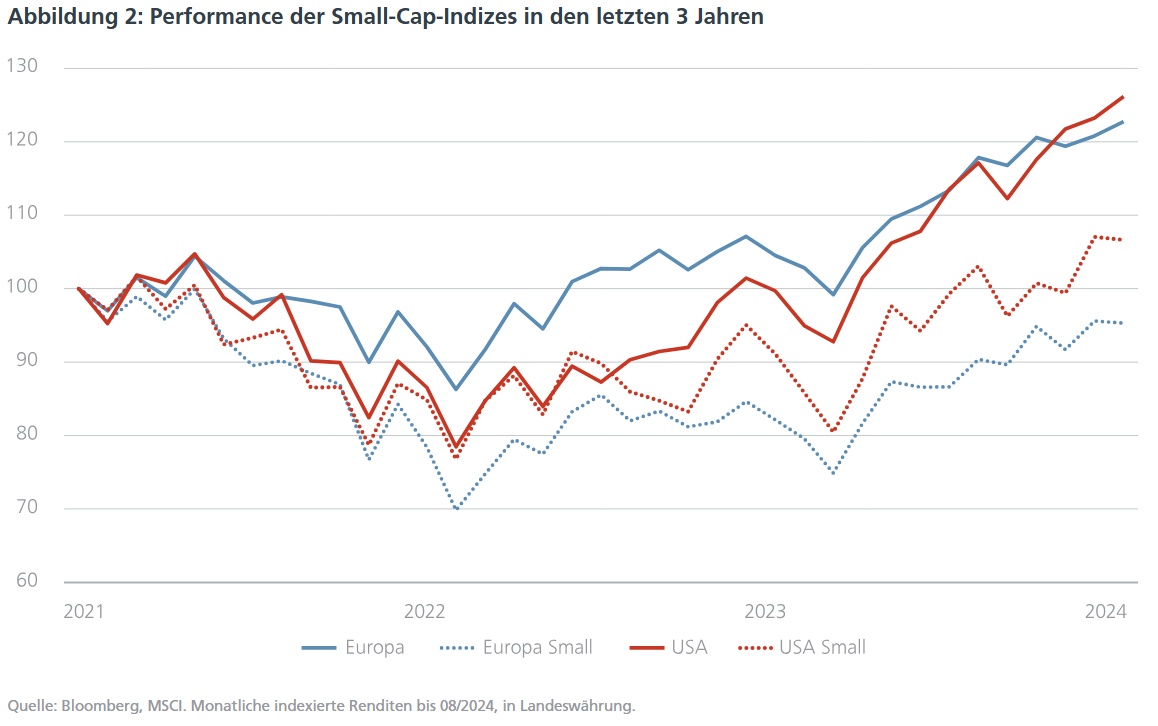
Recent performance of the size premium:
As can be seen in the last chart, the size premium has underperformed larger companies in the recent past. As we all know, the current high valuations are primarily driven by the large tech companies. These are the Magnificient 7 for the US market/world, 1/3 of the DAX performance this year has been driven only by SAP. (https://www.quoniam.com/artikel/comeback-small-caps/)
There are many reasons for the underperformance: Interest rate policy, short interest of smaller companies, market power of the big players, quality factor, etc.
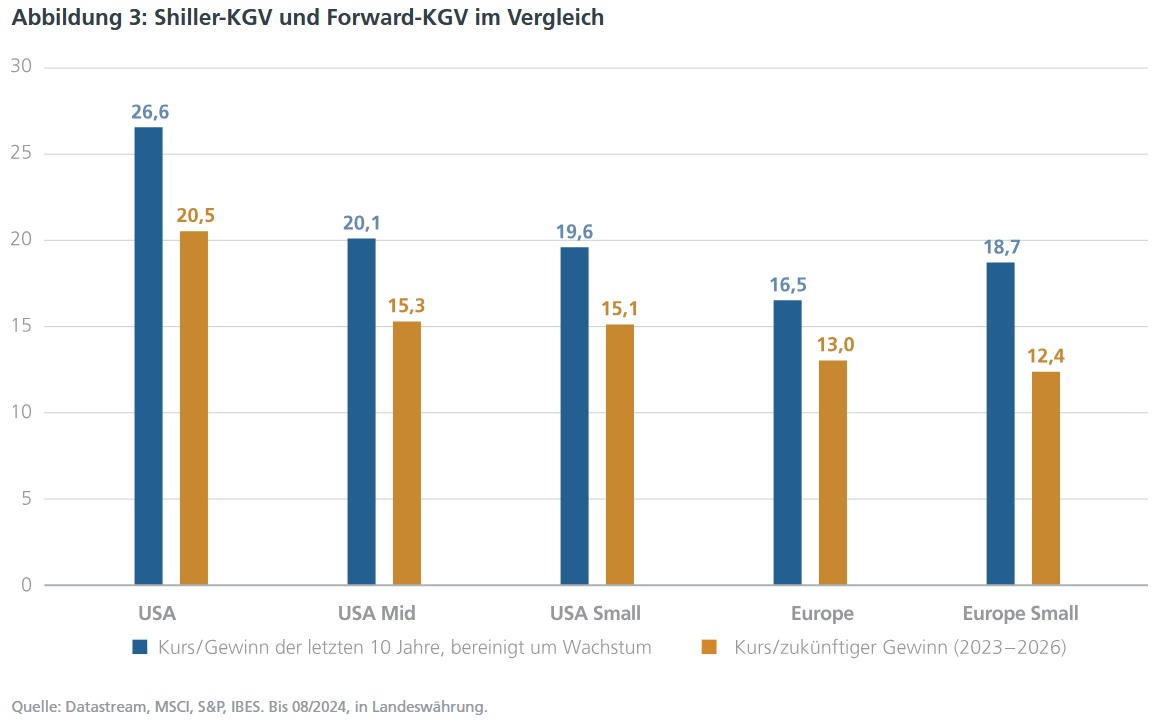
Small caps are currently trading on historically favorable price/earnings ratios (https://www.quoniam.com/artikel/comeback-small-caps/, https://e-fundresearch.com/newscenter/193-dpam/artikel/52817-bewertungsdifferenz-zu-large-caps-chance-auf-doppeltes-alpha-bei-europas-small-caps, https://www.dasinvestment.com/usa-aktien-entwicklung-large-mid-small-caps/)
Conclusion:
Historically, small-caps have outperformed (partly due to increased growth prospects). In recent years (since the 2000s), however, they have underperformed, resulting in historically favorable valuations. If one believes in the validity of the size premium, there are favorable entry opportunities here.
Which ETFs are available?
There are significantly fewer ETFs for growth and the investment volumes here are still very low (around 1 billion total volume). For small caps, the selection is significantly larger and the investment volume in the ETFs is more than 10 times as high.
👉Size-ETFs:
- $WSML (+0,3 %) (World | TER 0.35 % | Tracking Difference 0.06 % | EUR 5 bn invested volume | 3Y underperformance vs. MSCI World - 20 %pt | 5Y underperformance vs. MSCI World - 37 %pt)
o Index methodology: 15% of the lowest market cap
- $ZPRR (US | TER 0.30 % | TD -0.12% | EUR 5 bn invested | 3Y underperformance vs. S&P 500 -28 % | 5Y underperformance -58 %pt | 10Y underperformance - 180 %pt)
o Index methodology: 2000 smallest listed US companies
- $XXSC (+0,66 %) (Europe | 0.30 % | TD n.a. | EUR 2 bn inv. vol. | 3Y underperformance vs. Eurostoxx 600 -22 %pt | 5Y underperformance - 21 %pt | 10Y outperformance + 14 %pt)
o Index methodology: 15% of the lowest market cap in Europe
👉Growth-ETFs:
- $IE0005E8B9S4 (+0,2 %) (US | TER 0.19 % | TD n.a. | EUR 0.8 bn invested vol. | 3Y outperformance vs. S&P 500 + 12%pt | 5Y outperformance + 54%pt | 10Y underperformance - 50%pt)
o Index Methodology: First, the 1000 largest US companies by market capitalization are selected from the Russell 3000 Index to form the Russell 1000 Index. They are then weighted according to growth criteria:
(1) Price-to-book ratio (P/B): Companies with lower P/B ratios are favored.
(2) Medium-term earnings growth forecast: Based forecasts for 2-year earnings growth. Higher growth forecasts lead to a higher probability of inclusion.
(3) Sales growth per shareCalculated on the basis of historical 5-year sales growth. Stronger sales growth increases the chances of inclusion in the index.
- $IQQG (+0,69 %) (Europe | TER 0.40 % | TD -0.09% | EUR 0.3 bn invested volume | 3Y underperformance vs. Eurostoxx 600 -4%pt |5Y outperformance +8%pt |10Y outperformance +20%pt)
o Index methodology: Index is based on the STOXX Europe Total Market Index (TMI). Stocks are analyzed based on six factors to determine their growth characteristics: (1) Forecast P/E ratio, (2) Trailing P/E ratio, (3) Price-to-book ratio, (4) Forecast earnings growth, (5) Historical earnings growth, (6) Dividend yield. Based on these values, a growth score is determined for each share and the 40 best are included in the index. The weighting is also based on the growth score (maximum 15%).
- $EL4C (+0,73 %) (Europe | TER 0.65 % | TD n.A. | EUR 0.2 bn invested vol. | 3Y underperformance vs. Eurostoxx 600 -44 % | 5Y underperformance - 30 % | 10Y outperformance +8%)
o Index MethodologySimilar to $IQQG, except that only 20 companies are selected and each of these is included in the index in roughly equal proportions (5% each).
Conclusion:
What remains?
From a historical perspective, there is a size premium that is derived from the greater growth potential of smaller companies, among other things. However, this size premium has tended to develop in waves and there is currently an underperformance compared to large companies. So for those who believe that smaller companies can continue to outperform with a size premium in the future, there are favorable entry opportunities. There is a wide selection of small-cap ETFs for World, US, Europe, but also other countries that I have not shown here (e.g. UK & Japan), there is also a small-cap ETF for emerging markets, but I personally would not invest here, as in addition to the size risk, an additional country/political risk would be too much of a good thing for me.
If you want more growth as a pure play (and therefore not implicitly in the size premium), you can take a look at the growth ETF. I find the $IE0005E8B9S4 particularly exciting, as it also focuses on large companies with strong growth.
Let me know what your thoughts are? Do you take the size/growth effect into account, and if so, how do you reflect this in your portfolio?
#smartbeta
#etf
#sizepremium
#capm
#portfolio
#smallcaps
#growth