$INSW (-1,62 %) Believe in your (wet) dreams ! 🚢⚓🤑
INS
Intl Seaways
Stock
Stock
ISIN: MHY410531021
Ticker: INSW
MHY410531021
INSW
Price
Debate sobre INSW
Puestos
272Lun·
First 100%
2Lun·
INSW Q1 2026 Flash Earnings
International Seaways ( $INSW (-1,62 %) )
Net income : $286M ($5.75/sh) vs $128M ($2.56/sh) Q4 2025🟢
Adjusted Net Income : $194M ($3.90/sh) vs $122M ($2.45/sh) Q4 2025 🟢
Adj. EBITDA : $244M vs $174.8M Q4 2025 🟢
Dividend declared : $4.55 per share (payable June 2026) 🤑
📢$918M available liquidity
55
2Lun·
INSW Q1 2026 Flash Earnings
International Seaways ( $INSW (-1,62 %) )
Net income : $286M ($5.75/sh) vs $128M ($2.56/sh) Q4 2025🟢
Adjusted Net Income : $194M ($3.90/sh) vs $122M ($2.45/sh) Q4 2025 🟢
Adj. EBITDA : $244M vs $174.8M Q4 2025 🟢
Dividend declared : $4.55 per share (payable June 2026) 🤑
📢$918M available liquidity
22
4Lun·
INSW Q4 2025 Flash Earnings
International Seaways ( $INSW (-1,62 %) )
Net income : $128M ($2.56/sh) vs $71M ($1.42/sh) Q3 2025🟢
Adjusted Net Income : $122M ($2.45/sh) vs $57M ($1.15/sh) Q3 2025 🟢
TCE Revenue : $260M vs $192M Q3 2025 🟢
Adj. EBITDA : $174.8M vs $108M Q3 2025 🟢
Dividend declared : $2.15 per share (payable March 2026) 🤑
Dividend coverage : 75% Adjusted Net Income Allocation Policy unchanged, Payout ratio 87% Q4 net income
💪🏼Spot Cash Break Even Rate below $15,000 per day
📢 Share buyback program of $50M extended up to end of 2026
📢$724M available liquidity
11
8Lun·
INSW Q3 2025 Flash Earnings
International Seaways ( $INSW (-1,62 %) )
Net income : $71M ($1.42/sh) vs $62M ($1.23/sh) Q2 2025🟢
Adjusted Net Income : $57M ($1.15/sh) vs $50M ($1.00/sh) Q2 2025 🟢
TCE Revenue : $192M vs $189M Q2 2025 🟢
Adj. EBITDA : $108M vs $102M Q2 2025 🟢
Dividend declared : $0.86 per share (payable Dec 2025) 🤑
Dividend coverage : 75% Adjusted Net Income Allocation Policy unchanged
💪🏼Spot Cash Break Even Rate below $15,000 per day
📢 Share buyback program of $50M extended up to end of 2026
📢$985M available cash + revolver for growth/buybacks

22
1Año·
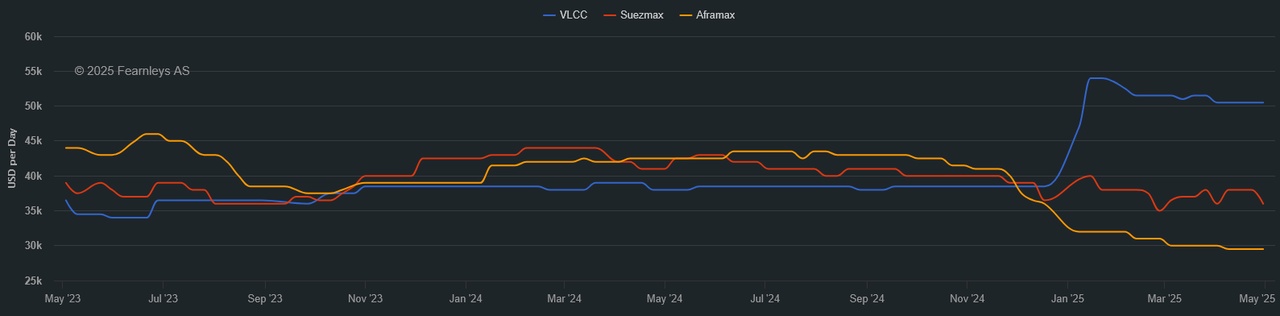
🌊 Tanker Market Update Week 20 2025 : VLCC Awaits OPEC+ Surge, Suezmax Shifts, and Clean Markets Soar
Mid-May 2025 sees the tanker market riding dynamic waves. Very Large Crude Carriers (VLCCs) soften but eye an OPEC+ rally, Suezmax vessels pivot to long-haul Black Sea exports, Aframax faces softening rates, and Clean markets surge with LR2/LR1 gains. U.S.-China tariff relief, Iranian sanctions, and South Korean crude imports shape the horizon, while CPC pipeline shifts and Red Sea dynamics add intrigue. This sector is a tanker navigating global currents—let’s chart its course.
⏬ VLCC Market: Softening with OPEC+ Hopes
Rate Declines
VLCCs, the giants of crude transport, soften but hold steady for a potential rebound. The Baltic Exchange’s TD3C (270,000 mt Middle East Gulf-to-China) climbs 5 points to WS64.35, yielding a round-trip time-charter equivalent (TCE) of $45,668 per day. West Africa-to-China (TD15) rises 2 points to WS63.19 ($44,743 per day), but U.S. Gulf-to-China (TD22) drops $352,500 to $8.197 million ($43,043 per day). Clarksons’ fleet-weighted average falls 17.5% week-on-week to $45,600 per day, down from $53,900. Middle East Gulf (MEG) rates hover at WS60, with Petrobras’ Brazil export cargo fixed at WS61 after three replacements—VLCCs brace for June cargoes.
Cargo Dynamics
MEG sees an influx of end-May cargoes, with June laycans drawing charterer interest in the first decade, signaling nervousness. China’s crude imports (11 million bpd in April) and South Korea’s record 20 million barrels of U.S. crude in May drive VLCC demand. OPEC+’s production hike (411,000 bpd in May-June) adds four to five VLCCs, per Clarksons, with full impact expected by Q3. U.S. sanctions blacklist a 305,700-dwt VLCC for Iranian oil, risking disruptions. A balanced MEG position list and tightening tonnage control buoy sentiment—VLCCs anticipate an OPEC+-fueled uptick.
Global Forces
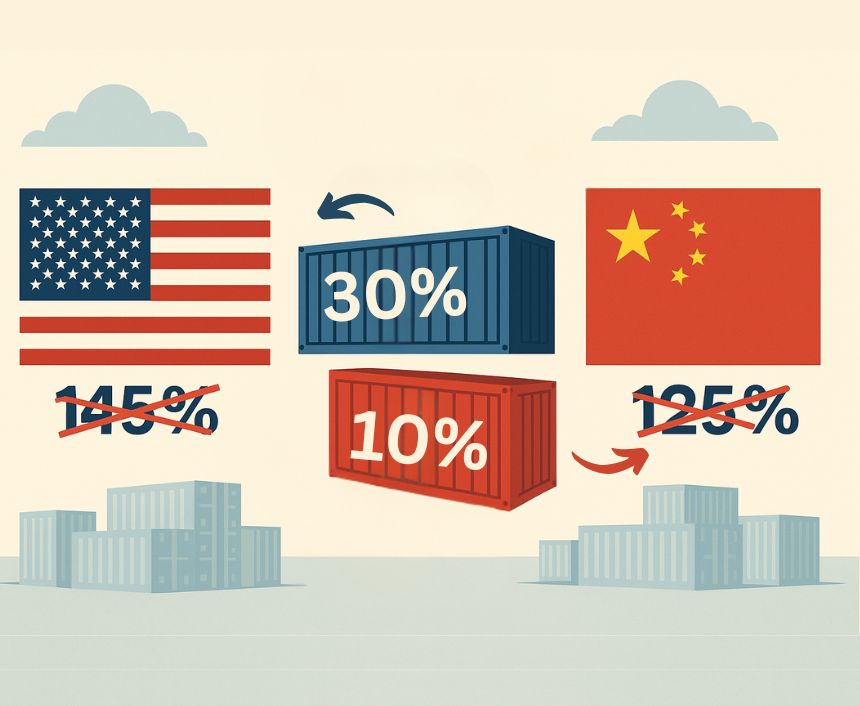
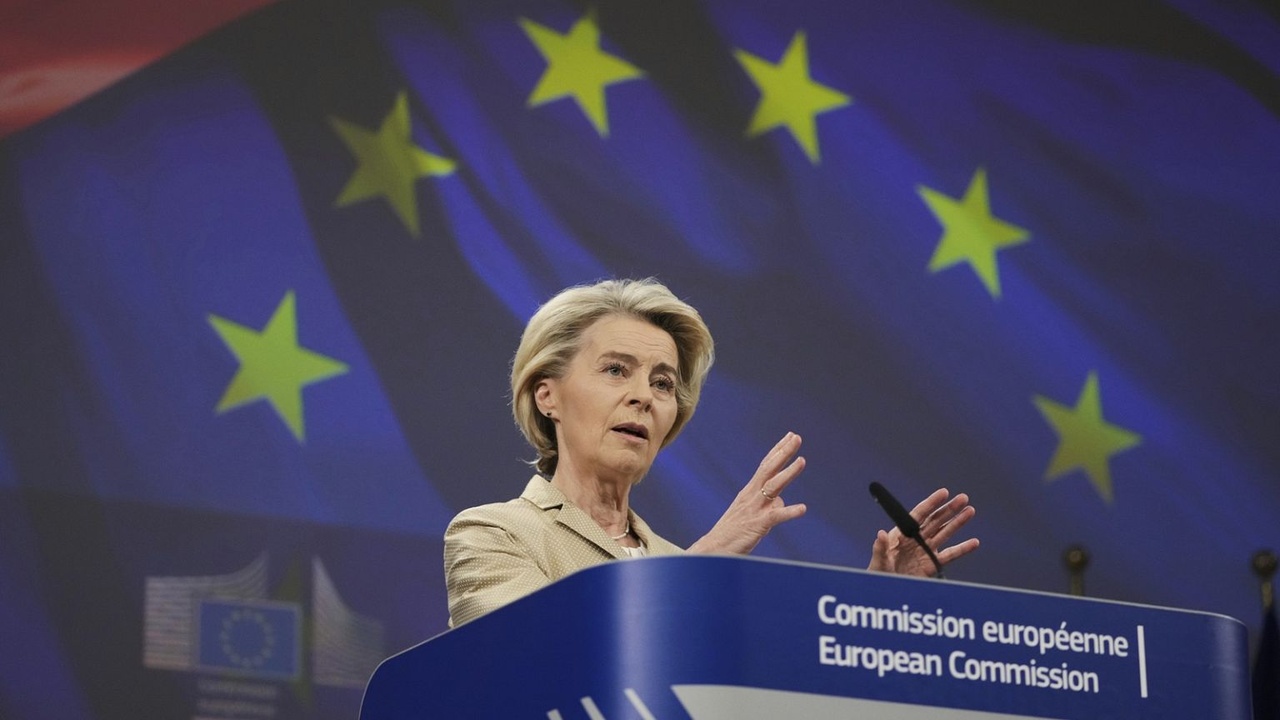
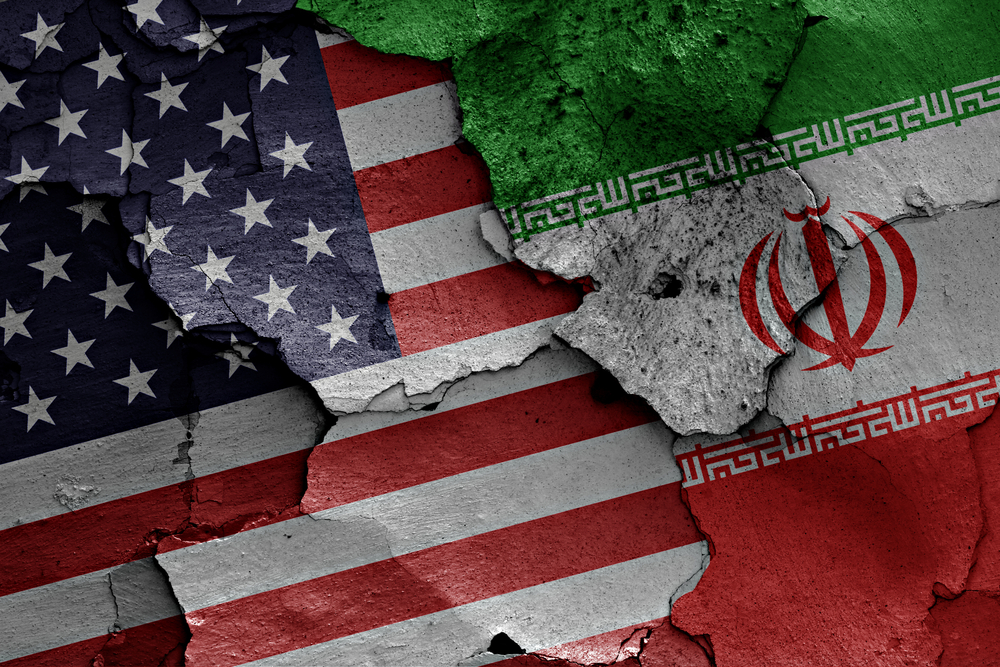
U.S.-China tariff reductions (effective May 14) ease trade pressures, boosting sentiment. A potential Iran nuclear deal could lift sanctions, per Okeanis, prompting NITC to renew its aging VLCC fleet and support asset values. EU sanctions target 189 Russian shadow fleet vessels, impacting crude flows to China and India. Red Sea rerouting persists, supporting tonne-miles, but a Houthi ceasefire could normalize routes. Clarksons forecasts 2.4% crude fleet growth in 2026, outpacing 0.5% demand, but OPEC+ hikes signal upside—VLCCs sail with cautious optimism.
⏳ Suezmax Market: Black Sea Pivot
Rate Stability
Suezmax vessels, critical for Black Sea and West African crude, hold steady with a structural shift. The Baltic’s TD20 (130,000 mt Nigeria-to-UK Continent) stabilizes at WS86.5-87.5 ($34,500 per day). Guyana-to-UK Continent (TD27) eases 3 points to WS82.5-83.5 ($32,171 per day, Rotterdam discharge). CPC-to-Augusta (TD6) hovers at WS110 ($43,800 per day), and Middle East-to-Mediterranean (TD23) remains at WS87.5-88. Clarksons’ Suezmax average drops 6.3% to $38,800 per day. Charterers limit upside by discreetly securing vessels, but tightening lists signal activity—Suezmax adapts to new trade patterns.
Regional Trends
The Black Sea sees Suezmax dominance, with 63.4% of CPC pipeline exports (Kazakhstan crude blend) versus 36.6% for Aframax, driven by long-haul Asian demand (India at 8.1%, China at 5.7%). A large June CPC program and Chevron’s Tengiz expansion boost volumes. Atlantic markets clear backlog, with U.S. Gulf and Liza runs absorbing European tonnage. MEG fundamentals weaken, with TD23 on subs at WS97.5, though Basrah stems add activity. Ballasters head to the Cape of Good Hope, easing oversupply—Suezmax leverages Black Sea efficiency.
External Pressures
U.S.-China tariff relief supports U.S. crude exports, potentially increasing Suezmax demand if Chinese purchases rise, per Fearnley. EU sanctions on Russian shadow fleets and U.S. blacklisting of Iranian facilitators (e.g., CCIC Singapore) raise risks. A potential Iran nuclear deal could shift trade to mainstream fleets, per Okeanis. Clarksons’ 2026 forecast (2.4% fleet growth, 0.5% demand) pressures rates, but CPC’s long-haul shift and OPEC+ hikes offer upside—Suezmax navigates with strategic confidence.
⏱️ Aframax Market: Softening Pressure
Rate Declines
Aframax vessels, versatile crude carriers, face softening rates across key regions. The Baltic’s TD7 (80,000 mt Cross-UK Continent) drops 10 points to WS113.75 ($26,600 per day, Hound Point-to-Wilhelmshaven). Cross-Mediterranean (TD19) falls 27 points to WS117.72 ($22,261 per day, Ceyhan-to-Lavera). East Coast Mexico/U.S. Gulf (TD26) and Covenas/U.S. Gulf (TD9) rise 13 points to WS154.17 ($34,300 per day) and WS151.88 ($32,700 per day). U.S. Gulf-to-UK Continent (TD25) slips 2 points to WS148.33 ($35,251 per day). Clarksons’ average drops 13% to $33,200 per day—Aframax grapples with oversupply.
Market Dynamics
North Sea activity slows, with rates softening as own vessels and Suezmax units absorb stems, pushing natural windows to the third decade. Mediterranean rates plummet due to excessive tonnage, with owners dropping rates to compete. U.S. Gulf local routes firm, but trans-Atlantic runs weaken. A 70,600-dwt Aframax is sanctioned for Iranian oil, risking availability. Ballasters arrive for third-decade cargoes, but quiet enquiry threatens sentiment. C3is reports its Aframax at $46,000 per day, reflecting spot market resilience—Aframax seeks demand catalysts.
Broader Forces
U.S.-China tariff relief could boost U.S. crude exports, supporting Aframax, but Red Sea normalization risks tonne-mile losses. EU sanctions on 189 Russian vessels and CPC’s Suezmax shift reduce Aframax’s Black Sea share. Clarksons’ 2026 forecast (2.4% fleet growth, 0.5% demand) and potential Iranian fleet renewal (post-sanctions) pressure rates. South Korea’s 20 million-barrel U.S. crude imports and OPEC+ hikes offer upside, but Mediterranean oversupply clouds prospects—Aframax navigates with cautious resilience.
⏸️ Clean Market: Surging Fortunes
Rate Gains
Clean tanker markets shine, with LR2 and LR1 leading gains. LR2 TC1 (75kt MEG/Japan) jumps from WS112.78 to WS141.67, yielding a TCE over $30,000 per day; TC20 (90kt MEG/UK-Continent) rises $575,000 to $3.83 million. LR1 TC5 (55kt MEG/Japan) adds 26.25 points to WS160.63, and TC8 (65kt MEG/UK-Continent) climbs from $2.72 million to $3.09 million. MR TC17 (35kt MEG/East Africa) reaches WS223, but UK-Continent TC2 (37kt ARA/U.S. Atlantic) falls 8.44 points to WS117.19 ($9,493 per day). Handymax TC6 (30kt Cross-Mediterranean) rises from WS131.94 to WS141.94—Clean markets ride a robust wave.
Trade Patterns
MEG LR2/LR1 markets surge with strong enquiry, tightening tonnage lists. UK-Continent MRs weaken due to cancellations, with TC2 and TC19 (37kt ARA/West Africa) dropping to WS136.39. U.S. Gulf MRs decline, with TC14 (38kt UK-Continent) at WS83.21 and TC21 (38kt Caribbean) at $425,000. South Korea’s high U.S. crude imports (540,000 bpd in April) and rising refinery margins post-maintenance support clean trades. Hafnia reports improved Q2 rates ($24,839 per day, 57% booked), driven by global demand—Clean tankers capitalize on regional strength.
Influencing Factors
U.S.-China tariff relief boosts sentiment, per Clarksons, supporting clean fuel trades. Red Sea disruptions increase tonne-miles, though normalization could boost short-haul volumes. Clarksons forecasts 6.3% clean fleet growth in 2026, pressuring rates, but rising global demand and low newbuild orders (per Hafnia) signal upside. U.S. sanctions on Iranian oil facilitators and EU’s Russian shadow fleet blacklist raise risks. South Korea’s inventory build (100 million barrels) and OPEC+ hikes fuel clean demand—Clean markets balance opportunity with supply risks.
🌐 What’s Moving It: Trade Shifts and Sanctions
Commodity Shifts
South Korea’s 20 million-barrel U.S. crude imports (May) and China’s 11 million bpd drive VLCC demand. CPC pipeline exports (Kazakhstan crude) shift to Suezmax, with long-haul Asian flows (India at 8.1%, China at 5.7%). OPEC+’s 411,000 bpd hike boosts crude volumes, while South Korea’s inventory build and rising refinery margins support clean trades. U.S. crude exports to China could rise post-tariff relief, per Fearnley, adding tonne-miles. Reduced coal/grain shipments increase segment competition—commodity shifts shape tanker dynamics.
Trade and Policy Pressures
U.S.-China tariff reductions (24% cut, effective May 14) ease trade constraints, boosting shipping sentiment. U.S. sanctions target Iranian oil facilitators (e.g., CCIC Singapore, Sepehr Energy) and a VLCC/LR1, risking disruptions. EU sanctions blacklist 189 Russian shadow fleet vessels, impacting crude flows to China/India. A potential Iran nuclear deal could lift sanctions, prompting NITC fleet renewal, per Okeanis. Red Sea normalization and 2026 fleet growth (2.4% crude, 6.3% clean) pressure rates, but OPEC+ hikes offer upside—policies steer the tanker path.
🌐 Market and Stocks: Navigating Opportunities
Stock Performance
Tanker stocks reflect mixed fortunes. Teekay Tankers $TNK (-2,39 %) reports $76 million net earnings (Q1, down from $148.9 million), with a $1 per share dividend disappointing analysts. Okeanis Eco Tankers $OET (-5,72 %) earns $12.6 million (Q1), with Q2 VLCC rates at $46,700 per day (72% booked). Hafnia’s $HAFNI (-3,07 %) net earnings drop to $63.2 million (from $219.6 million), but Q2 rates rise to $24,839 per day. Torm $TRMD A (-2,76 %) gains 6% after a Pareto “buy” upgrade, targeting DKK 137. C3is reports $7.9 million profit, with its Aframax at $46,000 per day—stocks balance softening rates with trade optimism.
Investor Insights
VLCCs eye an OPEC+ rally, but sanctions pose risks. Suezmax benefits from CPC’s long-haul shift, though Atlantic oversupply lingers. Aframax faces Mediterranean pressure, but U.S. Gulf strength offers upside. Clean markets (LR2/LR1) surge, though MR/Handymax face 2026 headwinds (6.3% fleet growth). Hafnia’s 80% payout and Torm’s undervaluation signal confidence. U.S.-China tariff relief and potential Iranian sanctions lift could boost tonne-miles, per Fearnley. Investors weigh geopolitical risks against supply constraints—strategies target long-term demand.
Sector Outlook
Sanctions, Red Sea dynamics, and tariff relief shape volatility, but OPEC+ hikes and South Korean imports drive demand. Clarksons’ 2026 forecast (crude steady, clean softening) highlights clean oversupply risks. LR2/LR1 and Suezmax benefit from trade shifts, while Aframax and MR navigate regional challenges. Stocks like Okeanis (strong Q2 bookings) and Hafnia (fleet scale) offer value if demand holds—investors balance short-term dips with long-term fundamentals.
🌐 Outlook: Charting Future Waves
Market Projections
VLCC ranges $43,000-$46,700 per day—OPEC+ hikes signal upside—optimistic. Suezmax at $32,000-$43,800—Black Sea shift sustains—steady. Aframax at $22,000-$35,300—Mediterranean weakness persists—challenged. Clean varies: LR2/LR1 at $30,000-$35,000 (surging), MR at $9,500-$20,000 (mixed), Handymax at $10,000-$14,000 (stable)—buoyant. Sanctions and fleet growth signal volatility—2026 could soften for clean markets.
Strategic Horizons
VLCCs leverage OPEC+ and South Korean imports, but Suezmax thrives on CPC’s Asian pivot. Aframax needs U.S. Gulf demand, while LR2/LR1 capitalizes on clean fuel trades. Handymax stabilizes, but MR risks stagnation without new cargoes. Sanctions, 2026 fleet growth (6.3% clean), and trade talks challenge margins, but low crude fleet growth (2.4%) and Iranian fleet renewal offer upside. Investors navigate trade shifts while betting on supply constraints—strategic moves will define tanker fortunes.
Your Call
Will VLCCs lead with an OPEC+ rally, or can Clean markets’ surge steal the spotlight? Share your take—let’s conquer the markets! 🚢
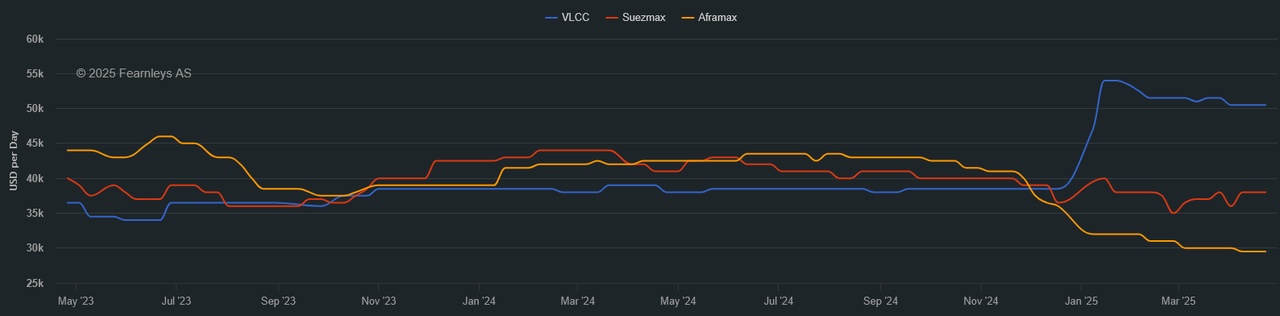
1 Year T/C - VLCC SUEZMAX AFRAMAX ECO / SCRUBBER - May 14th
*The Worldscale (WS) rate is a system used to calculate tanker freight rates, where WS 100 represents a standard base rate for a specific route. Rates above or below this benchmark indicate how much more or less a charterer will pay relative to the base cost. A higher WS rate means better earnings for shipowners, while a lower WS rate means lower transportation costs for charterers.


+ 1
77
1 Comentario
Pizza T.@matze_2366
11Lun
••
1Año·
🌊 Tanker Market Week 19 2025 : Tempest - VLCCs Soften, Suezmax Struggles, and Clean Markets Navigate New Currents
Mid-May 2025 finds the tanker market battling turbulent seas. Very Large Crude Carriers (VLCCs) soften after a bank holiday slowdown, Suezmax grapples with Atlantic oversupply, Aframax maintains resilience, and Clean markets show mixed fortunes with LR2/LR1 weakening and MR stabilizing. U.S. sanctions on Iranian oil, a Houthi ceasefire, and OPEC+ production hikes shape the horizon, while Russian-Chinese crude blends and U.S.-India flows offer opportunities. This sector is a tanker weathering global storms—let’s chart its course.
⏬ VLCC Market: Softening Under Pressure
Rate Declines
VLCCs, the behemoths of crude transport, face a softening market after a brief rally. The Baltic Exchange’s TD3C (270,000 mt Middle East Gulf-to-China) rate drops 6.5 points to WS59.55, yielding a round-trip time-charter equivalent (TCE) of $41,547 per day, down $8,000 from last week. West Africa-to-China (TD15) falls 4 points to WS61.69 ($44,561 per day), and U.S. Gulf-to-China (TD22) declines $186,533 to $8.66 million ($48,578 per day). Clarksons’ fleet-weighted average dips to $50,583 per day, cooling from mid-April’s $59,700 peak. A bank holiday and quiet Middle East Gulf (MEG) fixtures push TD3C to the low WS60s, with charterers leveraging a growing tonnage list—VLCCs navigate a cautious descent.
Cargo Dynamics
China’s crude imports (11 million bpd in April) sustain VLCC demand, driven by Iranian (1.71 million bpd) and Russian cargoes, but new U.S. sanctions target four VLCCs delivering Iranian oil to China, risking disruptions. Two VLCCs (310,000-dwt and 303,100-dwt) discharge Russian-Chinese crude blends in Venezuela, spoofing AIS to mask destinations. U.S. crude flows to India surge to 470,000 bpd in June, the highest since August 2023, fueled by WTI discounts and tariff delays. OPEC+’s June production hike (411,000 bpd, led by Saudi Arabia) adds four to five VLCCs, but third-decade MEG fixtures remain slow (8 million barrels covered)—VLCCs balance opportunity with sanctions risks.
Global Forces
U.S.-China trade talks (May 11) and potential tariff exemptions (e.g., for energy) create uncertainty, with VLCC asset values holding firm (five-year-old 320,000-dwt at $109.21 million). A Houthi ceasefire may reopen the Red Sea, reducing tonne-miles but boosting short-haul volumes. UK sanctions target 100 shadow fleet tankers (worth $24 billion in 2024), impacting Russian crude flows. Red Sea rerouting persists, supporting TCEs, but low fleet growth (2.4% in 2026) and OPEC+ hikes signal upside. Clarksons notes rising inventories could lift rates in a contango market—VLCCs sail with guarded optimism.
For illustrative purposes only
⏳ Suezmax Market: Atlantic Oversupply
Rate Weakness
Suezmax vessels, vital for West African and Black Sea crude, face mounting pressure. The Baltic’s TD20 (130,000 mt Nigeria-to-UK Continent) drops nearly 10 points to WS89.44, yielding a TCE of $37,051 per day. Guyana-to-UK Continent (TD27) falls 13 points to WS88.33 ($36,042 per day), and CPC-to-Augusta (TD6) collapses 21 points to WS109.15 ($44,500 per day) as CPC charterers use owned tonnage. Middle East-to-Mediterranean (TD23) slips to just below WS90. Rates hit $58,821 per day in April but soften to $52,954 by May 5, with U.S. Gulf replacements at WS85 signaling further declines—Suezmax struggles in an oversupplied Atlantic.
Regional Trends
West Africa sees weak enquiry, with 20+ Suezmax vessels available and 15 options within a five-day window, pushing TD20 toward WS90. U.S. Gulf softness (replacements at 145x85) and transatlantic activity (six options absorbed) limit upside. Black Sea TD6 weakens as CPC demand drops, with only eight third-decade stems remaining. China’s Kazakhstan CPC crude imports (240,000 bpd) and Norway’s Johan Castberg field (135,000 bpd) support rates, but West African barrel sales lag, requiring prompt fixtures. East of Suez markets appear overtonnaged, with ballasters heading to the Cape of Good Hope despite TD20’s decline—Suezmax seeks new demand sources.
External Pressures
U.S. port fees exempt sub-80,000 dwt Suezmax units, and energy tariff exemptions (except LNG) reduce disruptions, per Torm’s CEO. Houthi ceasefire talks could normalize Red Sea routes, offsetting tonne-mile gains with short-haul volumes. U.S. sanctions on Iranian oil and UK’s shadow fleet blacklist (400+ vessels) increase risks. Kazakhstan’s 1.7 million bpd output sustains CPC exports, but OPEC+ cuts (down 160,000 bpd in April) temper volumes. Clarksons forecasts 2.4% crude fleet growth in 2026, outpacing 0.5% demand, signaling rate pressure—Suezmax navigates a challenging outlook.
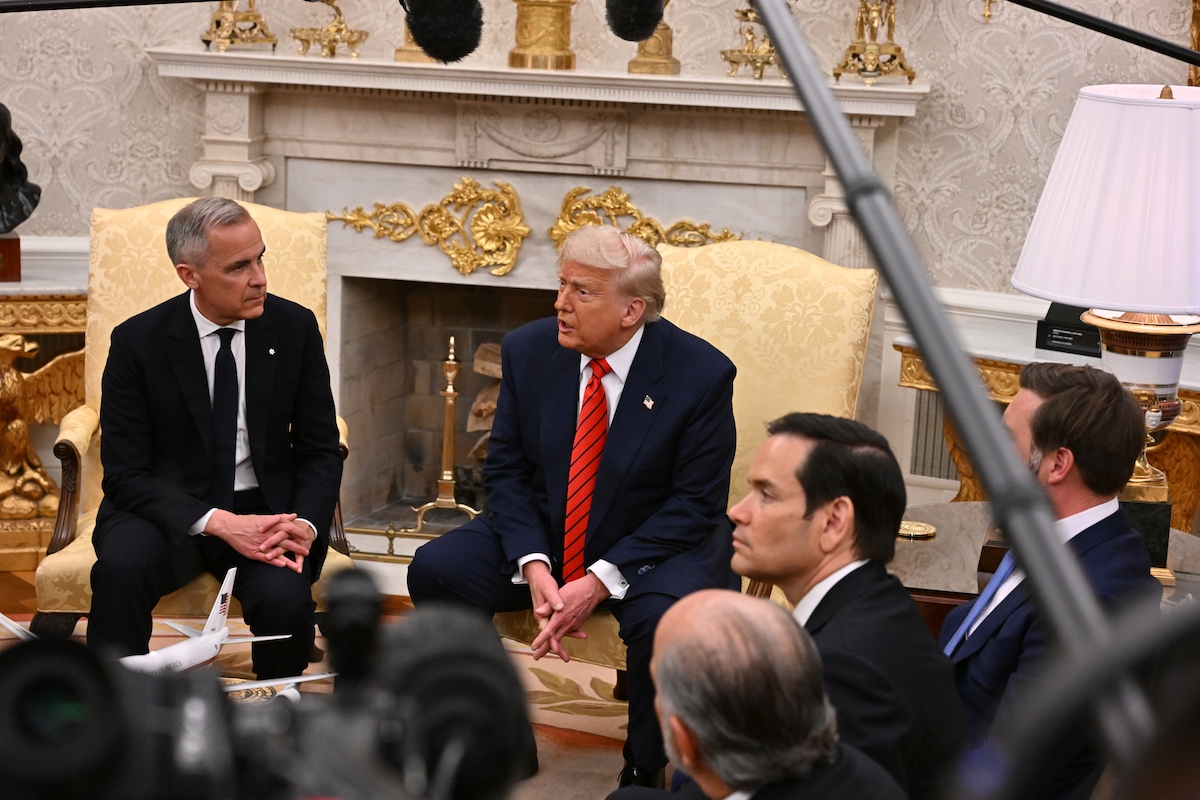
Trump announces the ceasefire during a meeting at the Oval office May 6, 2025
⏱️ Aframax Market: Resilient but Tested
Rate Stability
Aframax vessels, versatile crude carriers, hold steady amid softening trends. The Baltic’s TD7 (80,000 mt Cross-UK Continent) drops 7 points to WS125 ($39,100 per day, Hound Point-to-Wilhelmshaven). Cross-Mediterranean (TD19) falls 20 points to WS155 ($43,500 per day, Ceyhan-to-Lavera). Atlantic routes weaken, with East Coast Mexico/U.S. Gulf (TD26) and Covenas/U.S. Gulf (TD9) tumbling 28 points to WS140 ($29,100 and $28,800 per day). U.S. Gulf-to-UK Continent (TD25) remains at WS149-150 ($36,300 per day). Rates hit $51,450 per day in April but fall to $40,260 by May 5, yet strategic repositioning sustains resilience—Aframax balances stability with pressure.
Market Dynamics
North Sea rates weaken with growing tonnage lists, though second-decade stems offer activity. Mediterranean markets soften as Libyan and Ceyhan dates advance, with prompt tonnage oversupply. U.S. Gulf sees Aframax rates drop to 145x72.5, with no Suezmax spillover and weak Nigerian crude sales. Two Aframax vessels face U.S. sanctions for Iranian oil transfers, risking availability. Norway’s Johan Castberg (135,000 bpd) and Kazakhstan’s CPC crude support rates, but Atlantic oversupply caps gains. Signal Group’s repositioning to U.S. Gulf/Central Europe achieves $60,700 per day for May (27% fixed)—Aframax holds firm, eyeing new cargoes.
Broader Forces
U.S. port fee exemptions benefit sub-80,000 dwt Aframax vessels, and tariff exemptions for energy minimize disruptions. Houthi ceasefire talks may reduce Red Sea rerouting, but short-haul volumes could offset losses. U.S. and UK sanctions (e.g., 100 shadow fleet tankers) deter operators, while Red Sea disruptions boost tonne-miles. Clarksons’ 2026 forecast (2.4% crude fleet growth, 0.5% demand) signals rate pressure, but Johan Castberg’s 220,000 bpd by Q2 and U.S.-India crude flows (470,000 bpd) offer upside—Aframax navigates with cautious confidence.
Britain Friday sanctioned 100 Russian shadow fleet oil tankers oil tankers that carried more than $24 billion in cargo since the beginning of 2024.
⏸️ Clean Market: Mixed Performance
Rate Divergence
Clean tanker markets reflect regional splits. LR2 rates weaken, with TC1 (75kt MEG/Japan) dipping from WS123.33 to WS110.56 and TC20 (90kt MEG/UK-Continent) losing $231,250 to $3.25 million. LR1 rates stabilize, with TC5 (55kt MEG/Japan) holding at low WS130s and TC8 (65kt MEG/UK-Continent) at $2.7 million, but UK-Continent TC16 (60kt ARA/West Africa) falls 7.5 points to WS120. MR rates soften slightly, with TC17 (35kt MEG/East Africa) at WS210, TC2 (37kt ARA/U.S. Atlantic) down 6.88 points to WS126.56 ($12,044 per day), and TC19 (37kt ARA/West Africa) at WS146.88. Handymax weakens, with TC6 (30kt Cross-Mediterranean) at WS130.28 and TC23 (30kt Cross-UK-Continent) down 13.61 points to WS133.33—Clean markets navigate uneven currents.
Trade Patterns
MEG LR2/LR1 markets soften due to weak enquiry, though Asian tonnage lists tighten. UK-Continent LR1s and MRs face cancellations, lengthening tonnage lists. U.S. Gulf MRs stabilize with late-week demand, but TC14 (38kt/UK-Continent) falls to WS111.07 and TC21 (38kt/Caribbean) drops to $535,714. A 50,000-dwt MR delivers Qatar’s GTL diesel (35,000 tonnes) to the U.S. Gulf, capitalizing on tightening diesel inventories (down 2.4 million barrels). Refinery margins climb post-OPEC+ news, supporting cargo flows after maintenance. Mediterranean and U.S. Gulf MR markets benefit from repositioning, but Handymax lags—Clean tankers seek balance.
Influencing Factors
U.S. port fees minimally impact MR/Handymax (sub-55,000 dwt), and Torm notes no tariff disruptions for clean products (energy exempt). Houthi ceasefire talks could normalize Red Sea routes, but Torm’s CEO sees neutral rate impacts due to short-haul volume growth. Clarksons forecasts 6.3% clean fleet growth in 2026 with flat demand, pressuring rates. Rising refinery margins and U.S. diesel demand boost MR, while Qatar’s GTL trade signals arbitrage. U.S. sanctions on Iranian oil and Chinese terminals risk disruptions—Clean markets balance opportunity with oversupply risks.
For illustrative purposes only
🌐 What’s Moving It: Oil Flows and Sanctions
Commodity Shifts
U.S. crude to India (470,000 bpd in June) and China’s 11 million bpd imports drive VLCC demand, though Iranian sanctions disrupt flows. Russian-Chinese crude blends to Venezuela (1.2 million barrels) and Kazakhstan’s CPC crude (240,000 bpd) support Suezmax/Aframax. Norway’s Johan Castberg (135,000 bpd) adds cargoes, while OPEC+’s June hike (411,000 bpd) lifts crude sentiment. Clean markets benefit from Qatar’s GTL diesel and rising refinery margins post-maintenance, supporting MR. Falling crude prices and tightening U.S. diesel inventories fuel clean trades—oil flows shape tanker dynamics.
Policy Pressures
U.S. sanctions target six tankers (four VLCCs, two Aframax) and Chinese terminals for Iranian oil, risking VLCC/Aframax availability. UK’s shadow fleet sanctions (100 tankers, $24 billion) and Houthi ceasefire talks could normalize Red Sea routes, reducing tonne-miles but boosting short-haul volumes. U.S.-China trade talks (May 11) and energy tariff exemptions create uncertainty. Clarksons’ 2026 forecast (2.4% crude, 6.3% clean fleet growth) signals rate pressure, but OPEC+ hikes and new fields (e.g., Johan Castberg) offer upside—sanctions and trade policies steer the tanker path.
🌐 Market and Stocks: Navigating Volatility
Stock Performance
Tanker stocks reflect resilience. International Seaways $INSW (-1,62 %) reports $40 million adjusted net income ($0.80 per share), beating estimates, with VLCCs at $42,800 per day (Q2 guidance). DHT Holdings $DHT (-2,75 %) achieves $48,700 per day spot rates (72% booked), up 34% from Q1, with $0.15 per share dividend. BP $BP. (+1,71 %) sells six 46,000-dwt MRs for $192 million, possibly to Tsakos Group $TNP (-4,45 %) (nine Suezmax newbuildings, $1.34 billion). Scorpio Tankers $STNG (-1,83 %) and Hafnia $HAFNI (-3,07 %) are Fearnley’s top picks for MR/LR2 strength. Clarksons notes tanker earnings at $35,000 per day (45% above 10-year average)—stocks balance geopolitical risks with demand growth.
Investor Insights
VLCCs may rebound with OPEC+ hikes and rising inventories, but sanctions pose risks. Suezmax and Aframax rely on Kazakhstan and Norwegian crude, though Atlantic oversupply caps gains. Clean markets face 2026 headwinds (6.3% fleet growth), but MR benefits from U.S. diesel demand and GTL trades. Seaways’ $INSW (-1,62 %) VLCC buyback ($250 million refinancing) and Torm’s $TRMD A (-2,76 %) neutral Red Sea outlook signal confidence. Low crude fleet growth (2.4%) and sanctions risks shape strategies—investors weigh trade disruptions against supply constraints.
Sector Outlook
Sanctions, Houthi ceasefire talks, and Red Sea dynamics pressure rates, but OPEC+ hikes and new fields drive demand. Clarksons’ 2026 forecast (crude steady, clean easing) highlights clean oversupply risks. MR and Handymax benefit from clean fuel trades, while Suezmax and Aframax rely on CPC and Johan Castberg flows. Stocks like Seaways $INSW (-1,62 %) (strong liquidity, $673 million) and DHT $DHT (-2,75 %) (undervalued) offer value if demand holds—investors balance short-term volatility with long-term fundamentals.
🌐 Outlook: Charting Future Waves
Market Projections
VLCC ranges $41,000-$50,000 per day—OPEC+ hikes offer upside—cautious. Suezmax at $36,000-$44,500—Atlantic weakness persists—challenged. Aframax at $29,000-$43,500—resilience holds, but oversupply looms—steady. Clean varies: LR2/LR1 at $23,400-$28,800 (softening), MR at $12,000-$20,900 (stabilizing), Handymax at $10,000-$13,000 (pressured)—mixed. Red Sea normalization and sanctions signal volatility—2026 could soften with fleet growth.
Strategic Horizons
VLCCs leverage OPEC+ and U.S.-India flows, but Suezmax needs Atlantic demand. Aframax’s repositioning ensures stability, while MR capitalizes on clean fuel arbitrage. Handymax risks stagnation without new cargoes. Sanctions, 2026 fleet growth (6.3% clean), and trade talks challenge margins, but low crude fleet growth (2.4%) and new fields offer upside. Investors must navigate sanctions and geopolitical shifts while betting on supply constraints—strategic moves will define tanker fortunes.
Your Call
Will VLCCs rebound with OPEC+ hikes, or can MR’s clean fuel trades lead the way? Share your take—let’s conquer the markets! 🚢
1 Year T/C - VLCC SUEZMAX AFRAMAX ECO / SCRUBBER - May 7th
*The Worldscale (WS) rate is a system used to calculate tanker freight rates, where WS 100 represents a standard base rate for a specific route. Rates above or below this benchmark indicate how much more or less a charterer will pay relative to the base cost. A higher WS rate means better earnings for shipowners, while a lower WS rate means lower transportation costs for charterers.

+ 1
55
1Año·
International Seaways (INSW) Q1 2025 Earning Flash
💹Revenues : $183.39M ( Est. $176.50M) 🟢
💵 Earning Per Share : $0.80 (Est. $0.64) 🟢
💰Dividend : $0.60 / shr on June 26th for shareholder as of June 12th
💭CEO comments : " We delivered encouraging results for the first quarter of 2025, which were marked by a gradual strengthening of market conditions each month. Seaways took advantage of our balanced sheet of crude and product tankers to execute our disciplined capital allocation strategy.
After two consecutive years of returning over $300 million to shareholders, we declared a combined dividend of $0.60 per share for the first quarter, delivering on our intention to return 75% of adjusted net income to shareholders.
With our enhanced scale through pool employment and our healthy balance sheet, we believe we are well positioned to build on our track record of delivering compelling returns and incremental value for shareholders.
While OECD inventories drew down by 50 million barrels during the quarter, pressuring
near-term market fundamentals, the rate environment improved progressively during the first quarter.
Looking ahead, the global economic outlook remains clouded by geopolitical uncertainty, but we believe oil demand will continue to grow. With inventories at depleted levels, replenishment will be necessary. We expect these dynamics, coupled with persistent regional imbalances, to support demand growth for seaborne transportation.
We remain constructive on tanker supply, with modest fleet growth from scheduled deliveries and elevated recycling volumes - already ahead of recent years - that should help absorb new capacity. "
💭CFO Comments : " Seaways continues to deliver on its commitment to balanced capital
allocation. For the third consecutive quarter, we are returning 75% or more of our adjusted net income to shareholders through dividends.
At the same time, we are reducing debt to preserve substantial revolving credit capacity to support fleet growth.
We remain active in renewing our fleet with our strategic vessel swap, sales of older tonnage and progress payments on our newbuilding program, even as broader market transaction activity has slowed. Based on our strong financial position, highlighted by total liquidity of $673 million, we remain opportunistic with fleet renewal across our varied asset classes. "
22
3 Comentarios
Ah yeah that one has appeared dseveral times in my screening list but still hasn’t made the cut (lots of decisions and little capital to invest haha)
•
11
•1Año·
🌍 Tanker Market Update Week 18 2025 : VLCCs Ride Chinese Demand as Smaller Vessels Face Tariff Storms
Early May 2025 sees the tanker market at a crossroads. Very Large Crude Carriers (VLCCs) capitalize on China’s strategic oil stockpiling, Suezmax softens amid West African demand dips, Aframax maintains resilience, and Clean markets show mixed fortunes with LR2/LR1 weakening and MR recovering. U.S. tariffs, Houthi sanctions, and Kazakhstan’s crude surge shape the horizon, while new Norwegian fields and rerouted clean fuels offer opportunities. This sector is a tanker navigating global currents—let’s explore its journey.
⏬ VLCC Market: Buoyant on Chinese Demand
Rate Fluctuations
VLCCs, the giants of crude transport, ride a wave of Chinese demand but face tariff headwinds. The Baltic Exchange’s TD3C (270,000 mt Middle East Gulf-to-China) rate drops 5.5 points to WS67, yielding a round-trip time-charter equivalent (TCE) of $51,134 per day. West Africa-to-China (TD15) eases 2.5 points to WS67.13 ($51,690 per day), while U.S. Gulf-to-China (TD22) rises by $411,358, achieving a TCE of $51,054 per day. Clarksons’ fleet-weighted average hits $59,700 per day, up 9% week-on-week, despite a quiet Middle East Gulf (MEG) market post-rally (mid WS70s for MEG/East). Charterers hold back on second-decade MEG fixtures, creating uncertainty—VLCCs remain robust but cautious.
Cargo Dynamics
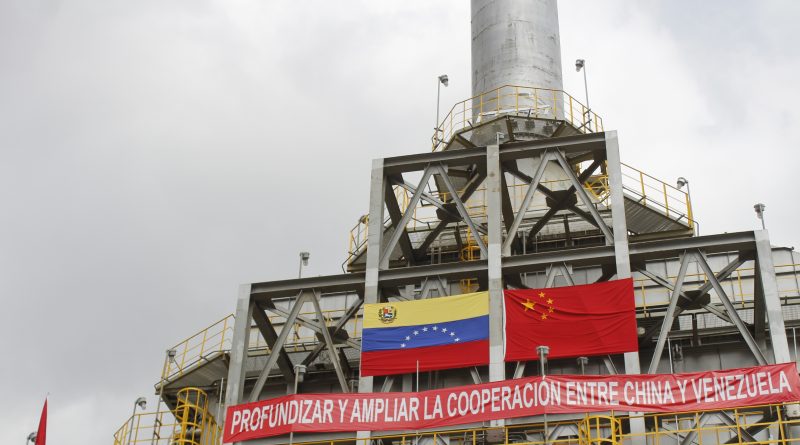
China’s crude imports surge to 11 million barrels per day in April, the highest since August 2023, driven by strategic stockpiling amid low crude stockpiles (six-year low) and easing Brent prices ($70 in early March). Imports from Iran (1.71 million bpd) and Russia rise, though U.S. crude faces tariff risks (125% on WTI Midland). Two VLCCs (319,000-dwt each) divert from China to Singapore and Malaysia, while a 319,000-dwt vessel discharges 1.99 million barrels in Ningbo, possibly under tariff exemptions. Middle East and West African cargoes slow for third-decade fixtures (8 million barrels covered), but OPEC’s May production boost supports sentiment. Venezuela’s “zombie” VLCCs (e.g., 320,000-dwt ship spoofing as a scrapped vessel) add risk—China’s demand drives VLCC strength, tempered by trade uncertainties.
Global Forces
U.S.-China tariffs (affecting 0.4% of seaborne oil trade) and potential exemptions (e.g., for crude) create volatility, with five VLCCs fixed for May U.S.-China voyages at risk of diversion. Houthi sanctions blacklist vessels delivering to Yemen’s Ras Isa port, impacting VLCC counts. Red Sea rerouting via the Cape of Good Hope persists, boosting tonne-miles. China’s refinery maintenance (April-May) typically curbs demand, but strategic buying defies trends. Low fleet growth (2.4% in 2026) and OPEC’s potential June output hike signal upside, though trade tensions and sanctions cloud the outlook—VLCCs sail with guarded optimism.
For illustrative purposes
⏳ Suezmax Market: Atlantic Softness
Rate Declines
Suezmax vessels, key for West African and Black Sea crude, face softening rates. The Baltic’s TD20 (130,000 mt Nigeria-to-UK Continent) falls 10 points to WS109.17, yielding a TCE of $50,178 per day. Guyana-to-UK Continent (TD27) drops 9 points to WS107.5 ($48,939 per day), while CPC-to-Augusta (TD6) loses 4 points to WS131.55 ($63,500 per day). Middle East-to-Mediterranean (TD23) holds steady at WS91. Rates hit a 2025 high of $56,540 per day in early April, but West African demand tails off, eroding gains—Suezmax navigates a challenging Atlantic market.
Regional Trends
West Africa sees reduced enquiry, with only 20 suitable Suezmax vessels available for third-decade fixtures, signaling further softening below WS110. U.S. Gulf crude struggles eastbound, boosting transatlantic activity (WS95), but local tonnage erodes. China’s resumption of Kazakhstan CPC crude imports (240,000 bpd in April) via Novorossiysk supports TD6 stability, with nine cargoes fixed for May-June. Norwegian Johan Castberg field (135,000 bpd in May) adds demand, with a 158,000-dwt vessel loading 700,000-barrel stems. Black Sea and Mediterranean markets benefit from CPC flows, but Atlantic oversupply persists—Suezmax relies on new trade lanes.
External Pressures
U.S. port fees exempt sub-80,000 dwt vessels, sparing smaller Suezmax units, but tariffs on Venezuelan oil and Houthi sanctions increase risks. Red Sea disruptions extend voyage times, supporting TCEs. Kazakhstan’s 1.7 million bpd output sustains CPC exports, though OPEC+ cuts (down 160,000 bpd in April) temper volumes. China’s property crisis and renewable energy push may curb oil demand, per Clarksons, but Johan Castberg’s light crude offers European refiners an alternative. Low fleet growth (2.4% in 2026) and geopolitical risks (e.g., Russia-Ukraine ceasefire) shape prospects—Suezmax seeks balance amid Atlantic weakness.
For illustrative purposes
⏱️ Aframax Market: Resilient Amid Pressure
Rate Stability
Aframax vessels, versatile crude carriers, hold steady despite softening trends. The Baltic’s TD7 (80,000 mt Cross-UK Continent) slips 4 points to WS135 ($49,100 per day, Hound Point-to-Wilhelmshaven). Cross-Mediterranean (TD19) drops 4 points to WS176.61 ($54,700 per day, Ceyhan-to-Lavera). Atlantic routes weaken, with East Coast Mexico/U.S. Gulf (TD26) and Covenas/U.S. Gulf (TD9) falling 10 points to WS178-177 ($46,500 and $43,800 per day). U.S. Gulf-to-UK Continent (TD25) slides 3.5 points to WS170 ($44,517 per day). Signal Group’s pool reports $60,700 per day for May (27% fixed), reflecting strategic repositioning—Aframax remains resilient but faces downward pressure.
Market Dynamics
North Sea rates stabilize despite limited activity, with second-decade stems busier but growing tonnage lists threatening softness. Mediterranean markets soften as Libyan and Ceyhan dates advance, with North Sea competition adding pressure. U.S. Gulf sees no Aframax spillover from Suezmax, and Nigerian crude struggles limit enquiry. Signal Group’s repositioning to U.S. Gulf and Central Europe (from U.S. West Coast and Lithuania) captures market strength, achieving $43,600 per day in April (98% fixed). Kazakhstan CPC crude and Johan Castberg cargoes support rates, but Mediterranean tonnage balance weakens—Aframax holds firm, eyeing new opportunities.
Broader Forces
U.S. port fee exemptions benefit sub-80,000 dwt Aframax vessels, and Scorpio Tankers notes minimal impact from China-targeted fees due to fleet structure (South Korean-built, sub-55,000 dwt). Houthi sanctions and Venezuelan tariff risks deter operators, while Red Sea rerouting boosts tonne-miles. Clarksons forecasts 2.4% crude fleet growth in 2026, outpacing 0.5% demand, signaling rate pressure. Kazakhstan’s CPC surge and Norway’s Johan Castberg (220,000 bpd by Q2) provide upside, but trade tensions and oversupply loom—Aframax navigates with cautious confidence.
An F/A-18E Super Hornet prepares to launch off the USS Harry S. Truman - For illustrative purposes
⏸️ Clean Market: Mixed Fortunes
Rate Divergence
Clean tanker markets show varied performance. LR2 rates dip, with TC1 (75kt MEG/Japan) falling 2 points to WS124.44 and TC20 (90kt MEG/UK-Continent) dropping $85,000 to $3.5 million. LR1 rates sink further, with TC5 (55kt MEG/Japan) losing 13 points to WS134.06 and TC8 (65kt MEG/UK-Continent) falling to $2.714 million. MR markets recover, with TC17 (35kt MEG/East Africa) up 2 points to WS213.21 ($21,800 per day) and U.S. Gulf TC14 (38kt/UK-Continent) gaining 13 points to WS122.5. Handymax struggles, with TC6 (Baltic) dropping 32.5 points to WS136.94 and TC23 (30kt Cross-UK-Continent) falling 20 points to WS151.67—Clean markets reflect regional splits.
Trade Patterns
MEG LR2/LR1 rates weaken as demand softens, while UK-Continent LR1s hold at WS130 ($24,000 per day). MR markets rebound, driven by U.S. Gulf strength (TC18 up 9 points to WS166.79) and Caribbean runs (TC21 up $77,000 to $589,286). Handymax faces pressure from oversupply and weak Baltic/UK-Continent demand. A 50,000-dwt MR delivers 35,000 tonnes of Qatar’s GTL diesel to the U.S. Gulf, capitalizing on tightening diesel inventories (down 2.4 million barrels). Mediterranean and U.S. Gulf MR markets benefit from repositioning, but Handymax lags—Clean tankers navigate a fragmented landscape.
Influencing Factors
U.S. port fees minimally impact MR and Handymax (sub-55,000 dwt), but LR2 faces risks, though Scorpio notes limited U.S. exposure. Red Sea disruptions support clean tonne-miles, but Clarksons forecasts 6.3% clean fleet growth in 2026 with flat demand, pressuring rates. Qatar’s GTL shipment signals new arbitrage, while China’s potential tariff exemptions (e.g., for chemicals) could boost clean trades. Houthi sanctions and Venezuelan risks deter operators, but U.S. diesel demand offers MR upside—Clean markets balance opportunity with oversupply risks.
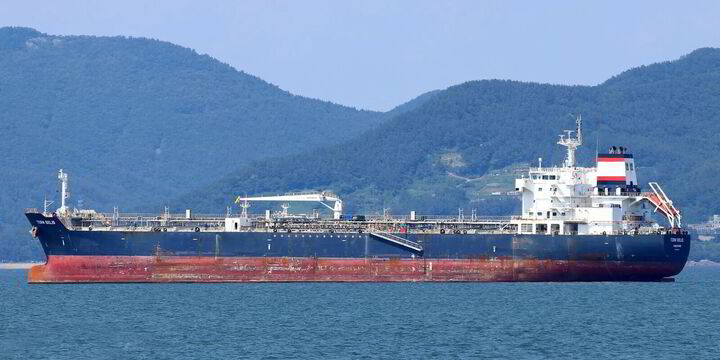
The Torm Belis - For illustrative purposes
🌐 What’s Moving It: Oil Flows and Trade Policies
Commodity Shifts
China’s 11 million bpd crude imports (April) drive VLCC demand, fueled by Iranian (1.71 million bpd) and Russian cargoes, though U.S. crude faces tariff hurdles. Kazakhstan’s CPC crude (240,000 bpd) and Norway’s Johan Castberg (135,000 bpd) boost Suezmax and Aframax. Venezuelan “zombie” tankers (e.g., spoofing scrapped VLCCs) sustain illicit flows. Clean markets see GTL diesel from Qatar to the U.S. (35,000 tonnes) and tightening U.S. diesel inventories, supporting MR. OPEC’s May output hike and potential June increase lift crude sentiment, but China’s refinery maintenance curbs upside—oil flows shape tanker dynamics.
Trade and Policy Pressures
U.S.-China tariffs (0.4% of oil trade) and potential exemptions (e.g., for crude, chemicals) create uncertainty, diverting VLCCs to Singapore/Malaysia. Houthi sanctions blacklist vessels at Yemen’s Ras Isa, impacting crude and clean trades. U.S. port fees exempt sub-55,000 dwt tankers, sparing MR/Handymax, but Venezuelan tariffs and Red Sea rerouting increase costs. Geopolitical risks (e.g., Russia-Ukraine ceasefire, Trump’s policies) and Clarksons’ 2026 forecast (2.4% crude, 6.3% clean fleet growth) signal rate pressure. Kazakhstan’s CPC surge and Qatar’s GTL trade offer opportunities—trade policies steer the tanker path.
🌐 Market and Stocks: Balancing Volatility
Stock Performance
Tanker stocks navigate trade uncertainties. Scorpio Tankers $STNG (-1,83 %) reports strong Q1 earnings, beating expectations, with a $397 million cash balance and 10% loan-to-value ratio. Its MR/Handymax fleet (sub-55,000 dwt) avoids U.S. port fee impacts, and LR2s face minimal U.S. exposure. BP $BP. (+1,71 %) sells six 46,000-dwt MRs for $192 million ($32 million each), possibly to Tsakos Group $TNP (-4,45 %) , which secures nine Suezmax newbuildings ($1.34 billion). Scorpio’s 115,000-dwt LR2 earns $32,000 per day (two-year charter), and its 38,700-dwt Handysize fetches $24,000 per day. Clarksons notes tanker earnings at $35,000 per day (45% above 10-year average)—stocks reflect resilience amid risks.
Investor Insights
VLCC rates may soften if MEG fixtures remain quiet, but China’s stockpiling and OPEC output support sentiment. Suezmax and Aframax benefit from Kazakhstan and Norwegian crude, though Atlantic oversupply caps gains. Clean markets face 2026 headwinds (6.3% fleet growth), but MR strength (e.g., U.S. diesel demand) offers upside. Scorpio’s conservative capital allocation (minimal buybacks, $339 million in 2024) reflects geopolitical caution, while Tsakos’ fleet expansion signals long-term optimism. Low crude fleet growth (2.4%) and sanctions risks shape strategies—investors weigh trade volatility against supply constraints.
Sector Outlook
U.S. tariffs, Houthi sanctions, and Red Sea rerouting pressure rates, but China’s crude imports and new fields (e.g., Johan Castberg) drive demand. Clarksons’ 2026 forecast (crude earnings steady, clean easing) highlights oversupply risks, particularly for LR2/LR1. MR and Handymax benefit from U.S. diesel and GTL trades, while Suezmax and Aframax rely on CPC and Norwegian flows. Stocks like Scorpio (trading below net asset value) and Tsakos (expanding fleet) offer value if demand holds—investors balance short-term risks with long-term fundamentals.
🌐 Outlook: Charting Future Currents
Market Projections
VLCC ranges $50,000-$60,000 per day—China’s demand sustains strength—buoyant. Suezmax at $48,000-$63,000—Atlantic softness limits upside—cautious. Aframax at $43,000-$54,000—resilience persists, but oversupply looms—steady. Clean varies: LR2/LR1 at $15,000-$24,000 (weakening), MR at $15,000-$22,000 (recovering), Handymax at $10,000-$15,000 (pressured)—mixed. Red Sea rerouting and new trades signal volatility—2026 could soften if fleet growth outpaces demand.
Strategic Horizons
VLCCs thrive on Chinese and OPEC flows, but Suezmax needs stronger Atlantic demand. Aframax’s repositioning (e.g., Signal’s U.S. Gulf focus) ensures stability, while MR capitalizes on clean fuel arbitrage. Handymax risks stagnation without new cargoes. Tariffs, sanctions, and 2026 fleet growth (6.3% clean) challenge margins, but low crude fleet growth (2.4%) and new fields offer upside. Investors must navigate geopolitical uncertainties while betting on supply constraints—strategic moves will define tanker fortunes.
Your Call
Will VLCCs lead with Chinese demand, or can MR’s clean fuel surge steal the spotlight? Share your take—let’s master the markets! 🚢
1 Year T/C - VLCC SUEZMAX AFRAMAX ECO / SCRUBBER - April 30th
*The Worldscale (WS) rate is a system used to calculate tanker freight rates, where WS 100 represents a standard base rate for a specific route. Rates above or below this benchmark indicate how much more or less a charterer will pay relative to the base cost. A higher WS rate means better earnings for shipowners, while a lower WS rate means lower transportation costs for charterers.
+ 1
66
4 Comentarios
Hello Jo,
have you ever happened to look into a company called SFL Corporation $SFL ?
I stumbeld over an article by wallstreet online which was featuring them. From what I read that could be an investment vehicle one could use to cover a wider range of the shipping market with just a single stock. They charter ships to a number of different operators.
https://www.wallstreet-online.de/nachricht/19313308-passives-einkommen-hochdividende-hochglanz-koenigliche-rendite-hoher-see
Greetings, Martin
•
11
•1Año·
🌍 Tanker Market Update Week 17 2025 : Triumph - Surfing OPEC+ Surges Amid Tariff Tensions
Emendo : This is a repost due to a getquin bug blockign me to correct the OG post
Late April 2025 finds the tanker market riding a crest of opportunity. VLCCs capitalize on OPEC+ production boosts, Suezmax contends with Atlantic uncertainties, Aframax leverages tight regional tonnage, and clean tankers pioneer new trade lanes. U.S. port fees ease, Venezuelan exports stumble, and sanctions reshape shadow fleets. This sector is a ship charging through global storms with bold resolve—let’s map its journey.
⏬ VLCC Market: Harnessing OPEC+ Power
Rate Surge
VLCCs, the behemoths of crude transport, are powering forward with vigor. Baltic Exchange Middle East-to-Asia rates soar to $57,400 per day, a 27% week-on-week leap, with eco-designed vessels reaching $57,800. Jefferies reports earnings at $55,700 daily, driven by a WS 70.93 rate for 270,000 mt Middle East-to-China (TD3C), yielding a $55,010 round-trip TCE. West Africa-to-China (TD15) climbs to WS 68.41 ($52,418 TCE), while U.S. Gulf-to-China (TD22) hits $8.35 million ($45,941 TCE). Taiwan’s CPC Corp secures Wirana’s Hansika at $79,503 daily for early May cargoes, reflecting intense demand as charterers scramble for tonnage.
Cargo Catalysts
OPEC+’s accelerated 411,000 barrel-per-day production increase (from a planned 2.2 million over 18 months) and Saudi Arabia’s 200,000 barrel-per-day boost ignite Middle East activity. Novisea attributes a 34% rate spike to pre-Easter cargo surges and U.S. sanctions on Iranian VLCCs (e.g., Bestla, Egret), which sideline shadow fleets and tighten compliant tonnage. China’s pivot to Saudi crude (replacing 135,000 barrel-per-day U.S. imports) and Nigeria’s potential U.S. crude imports (to offset trade imbalances) extend voyage distances. Clarksons notes 90% fleet utilization (up from 83% six months ago), signaling a market stretched thin—VLCCs thrive on this cargo boom.
Global Forces
U.S.-China tariff talks (potentially dropping to 50-65% from 145%) spark optimism, while U.S. port fees ($18-$33 per net tonne by 2028) soften with exemptions for ballast vessels and tankers under 55,000 dwt. Reuters reports OPEC+ members pushing for further production hikes, which Jefferies says could drive counter-cyclical strength into summer. U.S.-Iran negotiations and Houthi tensions add volatility, but a historically low orderbook (3% fleet growth) and aging vessels (10% over 20 years) ensure rate swings. Novisea sees geopolitical risks pushing rates past $50,000 short-term—VLCCs sail with bullish momentum, poised for further gains.
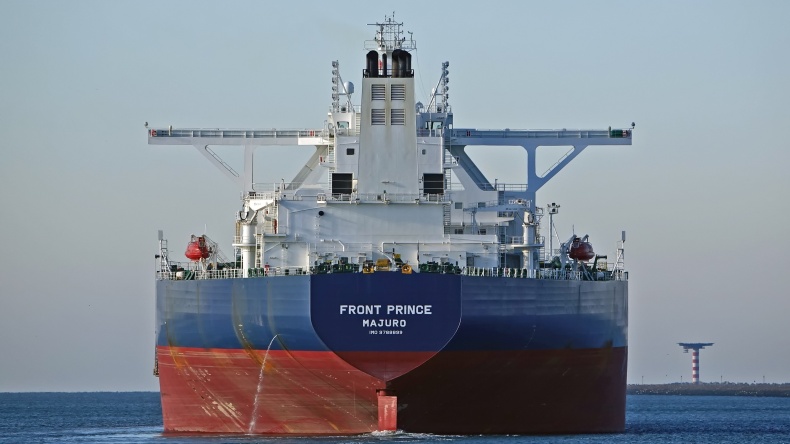
Frontline-owned VLCC Front Prince - For illustrative purposes
⏳ Suezmax Market: Braving Atlantic Volatility
Earnings Snapshot
Suezmax tankers, the versatile mid-tier carriers, maintain robust earnings but face looming challenges. Baltic Exchange TCE earnings hit $60,400 per day, up 1.7% weekly, with West Africa-to-UK Continent (TD20) at WS 120.28 ($57,338 TCE). Guyana-to-UK Continent (TD27) reaches WS 115.28 ($54,152 TCE), and CPC-to-Mediterranean (TD6) holds steady at WS 135 ($67,939 TCE). Middle East-to-Mediterranean (TD23) stabilizes at WS 91—buoyant rates reflect strong European and West African demand, yet Fearnleys warns of headwinds as VLCCs encroach and U.S. markets weaken.
Regional Risks
May’s first decade clears 32-33 million barrels, but VLCCs erode the second, with six Suezmax stems already booked. U.S. Gulf’s softer Aframax rates ($46,507 TCE for TD25) discourage transatlantic ballasting, while Mediterranean earnings slip as East Mediterranean tonnage emerges and Bosphorus Strait delays ease. West Africa’s tonnage list thins (five firm options to May 10, 20 more by weekend), but charterers’ cautious bidding—some receiving zero offers—suggests a potential pause if owners’ TD20 ambitions soar too high. Fearnleys notes futures declining to WS 69.85 for August, hinting at cooling sentiment—Suezmax holds firm but braces for turbulence.
External Influences
Venezuela’s suspension of Chevron’s $CVX (+2,03 %) 200,000 barrel-per-day U.S. exports floods the Atlantic with Suezmax and Aframax tonnage, though redirected ships find work in Brazilian or Nigerian trades. U.S. port fee exemptions for short-haul voyages (under 2,000 nautical miles) protect regional routes, but Chinese-owned tankers face steep levies (up to $140 per net tonne by 2028). OPEC+’s output surge sustains cargo volumes, yet Braemar warns that Atlantic supply buildup could empower charterers—Suezmax navigates with resilience, eyeing stability.
⏱️ Aframax Market: Capitalizing on Scarcity
Rate Highlights
Aframax tankers, the nimble crude haulers, shine amid regional scarcity. Mediterranean Cross-Med (TD19) dips to WS 181.11 ($61,100 TCE basis Ceyhan-to-Lavera), but North Sea Cross-UK (TD7) rises to WS 140 ($55,065 TCE basis Hound Point-to-Wilhelmshaven). Across the Atlantic, U.S. Gulf-to-UK (TD25) falls to WS 176.39 ($46,507 TCE), while Mexico-to-U.S. Gulf (TD26) and Covenas-to-U.S. Gulf (TD9) drop to WS 193 ($52,500 TCE) and WS 190 ($48,100 TCE). A pre-Easter rush clears April, with May stems tightening as ballast options shrink—scarcity fuels Aframax’s fiery ascent.
Tonnage Dynamics
Venezuela’s PDVSA halts Chevron loadings (e.g., Sea Dragon, Andromeda), redirecting Aframaxes to spot markets like Aruba or the U.S. Gulf. Kpler reports Carina Voyager unloading 511,000 barrels after idling, while Dubai Attraction awaits clearance for 340,000 barrels. Mediterranean softness emerges with early May tonnage returning, yet CPC holds at WS 205. Charterers face limited options—owners’ competitive fixing sustains elevated rates. Nigerian U.S. crude imports (135,000 barrels per day in March) and Brazil-to-China trades ($18.74 per tonne) absorb excess tonnage—scarcity drives this market’s strength.
Broader Catalysts
U.S. sanctions on Jugwinder Brar’s 27-tanker fleet (e.g., Global Genesis) and Iranian oil facilitators (e.g., B and P Solutions) curb shadow fleet capacity, boosting mainstream Aframax demand. Braemar calculates only 3% of 2024 tanker voyages would face U.S. port fees, with exemptions for non-Chinese owners easing concerns. China’s shift to Saudi crude and Nigeria’s Dangote refinery eyeing U.S. barrels stretch tonne-miles—sanctions and regional demand propel Aframax’s upward trajectory.
Saudi Crown Prince Mohammed Bin Salman welcomes Chinese President Xi Jinping in Riyadh, Saudi Arabia in 2022 - For illustrative purposes
⏸️ LR/MR/Handymax Market: Pioneering New Trades
Rate Rundown
Clean tankers sail a varied course. LR2 Middle East-to-Japan (TC1) rises to WS 126.67, holding at $3.5 million for MEG-to-UK (TC20). LR1 MEG-to-Japan (TC5) surges to WS 149.88, with MEG-to-UK (TC8) at $2.84 million. MR Middle East-to-East Africa (TC17) climbs to WS 211.43 ($20,000 TCE), but UK-Continent MRs falter—TC2 (ARA-to-U.S.) drops to WS 147.5 ($16,231 TCE), TC19 (ARA-to-West Africa) to WS 167.5. Handymax Mediterranean (TC6) slips to WS 169.72, while UK-Continent (TC23) hits WS 170—Eastern trades lead, Western routes lag.
Innovative Flows
Emerging trade lanes spark excitement. Nigeria’s Dangote refinery explores U.S. crude imports to free local barrels for China, lifting LR and MR demand. China’s pivot to Saudi crude (replacing U.S. imports) bolsters LR1 and LR2 hauls from the Middle East. U.S. Gulf MRs weaken (TC14 at WS 107.56, TC18 at WS 155), but late-week TC2 fixtures at higher levels signal a rebound. Norden’s carbon-negative biofuel trial (65 tonnes on Nord Power) tests decarbonization, though scalability remains distant. Handymax struggles with Mediterranean softness, but Eastern MRs thrive on tight tonnage—new routes define this market’s dynamism.
Influencing Factors
U.S. port fees target Chinese-owned tankers, prompting Braemar to predict MR sales by Chinese lessors—exemptions for sub-55,000 dwt vessels shield most clean tankers. Clarksons notes 9% of 2024 U.S. port calls would face fees, with flexibility for vessel redeployment mitigating costs. Sanctions on Iranian shadow fleets (e.g., Glory International’s MRs) and tariff relief (50-65% rates) tighten compliant tonnage. OPEC+’s output hikes support clean product flows—clean tankers pivot to capitalize on Eastern vigor and innovative trades.
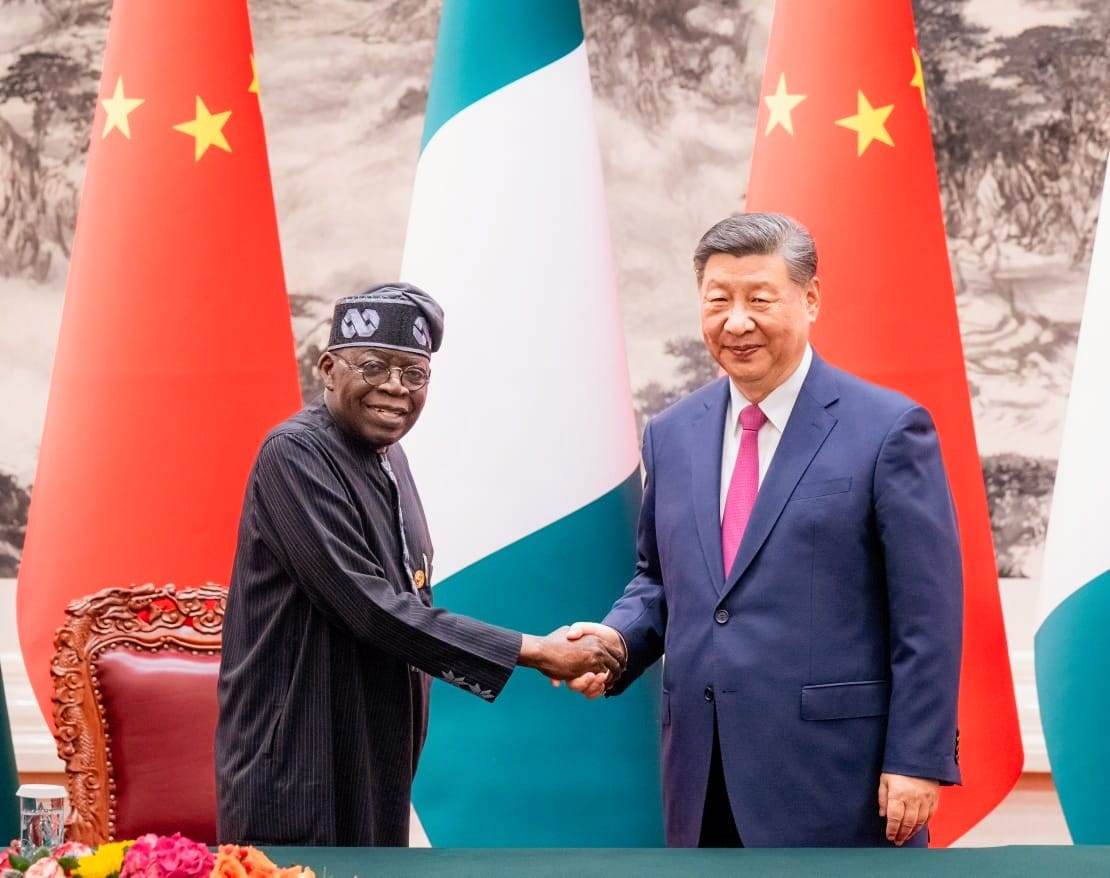
President of Nigeria Bola Ahmed Tinubu and President of China Xi Jinping - For illustrative purposes
🌐 What’s Moving It: Oil Flows and Policy Shifts
Oil and Cargo Dynamics
OPEC+’s 411,000 barrel-per-day output surge and Saudi Arabia’s 200,000 barrel increase drive VLCC and Suezmax cargoes, with Saudi Aramco targeting China’s market share. Nigeria’s 135,000 barrel-per-day U.S. crude imports and China’s shift to Saudi crude reshape global flows, while Venezuela’s 200,000 barrel-per-day U.S. export halt floods Atlantic markets. Sanctions on Iranian (27 tankers) and Venezuelan flows curb shadow fleets, boosting mainstream demand. BRS Shipbrokers sees Nigerian barrels replacing U.S. crude in China, favoring VLCCs over Suezmax—oil flows steer this market’s course.
Global Policy and Geopolitics
U.S.-China tariff negotiations (50-65% vs. 145%) and diluted port fees (3% of tanker voyages affected) lift market sentiment, with exemptions for ballast and sub-55,000 dwt vessels. U.S. sanctions on Jugwinder Brar’s fleet and Iranian facilitators (e.g., B and P Solutions) tighten tonnage, while U.S.-Iran talks and Houthi tensions add volatility. Braemar notes Chinese yards may lower prices (Suezmax slots at $51 million during COVID), enticing orders despite fees. Rerouting to Nigeria and Asia supports tankers—policy shifts and geopolitical risks shape the horizon.
🌐 Market and Stocks: Seizing the Rally
Stock Momentum
Shipping stocks surge 1.8% on tariff relief hopes, per the Dow Jones US Marine Transportation Index, with the SonicShares Global Shipping ETF $BOAT up 2.5%. Frontline $FRO (+2.95%) leaps 5.1% to $15.74, Himalaya Shipping $HSHP (+2.06%) tops at 7.7% ($4.90), and Golden Ocean $GOGL (+0.86%) gains 7.5% ($7.57). Tanker stocks align with broader gains, but Clarksons notes crude tanker valuations at 73% of NAV, implying VLCC rates below $40,000—undervalued given $57,400 daily earnings. Suezmax ($60,400 TCE) and Aframax ($61,100 TCE) strength fuels investor confidence.
Investor Perspectives
Jefferies forecasts VLCC rates surpassing $50,000 short-term, with OPEC+ hikes and sanctions driving 90% fleet utilization. Braemar predicts Chinese MR sales as fees target Chinese owners, but non-Chinese operators face minimal impact (9% of 2024 U.S. port calls affected). Fearnley Securities views tankers as insulated, with rerouting to Nigeria and Asia boosting yields. Clarksons sees $12-18 billion in annual fees by 2026-2028, but vessel redeployment mitigates costs—investors spot value in tankers’ resilience amid global shifts.
Sector Outlook
Eased port fees and tariff relief signal recovery, but Chinese retaliation (e.g., fees on U.S. ships) looms. Low orderbooks (3% growth) and aging fleets (10% over 20 years) foreshadow 2026 tightness. Stocks lag fundamentals, poised for gains if OPEC+ sustains output and sanctions persist. Tankers gleam as undervalued bets, with rerouting and tight tonnage promising upside—investors weigh near-term volatility against long-term potential.
attachment
For illustrative purposes
🌐 Outlook: Charting Future Tides
Market Projections
VLCCs range $55,000-$80,000 daily—OPEC+ hikes and sanctions fuel momentum—bullish. Suezmax at $54,000-$68,000—Atlantic volatility tempers gains—steady. Aframax at $46,000-$61,000—scarcity sustains strength—robust. Clean tankers diverge: LR1/LR2 at $20,000-$24,000, MR at $16,000-$20,000—East leads, West softens—mixed. Rerouting to Nigeria and Asia, coupled with tight tonnage, promises volatility—2026 looms as a peak if trade stabilizes.
Strategic Considerations
Tankers face a pivotal moment. VLCCs could dominate if OPEC+ accelerates output, but Suezmax risks softening if Atlantic supply builds. Aframax’s regional scarcity offers stability, while clean tankers’ new trades signal adaptability. Geopolitical risks—U.S.-Iran talks, Chinese retaliation—could spike rates, but decarbonization (e.g., Norden’s biofuel) hints at long-term shifts. Investors must balance tariff relief against sanction-driven tightness—strategic positioning will define winners.
Your Call
Will VLCCs lead the rally, or clean tankers’ new trades steal the spotlight? Share your take—let’s navigate the markets! 🚢
1 Year T/C - VLCC SUEZMAX AFRAMAX ECO / SCRUBBER - April 23th
*The Worldscale (WS) rate is a system used to calculate tanker freight rates, where WS 100 represents a standard base rate for a specific route. Rates above or below this benchmark indicate how much more or less a charterer will pay relative to the base cost. A higher WS rate means better earnings for shipowners, while a lower WS rate means lower transportation costs for charterers.
44
5 Comentarios
1Año
@Kundenservice Hello support team, it's the second post I am having trouble with recently.
When posting it I received an error saying " oops an error occurred " )(Firefox) , yet the post correctly went online, i received the points and it's displayed in the feed.
But when trying to performs edits (both on Firefox, Edge and the mobile app) I receive an error (on web, the window do not change at all, and on mobile I receive the classic error message).
Is something going on ?
Thanks guys !
•
11
•1Año·
🌍 Tanker Market Update Week 16 2025: Braving Sanctions, Tariffs, and New Trades
Mid-April 2025 finds the tanker market navigating turbulent waters. VLCCs grapple with softer forecasts amid trade wars, Suezmax and Aframax ride high on Atlantic scarcity, and clean tankers seize new routes from Argentina to Mexico. Sanctions choke Venezuelan flows, U.S. port fees loom, and shadow fleets bend under pressure. This is a sector steering through chaos with resilience—let’s dive into its journey.
⏬ VLCC Market: Holding the Line
Earnings Snapshot
The VLCC fleet, crude’s colossal carriers, faces headwinds as global demand forecasts falter. Baltic Exchange spot rates from Middle East-to-Asia hover at $36,500 per day, with Clarksons Securities slashing 2025-2026 projections to $50,000 per day (down from $70,000), citing trade war impacts. Eco-ships are projected to earn $53,000 daily, older units $46,000. DHT Holdings $DHT (-2,75 %) reports Q2 spot bookings at $48,700 per day (56% covered) and time-charter earnings at $45,100. A seven-year charter for DHT Appaloosa at $41,000 daily (plus profit-sharing) signals long-term faith, though tariff jitters keep sentiment cautious.
Supply and Demand Shifts
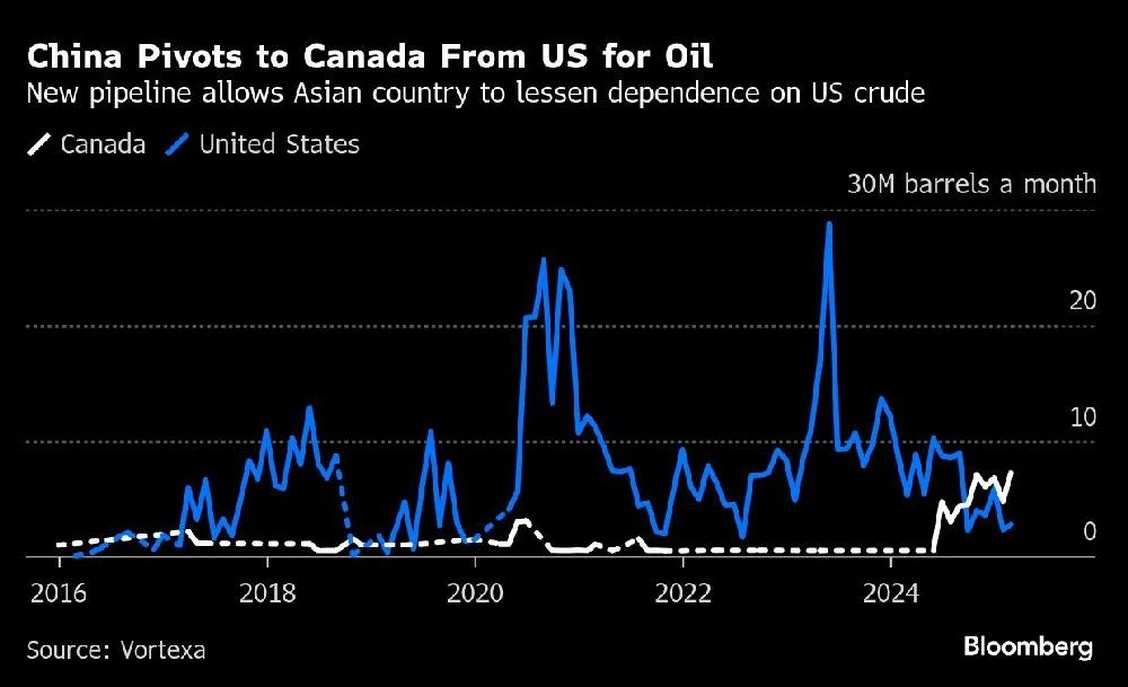
OPEC+’s output hike and Venezuela’s halted U.S. exports reshape flows. Venezuela’s 250,000 barrels per day to China (four VLCCs monthly) may lean on shadow fleets or transshipment hubs like Malaysia, per Braemar, limiting mainstream gains. However, Pakistan’s proposed 16 million barrel U.S. crude imports (eight VLCCs) and China’s 7.3 million barrel Canadian surge via Trans Mountain Pipeline offer long-haul promise. U.S. sanctions sideline Iranian shadow VLCCs (e.g., Bestla, Egret), potentially freeing 13 compliant ships for 500,000 barrels daily—Clarksons sees rates struggling below $45,000 without this shift.
Broader Impacts
The IEA’s 33% cut in 2025 oil demand growth (to 730,000 barrels per day) and OPEC’s 1.3 million barrel forecast dent confidence, with Brent crude at $61.57 per barrel pressuring shale output by 2026. U.S.-China tariffs (145% vs. 10% globally) and U.S. port fees ($18-$33 per net tonne by 2028) spark caution, though exemptions for ballast vessels ease fears. DHT’s sale of Chinese-built VLCCs Lotus and Peony for $103 million reflects strategic pivots—VLCCs hold steady, eyeing tighter fundamentals.
⏳ Suezmax Market: Atlantic Surge
Rate Climb
Suezmax tankers, mid-tier powerhouses, soar on Atlantic scarcity. Spot earnings top $50,000 per day, with Braemar noting firm markets as Venezuela’s export halt (200,000 barrels per day to the U.S.) floods the basin with available ships. Czechia’s shift to Transalpine Pipeline imports via Trieste (from Russian Druzhba) boosts Mediterranean demand for Norwegian and Azerbaijani crude. Rates for eco-Suezmax climb to $52,000 daily, up from $47,000 last week, driven by tight tonnage and rerouting.
Hot Zones
Venezuela’s suspension of Chevron’s $CVX (+2,03 %) cargoes (e.g., Dubai Attraction, Carina Voyager) leaves eight Aframaxes monthly seeking Atlantic trades, indirectly tightening Suezmax lists. Turkey’s Tupras resumes Russian Urals at $57 per barrel, with Kyklades’ Nissos Christiana delivering 730,000 barrels to Izmit. Pakistan’s potential U.S. crude imports (16 Suezmaxes equivalent) add upside. Mediterranean fixtures rise as Czechia’s 175,000 barrel-per-day refineries tap TAL—scarcity fuels this fiery ascent.
Trade Twists
U.S. sanctions on Iranian tankers (e.g., Reston, Nyantara) and Chinese refiners like Shandong Shengxing curb shadow fleet capacity, nudging mainstream demand. China’s pivot to Canadian crude (7.3 million barrels in March) stretches Pacific hauls, while Venezuela’s pivot to Asia via transshipment hubs like Singapore tests compliance. Tariff pauses (90 days for Pakistan) offer breathing room, but geopolitical heat keeps Suezmax on edge—resilient yet alert.
⏱️ Aframax Market: Atlantic Thunder
Rate Highlights
Aframax tankers, agile crude haulers, roar with spot earnings exceeding $50,000 per day. U.S. Gulf-to-UK Continent rates hit WS195, yielding $54,000 daily, while Mediterranean rates climb to WS180, netting $62,000. Venezuela’s export freeze floods the Atlantic with tonnage, yet redirected ships find work in Brazil-to-China ($18.74 per tonne) and Trieste-bound Czech flows. Baltic TCE rises to $50,500 per day (up $1,200 daily), with eco-Aframax at $53,000—Atlantic vigor prevails.
Tonnage Trends
Venezuela’s halt (six Aframaxes idled, including Pegasus Star, Ionic Anax) creates a surplus, but Braemar expects quick redeployment to non-sanctioned trades like Guyana-to-Europe. George Economou’s sale of eight Aframaxes (e.g., Monarch I, Saraswati) to Chinese buyers for Russian trades tightens compliant tonnage—six ships lift Urals from Primorsk in March. U.S. port fees exempt vessels under 55,000 dwt, sparing smaller Aframaxes—lists tighten as demand holds.
Sanctions Strain
Russian Urals at $57 per barrel (below G7’s $60 cap) draw Greek owners like Stealth Maritime (Suez Enchanted) to Primorsk, with G7-insured tankers up 36% in March. U.S. sanctions blacklist 140 shadow ships, squeezing Russia’s fleet—mainstream Aframaxes fill the gap, hauling to India and China. Czechia’s TAL shift and Tupras’ Russian pivot add cargoes—sanctions reshape routes, but Aframax thrives on Atlantic strength.
For illustrative purposes
⏸️ LR/MR/Handymax Market: New Horizons
Rate Rundown
Clean tankers sail divergent paths. LR2 MEG-to-Japan drops to WS125, netting $30,000 daily, while LR1 MEG-to-UK Continent falls to $2.9 million. MR Pacific rates slide to $19,500 per day (down 15%), but Atlantic MRs hold at $22,000. Torm’s $TRMD A (-2,76 %) MR Torm Singapore pioneers 300,000 barrels of ultra-low sulphur diesel from Mexico’s Dos Bocas refinery, and Tsakos’ $TNP (-4,45 %) LR1 Chantal and Selecao lift 1.47 million barrels of Argentine fuel oil to the U.S. Handymax Med TC6 jumps to WS195, yielding $25,000 daily—West shines, East fades.
Market Moods
New trades spark optimism. Argentina’s fuel oil exports hit 66,000 barrels per day in March (up from 7,000), driven by arbitrage to Houston and Honolulu. The UK-to-Colombia petrol route (Energy Ariadne, 41,000 tonnes) reopens after a year, fueled by Europe’s 350,000 barrel-per-day surplus. Mexico’s Olmeca refinery curbs U.S. clean imports, yet Dos Bocas exports lift MR demand. Eastern LR rates sag, but Western MRs and Handymax surge on tight supply—split seas define this market.
Outside Forces
U.S. port fees (71% of tanker orderbooks Chinese-built) prompt sales like DHT’s VLCCs, but exemptions for small vessels shield MRs. Tufton $SHPC Assets sees tankers benefiting from tariff-driven rerouting—South America’s petrol deficit and Europe’s surplus stretch tonne-miles. Sanctions on Iranian and Venezuelan flows push shadow trades to Asia, capping clean tanker gains—Western markets lead, buoyed by new routes.
The Petroleos Mexicanos Dos Bocas Refinery in Paraiso, Mexico - For illustrative purposes
🌐 What’s Moving It: Oil and Geopolitics
Oil and Supply
IEA’s 730,000 barrel-per-day demand growth (down 300,000) and OPEC’s 1.3 million forecast signal softer oil needs, with Brent at $61.57. Venezuela’s 680,000 barrel-per-day exports pivot to China (250,000 barrels), Pakistan eyes 16 million U.S. barrels, and Czechia’s TAL shift adds Mediterranean cargoes. Sanctions sideline shadow fleets (140 Russian, five Iranian tankers), lifting mainstream utilization—oil flows steer this market’s course.
Global Dynamics
U.S.-China tariffs (145%) and Venezuelan sanctions (25% on buyers) disrupt flows, though 90-day pauses offer relief. U.S. port fees ($18-$33 per net tonne) and Houthi strikes in Yemen add tension, but tankers outpace containers, per Tufton, via rerouting. George Economou’s ISAB refinery seeks new suppliers, signaling trade shifts—geopolitical storms test tanker resilience.
🌐 Market and Stocks: Value in the Vortex
Stock Swings
Tanker stocks rebound 13% week-on-week, per Clarksons, after a 13% tariff-driven drop. Frontline $FRO (-2,39 %) jumps 20% to $15.50, DHT $DHT (-2,75 %) rises to $10.71, but IEA’s demand cut trims gains—Frontline, DHT, and International Seaways $INSW (-1,62 %) dip 2%. Tufton’s $SHPC Q1 profit falls to $8 million (from $11.76 million), with a -10.4% NAV return as asset values slide. Clean tanker stocks like Scorpio $STNG (-1,83 %) (down 1%) and Torm $TRMD A (-2,76 %) (down 2%) hold firmer.
Investor Angles
Clarksons sees tanker equities at 73% of NAV for crude (58% for clean), implying VLCC rates below $40,000—undervalued with upside. Suezmax and Aframax earnings above $50,000 draw buyers, per Seaborne’s Eva Tzima, with IMS’ $26.3 million LR2 purchase signaling confidence. Tufton eyes rerouting benefits, while sanctions on shadow fleets could tighten markets—investors see value, but tariff risks linger.
Sector Outlook
Scaled-back port fees and tariff pauses lift sentiment, but Chinese tariffs threaten costs. Aging fleets (12% over 20 years) and low orderbooks (3% growth) hint at 2026 tightness. Stocks lag fundamentals, ripe for gains if trade stabilizes—tankers gleam as undervalued bets in the chaos.
For illustrative purposes
🌐 Outlook: Shifting Currents
Fluid Futures
VLCCs hover at $36,000-$50,000 daily—sanctions and new trades offer lift—steady. Suezmax at $50,000-$55,000—Atlantic scarcity powers on—robust. Aframax at $50,000-$62,000—Atlantic thunders—strong. Clean tankers split: LR at $25,000-$30,000, MR at $19,000-$22,000—West rises, East wanes—mixed. Rerouting and sanctions shape upside—2026 beckons if stability holds.
Your Call
Will Suezmax keep soaring, or clean tankers steal the show? Share your take—let’s chart the seas! 🚢
*The Worldscale (WS) rate is a system used to calculate tanker freight rates, where WS 100 represents a standard base rate for a specific route. Rates above or below this benchmark indicate how much more or less a charterer will pay relative to the base cost. A higher WS rate means better earnings for shipowners, while a lower WS rate means lower transportation costs for charterers.

44