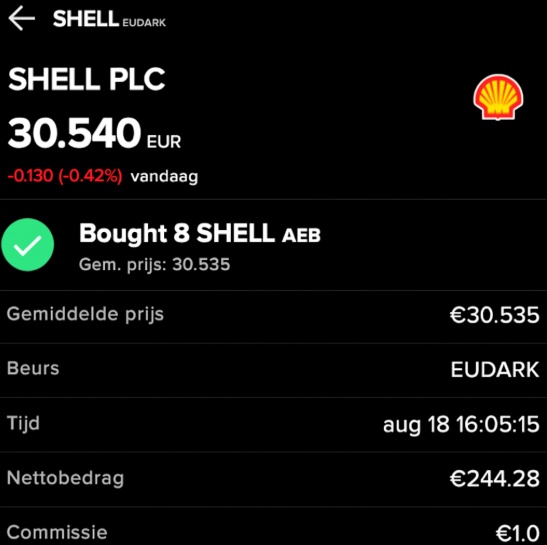
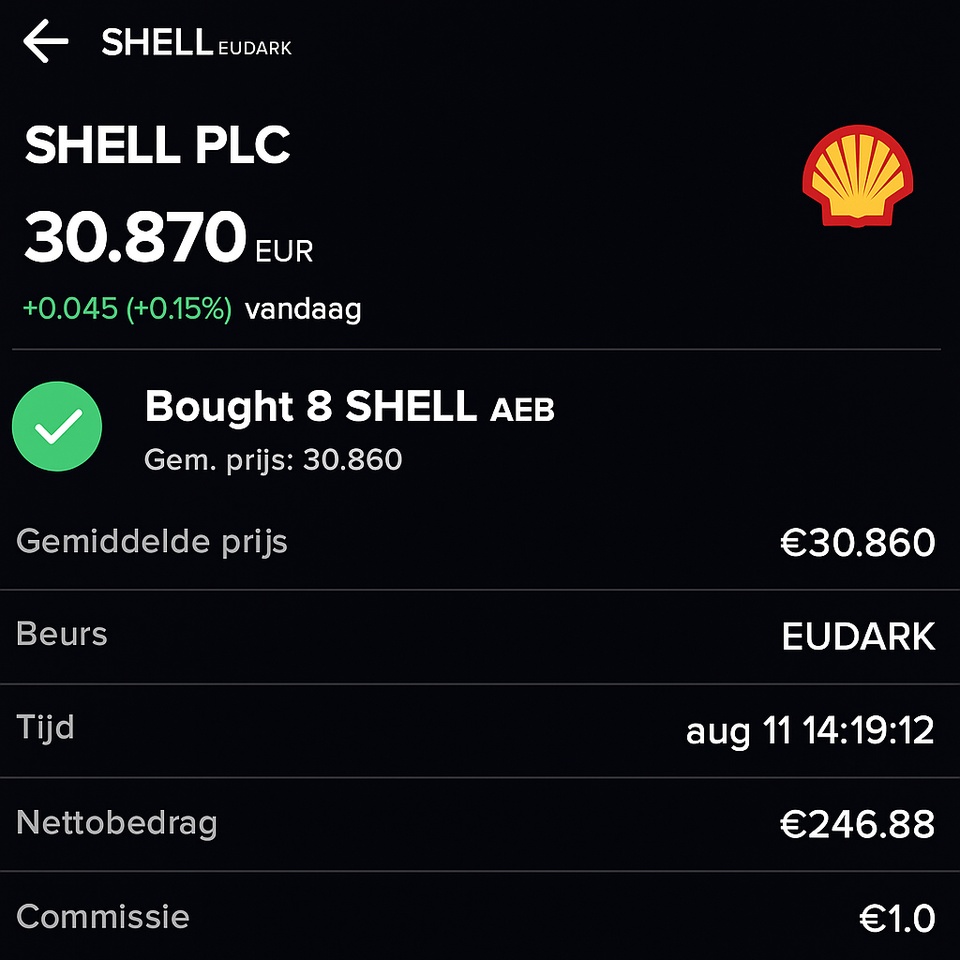
New weekly update with another purchase.
#dividend
#dividends
#etfs
#investing
$SHEL (-0.91%)
$BP. (-2.62%)
$XOM (-0.86%)
$CVX (-1.35%)
$TTE (-0.99%)
Posts
85New weekly update with another purchase.
#dividend
#dividends
#etfs
#investing
$SHEL (-0.91%)
$BP. (-2.62%)
$XOM (-0.86%)
$CVX (-1.35%)
$TTE (-0.99%)
I’m waiting for all the tariff movement to settle down before I reinvest in the new account, but these are the stocks I’m planning to put in the new account
I’m putting between $300 and $500 into each stock and I’m trying to get stocks from every sector
Would love to hear any feedback you have
1 Share of $MCD (-2.81%)
2 Shares of $AMZN (-4.95%)
1 Share of $MSFT (-3.93%)
2 Shares of $AAPL (-3.43%)
1 Share of $UNH (-0.46%)
3 Shares of $SPG (-2%)
4 Shares of $XOM (-0.86%)
11 Shares of $BAC (-3.6%)
1 Share of $LIN (-1.56%)
5 Shares of $SO (-0.04%)
5 Shares of $WMT (-1.46%)
2 Shares of $BA (-4.23%)
2 Shares of $GOOG (-5.69%)
And another record: in 2024, companies worldwide paid out dividends worth a total of 1.75 trillion dollars, which is 5.2% more than in the previous year.
The major US tech stocks, which previously paid out nothing at all for many years, played the leading role. Alone $META (-5.26%) Meta (Facebook ), Amazon $AMZN (-4.95%) and the Chinese online retailer Alibaba $BABA (-3.02%) were responsible for a fifth of the increase. And $MSFT (-3.93%) Microsoft once again paid the highest dividend worldwide at 22.90 billion dollars. In second place is $XOM (-0.86%) Exxon Mobil with 15.60 billion dollars and only just behind it $HSBA (-1.05%) HSBC with 15.40 billion dollars (see table).
Overall, the top group is heavily dominated by American and Chinese companies. Just under half of the increase comes from the financial sector.
Dividends are particularly important for investors who value current income. The key indicator here is the dividend yield, i.e. the payout in relation to the share price. A high percentage can be based on earnings strength and a shareholder-friendly corporate policy. However, very high dividend yields in particular are sometimes the result of falling share prices and therefore indicate a lack of confidence in the earnings power and therefore also in the medium and longer-term ability to continue to pay high dividends. Therefore, this figure alone can never be a good reason to buy.
Source (excerpt) & chart: Handelsblatt
ASML $ASML (-2.28%)
Intuit $INTU (-3.84%)
Adobe $ADBE (-3.45%)
Lockheed Martin $LMT (-1.74%)
Microsoft $MSFT (-3.93%)
Procter & Gamble $PG (-1.27%)
Hershey $HSY (-1.72%)
PepsiCo $PEP (-1.55%)
Advanced Micro Devices $AMD (-4.24%)
Diageo $DGE (+0.32%)
Exxon Mobil $XOM (-0.86%)
Canadian National Railway $CNR (-2.53%)
Merck & Co. $MRK (+0.74%)
Lam Research $LRCX (-3.99%)
Novo Nordisk $NOVO B (-3.33%)
Nike $NKE (-4.96%)
Dollar General $DG (-3.16%)
Estee Lauder $EL (-2.93%)
Restaurant Brands International $QSR (-6.49%)
Mondelez $MDLZ (+0.75%)
Schlägst du zu? Falls ja, wo?
Last week, Saturday's episode of "All About Stocks" [1] featured an excerpt from the study "Do Stocks Outperform Treasury Bills?" [2], which sounded quite interesting and the contents of which I subsequently read again in more detail.
The essence of the study is that only a small proportion of companies are responsible for the majority of returns.
It therefore serves as a reminder that it is probably the best choice for the "average investor" to invest in a well-diversified ETF.
Here is a brief presentation of the results.
Hendrik Bessembinder from the W.P. Carey School of Business at Arizona State University has investigated which stocks really drive the market in the long term.
According to the study, since 1926 only 4% of all stocks have generated the total net profit of the US stock market [2].
The other 96% of stocks in total have only generated as much return as safe one-month US government bonds or even less [2]. The average monthly return here was 0.37% (which is roughly equivalent to an annual return of 4.53% when compound interest is taken into account).
Almost more interesting is the following:
The top 50 companies were responsible for 39.29% of the total value creation of the US stock market and.
... the top 90 stocks (only 0.36% of all companies) even generated more than 50% of the total market profit [2].
The 4% mentioned still represent just under 1,092 of over 25,000 companies. It doesn't seem so unrealistic to find them.
The only problem is:
The best stocks are usually only recognized in retrospect
Even professionals often fail
Timing is often extremely difficult
More than half of all stocks have even generated negative returns over their entire lifetime [2].
That means: The average stock return we all know is not generated by the "broad" market, but only by these 4% of stocks.
Further results of the study:
Value creation on the stock market is extremely unevenly distributed.
The question now for us as investors is:
Do I really think I can buy these 4% winning stocks early can find them early?
... and at the same time can I at least stay away from the biggest losers from the remaining 96%?
... or do I prefer to stick with John Bogle the founder of Vanguard, who gave the following famous quote:
🧠 "Don't try to find the needle in the haystack. Just buy the whole haystack."
The haystack is in that sense an ETF:
Conclusion
Yes, it is theoretically possible to find the 4% yourself, to time it correctly and to hold it, as well as to stay away from the biggest losers of the 96% in the long term.
The question is: do you want to bet your portfolio on it, or would you rather make sure you automatically profit from the 4%.
💡For most investors, a simple ETF investment as a "core" is therefore probably the best choice.
Thank you for reading 🤝
__________
P.S. The study was published in 2017 and last revised in 2018.
With regard to a more recent analysis, which refers specifically to the last few years, the study does not contain separate results for shorter periods. However, it does mention that this effect has been even more pronounced in recent decades, particularly since the 1980s. To get a detailed current analysis, one would have to search more recent research.
__________
Source:
[1] https://open.spotify.com/episode/7ik1W0e9zq7TBYacPW0eVl?si=Sw2Mu0XSSH2SQFp5cHtpLQ
[2]
published 01/2017, revised 06/2018
https://papers.ssrn.com/sol3/papers.cfm?abstract_id=2900447&utm_source=chatgpt.com
- Oil
- gas
- EU emissions trading
- Copper
- Aluminum
- Gold
- Silver
Link: https://shorturl.at/5VrEF
#gold
#silber
#öl
#oiel
#kupfer
#aluminium
#metall
#edelmetalle
$SHEL (-0.91%)
$TTE (-0.99%)
$ABX (-2.76%)
$GLDA (+0.57%)
$GOLD (-2%)
$LNVA
$GOLD
$DE000EWG0LD1 (+0.77%)
$B7GN
$PAAS (-2.54%)
$PHAG (-1.24%)
$SLV (-1.07%)
$1BRN
$IOIL00 (-1.24%)
$WTI
$WTI
$CVX (-1.35%)
$XOM (-0.86%)
$OXYP34
$ALEX
$OD7A
$ALUM (-0.71%)
$COPA (-0.24%)
$OD7C
$SCCO (-3.31%)
$GLEN (-1.98%)
$RIO (-2.41%)
$RIO (+0.19%)
$RIO (-2.59%)
In the following post, I would like to discuss the new US tariffs and their potential economic consequences. The background and the potential impact on inflation and companies, as well as the winners and losers on the stock market, will be discussed.
Again, of course, the stocks mentioned do not constitute investment advice, but merely serve as examples of possible beneficiaries or losers of tightening trade restrictions. Historical developments are no guarantee of future returns.
__________
In this post:
__________
The topic of "tariffs" is currently not only very present in the media, but the term "tariffs" has also been discussed with a strong increase in the past earnings calls of companies in the S&P 500, as the following chart shows [1].
The chart shows that the discussion about tariffs has intensified in recent months and is having an ever greater impact on the outlook in companies' annual reports.
The data is presented as a three-month average and broken down into various sectors, including e.g. industry, healthcare, consumer goods, information technology, etc.
I am curious to see how the stock markets will behave in the coming week. In addition to the current reporting season, the topic of "tariffs" will certainly dominate.
After the tough tariffs announced after Trump took office were not immediately enforced and there was a "slight" sigh of relief, there could now be a new reaction on the markets, as there was on Friday evening. slightly was already slightly noticeable on Friday evening when the markets turned towards the evening.
A looming trade conflict could not only affect individual companies, but also further fuel inflation in the US:
💰 Influence on inflation
On January 31, Deutsche Bank published a forecast on the potential impact of tariffs on the inflation rate [2]:
The chart compares the current forecast with the forecast before the "Trump" era and takes into account various scenarios for the passing on of tariffs (pass-through) by Canada and Mexico.
Two scenarios are considered: one with a 50% pass-through of tariffs (additional increase shown in dark green) and one with a 75% pass-through (light green). It is clear that the inflation rate could rise sharply again this year and fall again by 2027.
🛃 New tariffs in force & further measures planned
As of today, February 1, 2025, the US government and Donald Trump have imposed new import tariffs on Mexico, Canada and China:
According to the White House spokesperson, these measures are, among other things, a response to the failure of these countries to stop the influx of fentanyl and illegal immigrants into the USA. [3]
But this is just the beginning:
From mid-February, the USA will also impose tariffs on strategic goods [4], including:
🚨 Trump relies on escalation - Canada announces retaliation
Yesterday, Canadian government representatives, including Foreign Minister Mélanie Joly, tried to prevent the tariffs in Washington, but to no avail.
Trump made it clear before his departure to Mar-a-Lago [5]:
"We have a 200 billion dollar trade deficit with Canada. Why should we subsidize Canada?"
The EU could also soon be targeted, as Trump hinted:
"Absolutely! The European Union has treated us so terribly!"
🔄 Canada's reaction:
Prime Minister Justin Trudeau announced that Canada will not back down and will respond with "swift and robust countermeasures".
The government is planning a three-stage retaliation strategy [5]:
However, this last step in particular would be a double-edged sword, as Canada is heavily dependent on energy cooperation with the USA.
Economic experts in the US are already warning of the consequences of a trade war [5]:
But Trump remains firm:
"Maybe there will be short-term disruption, but in the long run the tariffs will make us very rich and very strong."
🌎 Possible consequences for the global economy
(a) Rising prices in the USA
(b) Retaliation & new trade wars?
(c) Effects on the stock market
🏆 Winners & losers - which companies will benefit, which will suffer?
Possible beneficiaries of the tariffs
US manufacturers of steel, aluminum & copper
Domestic pharmaceutical and biotech companies
Energy companies with US production
Chip manufacturers with US production
😥 Companies that could suffer from the tariffs
Chip manufacturers with global supply chains
Car manufacturers with global suppliers
Companies with strong export business
US retailers with a high import share
🧠 Possible investment strategies
Favor defensive sectors:
Exploit long-term opportunities in "reshoring":
Conclusion: Will the trade conflict escalate further?
With the new tariffs, Trump is taking a confrontational stance and Canada, Mexico and China are preparing for retaliatory measures. If further tariffs on European goods follow, the situation could worsen.
❓Which stocks do you think could be most affected? Which beneficiaries do you see?
Thanks for reading! 🤝
__________
Sources:
[4]
[5] https://www.tagesschau.de/ausland/amerika/usa-trump-strafzoelle-100.html
The No. 1 US oil producer reported a total profit of 33.46 billion dollars for the full year 2024, down from 38.57 billion dollars in the previous year.
After completing the acquisition of Pioneer Natural Resources in May, the company became the largest oil producer in the Permian Basin in 2024, the largest oil field in the US.
Profit for the fourth quarter amounted to 7.39 billion dollars.
Earnings per share amounted to 1.67 dollars, exceeding analysts' estimates of 1.56 dollars.
Exxon's low production costs in the Permian Basin and its lucrative and prolific projects in Guyana have supported the company's profits despite lower oil prices (link) and a drop in profits from fuel production.
The company had said earlier this month that the sharp fall in oil refining margins (link) would mean a drop in profits of USD 300 million to USD 700 million compared to the third quarter.
The start-up of new oil refineries by other companies in Asia and Africa led to higher global fuel supply, even though demand for gasoline and diesel fell short of expectations.
The refining business remains under pressure as the additional supply comes to market, Exxon Chief Financial Officer Kathryn Mikells said in an interview.
"That's what we're really watching as we look ahead to 2025," she said.
The company had previously stated that impairment charges would cost around 600 million dollars in the fourth quarter. The costs stem from the sale of non-strategic assets, including a joint venture in Nigeria , Mikells said.
The largest U.S. oil producer still expects a decision by September in its arbitration case against Chevron's takeover of oil producer Hess, she said. If Chevron goes through with the takeover, the company would gain a foothold in oil projects in Guyana.
While the deal has been approved by U.S. regulators, Exxon and CNOOC, Hess' partners in the Guyana oil joint venture, claim they have a contractual right of first refusal to buy Hess' stake.
Returns to shareholders through buybacks and dividends totaled 36 billion dollars in 2024, compared to 32 billion dollars in the previous year. Distributions to shareholders, a cornerstone of Big Oil's strategy to woo investors, were covered by Exxon's free cash flow of $36.2 billion.
🔹 Adj. EPS: $1.67 (Est. $1.55) 🟢; DOWN -14.3% YoY
🔹 Revenue: $83.43B (Est. $83.71B) 🟡; DOWN -5.5% YoY
🔹 Net Income: $7.6B (Est. $6.85B) 🟢; DOWN -19% YoY
🔹 Operating Cash Flow (CFFO): $12.2B (Est. $13.58B) 🔴; DOWN -30.5% YoY
🔹 Free Cash Flow (FCF): $8.0B (Est. $6.28B) 🟢; DOWN -28.3% YoY
🔹 Capital & Exploration Expenditures: $7.5B (Est. $6.44B) 🔴; UP +5% YoY
Segment Performance:
🔹 Upstream Earnings: $6.5B (Est. $3.78B) 🟢; UP +6% YoY
🔹 U.S. Upstream Earnings: $1.26B (Est. $1.82B) 🔴
🔹 International Upstream Earnings: $5.24B (Est. $4.40B) 🟢
🔹 Energy Products Earnings: $402M (Est. Not Provided); DOWN -70% YoY
🔹 Chemical Products Earnings: $120M (Est. $430.5M) 🔴; DOWN -87% YoY
🔹 Specialty Products Earnings: $746M (Est. Not Provided); DOWN -6% YoY
Production & Operational Metrics:
🔹 Total Production: 4,602K BOE/d (UP +16% YoY) 🟢
🔹 Permian Basin Production: Record levels 🟢
🔹 Guyana Production: Record levels 🟢
🔹 U.S. Oil Production: 1,256K BOE/d
🔹 International Oil Production: 5,242K BOE/d
🔹 Total Gas Production: 8,024 MMCF/d
Financial & Capital Allocation:
🔹 Dividend Increase: +4% to $0.99/share, payable March 10, 2025
🔹 Share Buybacks: $19.3B in FY24; Extended $20B annual buyback through 2026
🔹 Return on Capital Employed (ROCE): 12.7% (Industry Leader) 🟢
🔹 Debt-to-Capital Ratio: 13%
FY25 Guidance & Strategic Updates:
🔹 Upstream Growth: Plans to expand production in Guyana & Permian Basin
🔹 Capex Guidance: $27B-$30B (Focus on low-cost production & structural cost savings)
🔹 Structural Cost Savings Target: $18B by 2030 (Achieved $12.1B since 2019)
🔹 Asset Divestments: Raised $5.0B in 2024 from asset sales
Hello everyone 🤘🏻👨🏻💻,
I have recently realized that my portfolio is not sufficiently focused on dividend stocks. I would therefore like to change this now and look forward to your recommendations! 📈💰
I currently have a few stocks on my watchlist that I'm taking a closer look at:
I'm also looking a little more closely at oil stocks at the moment, as "Drill, baby, drill" ~ Donald Trump is back in vogue.👆🏻
Which dividend stocks do you have in your portfolio or on your watchlist? I am curious! 🤘🏻🤓