APA Group Units
Stock
Stock
ISIN: AU000000APA1
Ticker: APA
AU000000APA1
APA
Price
Price
CHART BY
Frequently asked questions
What is APA Group Units's market capitalization?
The market capitalization of APA Group Units is 10.56B. Market capitalization is a measure of the total market value of a publicly traded company. It is calculated by multiplying the current stock price by the total number of outstanding shares.
What is APA Group Units's Price-to-Earnings (P/E) ratio?
The Price-to-Earnings (P/E) ratio (TTM) for APA Group Units is 74.34. This ratio helps investors assess whether a stock is overvalued or undervalued compared to its earnings.
What is the free float of APA Group Units's shares?
The free float of APA Group Units is 1.32B. Free float refers to the number of shares available for public trading, excluding restricted shares.
Financials
- Market Cap
- 10.56B
- Free Float
- 1.32B
- P/E ratio (TTM)
- 74.34
Pricing
- 1D span
- $7.932$8.076
- 52W span
- $5.659$8.087
Information
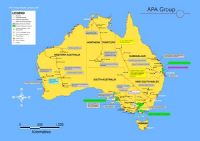
APA Group engages in the business of owning, managing, and operating diverse portfolios of gas, electricity, solar, and wind assets. It operates through the following segments: Energy Infrastructure, Asset Management, Energy Investments, and Other. The Energy Infrastructure segment includes infrastructure assets across gas transmission, compression, processing, storage and electricity generation, and transmission. The Asset Management segment provides asset management and operating services for third parties and the majority of energy investments. The Energy Investments segment focuses on energy infrastructure investments. The company was founded in June 2000 and is headquartered in Sydney, Australia.
- Industries
- Gas Distributors
- Sector
- Energy
Identifier
- ISIN
- AU000000APA1
- Primary Ticker
- APA
Knockouts
Real-time data from LSX · Fundamentals & EOD data from FactSet