
On social media, people often calculate how rich you could be in the future if you simply invested in the stock market for 30 years. Often 10-12% p.a. is then calculated. The comments then discuss how realistic this return is, and usually (especially on American channels) it is argued that this is the historical average of the S&P500. This argument has always bothered me because, for one thing, inflation is not taken into account in this calculation. On the other hand, the country index that has performed particularly well in the past is used. However, there is no guarantee that this will also be the case in the coming decades. What bothered me the most, however, was the fact that it was always pretended that future returns were already set in stone. As if it were a given that you could retire a millionaire if you simply invested €200 per month over 40 years. However, this completely disregards the risk of subsequent returns, for example. And because I wanted a more realistic picture of this, I simulated the stock market 20,000 times and I'm now going to share the results with you:
Note 1:
I do not guarantee that the results are correct. Errors may have crept in, and (for me at least) it is not entirely clear whether a simulation that only takes the CAGR and standard deviation into account really reflects reality. Furthermore, the calculation was based on an annual savings plan, which would perform somewhat worse than a monthly one.
Note 2 (To better categorize whether this can be):
As a little check, I asked ChatGPT if he could calculate for me the probability interval (10% to 90%) for the expected return for a 20 year investment period. His results were slightly (0.7% and 1.1% respectively) higher than mine. When asked about the difference from my simulation results, he said that the difference was due to the volatility drag, which he had not taken into account in his normal distribution estimate, and therefore the simulation was the more accurate result. Furthermore, ChatGPT (I believe) calculated with a one-time investment, which naturally leads to slightly higher returns.
Regarding the assumptions:
- Annual savings plan, without initial capital
- CAGR (compound annual growth rate) = 10.19% p.a.
- Constant inflation of 3.28% (results in a real return of 6.91%)
- Annual increase in the savings amount by inflation
- A standard deviation of 14.8%
The data comes from the MSCI World since 1979 [1]
In the end, inflation would be subtracted from the return to get the real return.
Results:
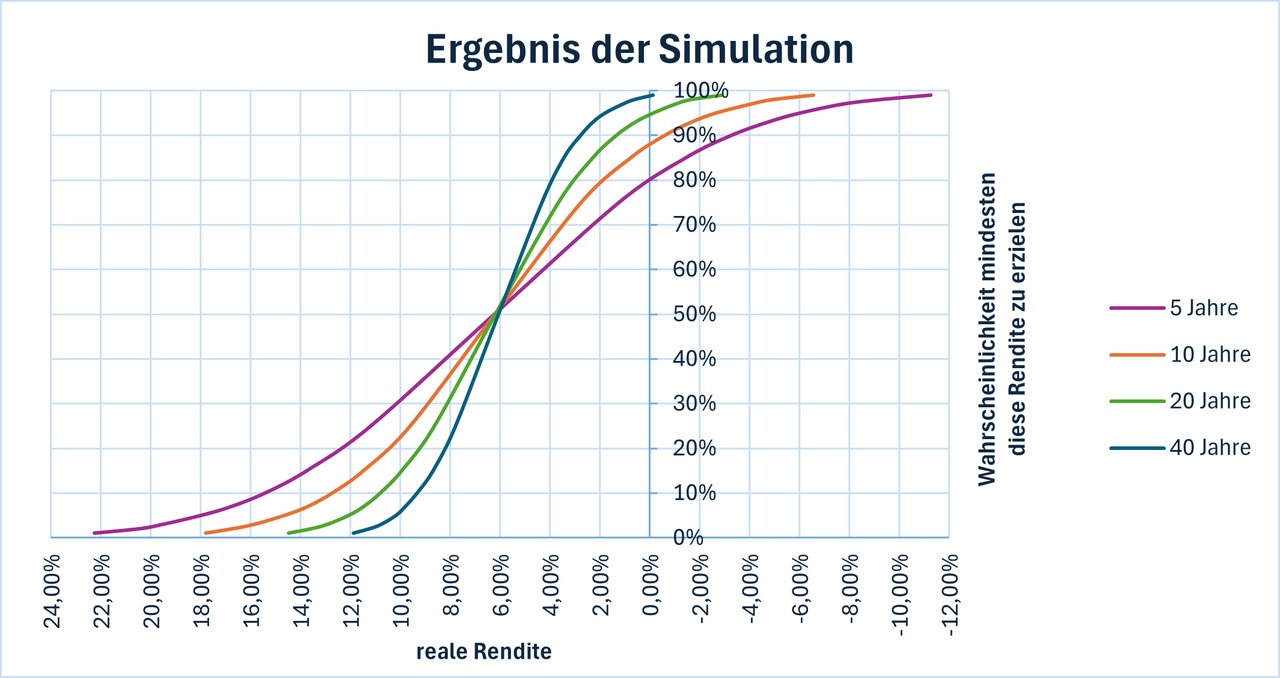
Here, for example, you can see that after 5 years there is an 80% probability that you will be in the black in real terms (i.e. after inflation). The median is between 6.0% and 6.2% p.a. in each case. This is slightly less than the 6.91% (CAGR), which was to be expected as the distribution is asymmetrical. ChatGPT calculated that with a CAGR of 6.91% and 14.8%, the median should be around 5.81%, which roughly matches my results.
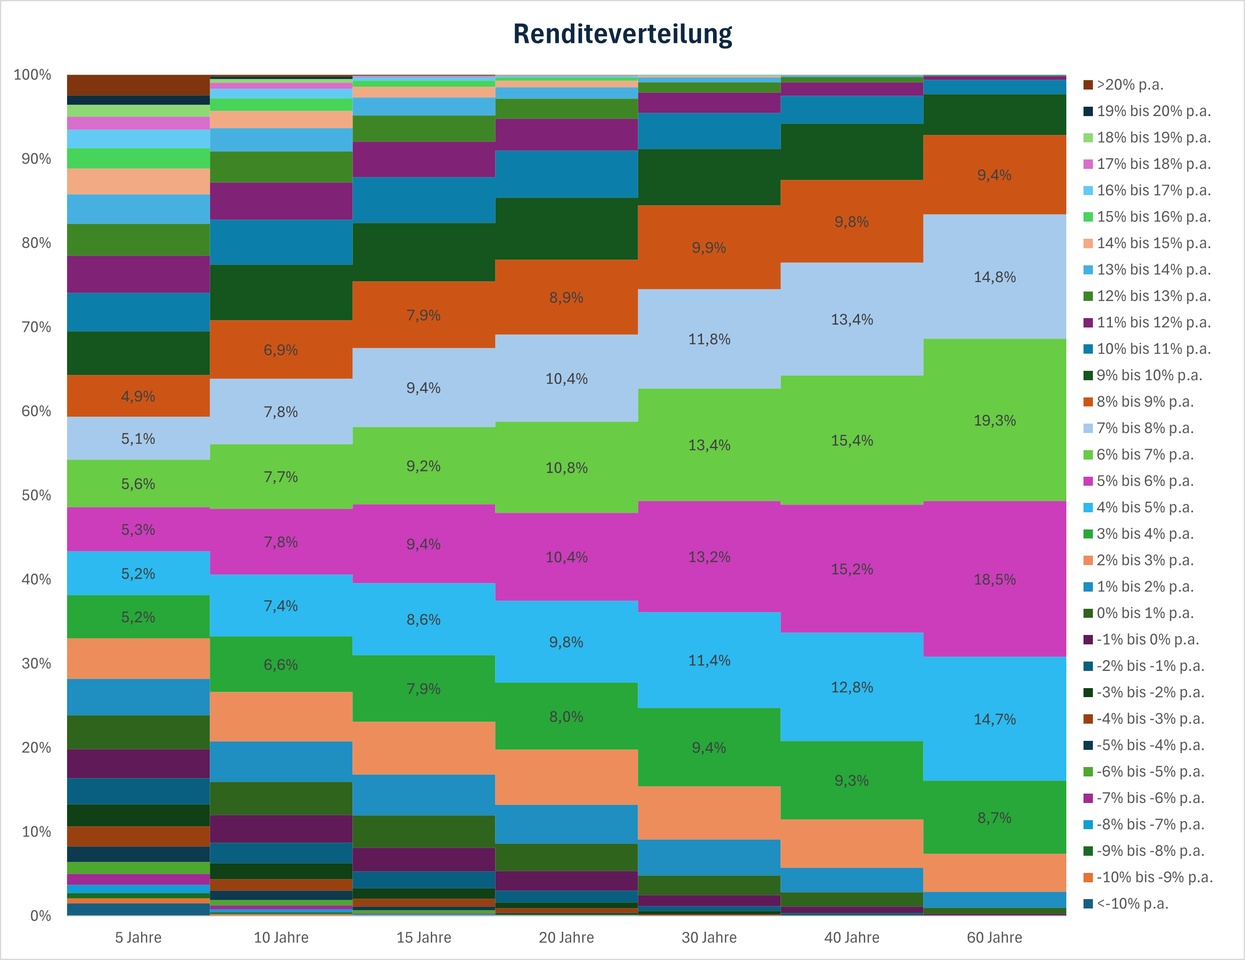
In the second chart, you can see the probabilities a little better. For example, the probability that the return will be between 4% and 8% p.a. is 50% for an investment period of 30 years.
The probability of not even achieving a return of 4% p.a. after 40 years is still around 20%.
Conclusion:
To avoid being disappointed in the future, you should expect somewhat more conservative returns, as the probability of poor returns over a long investment horizon is higher than most people assume.
Data source [1]:
https://curvo.eu/backtest/de/portfolio/iwda--NoIgkg6gIggiA0xRgKIAY0CEAsAZArAJoCcAHAMwICMAunUA


