
After I @Epi post (https://getqu.in/kIkZh6/) about 2xSPYTIPS and was looking for strategy diversification anyway, I put a small percentage into this strategy. Now I would like to invest more, but it doesn't look very robust to me. That's why I've tried a lot and would like to present my results to you.
I already wrote a similar post 3 months ago, but I will go into much more depth here and at the end there will also be a strategy.
What is it all about?
The mentioned trend following strategy of @Epi includes two indices and their moving averages: S&P 500 (e.g. $SPY (+0.21%) ) and TIPS ($TIP (+0.15%) ). The idea is based on the momentum factor. In simple terms:
Markets move in cycles and you want to be in on the upside, but not on the downside. Trends often continue and the strategy tries to follow them well. As soon as a trend reversal occurs, you reallocate (between cash and the investment).
This prevents you from taking deep drawdowns (losses from the last high).
This significantly reduces the risk (which is only defined here as the maximum drawdown). @Epi The S&P 500 (hereinafter referred to as "SPY") suggests going leveraged (2x) in the event of a buy signal.
Starting position (abstract 2xSPYTIPS):
"Invest in the 2xSPY if the SPY and TIPS close above their SMA (simple moving average) at the end of the month, otherwise hold cash"
The SMA value was suggested by @Epi as 200 as it is a good and round value. However, 150 seemed to work better, which is why I use the strategy with 150 SMA as a starting point. I also use daily data from 2003 (and not monthly data from @Epi monthly data from 2000), as I only have data for the TIPS from 2003 onwards.
An additional assumption is that "cash" does not yield interest. The SPY index used is the S&P 500 Total Return Index, which includes dividends.
Furthermore, I assumed that the end of the month is nothing special and that the strategy could always be executed on the 15th, for example. The abstract version is the following: "Check the signal every n trading days and act accordingly". A month has approx. 21 trading days (approx. 251 / 12). Now you just have to define a start day. There are 21 possibilities for this (except for isomorphism).
Example 1: Start day 5 -> check signal on trading day 5, 26, 47, 68, etc.
Example 2: Start day 17 -> check signal on trading day 17, 38, 59, 80, etc.
What if you test all 21 possible start days?
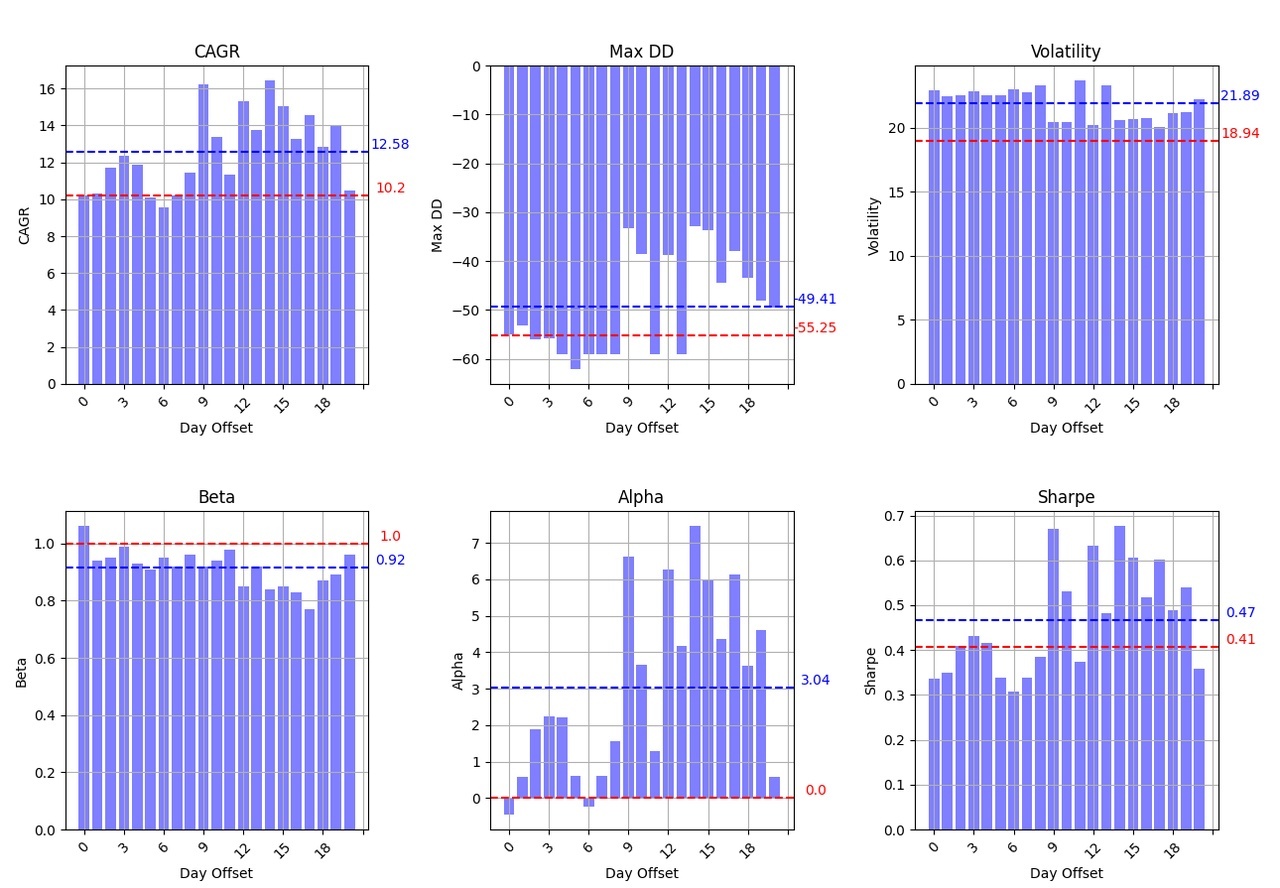
This is the data from December 2003 to May 2025. The metrics tested are:
- CAGR: annual percentage return
- Max DD: maximum drop from the last high
- Volatility: measure of the average daily fluctuation
- Beta: complicated volatility, puts fluctuations in relation to a benchmark, ignores outliers (1 = fluctuates the same as benchmark, 2 = twice as strong fluctuations)
- Alpha: annual risk-adjusted excess return compared to a benchmark in percent, uses beta for risk adjustment
- Sharpe: simple measure for risk-adjusted excess return, uses volatility, meaningless without comparison
The benchmark is of course the SPY and the red lines show how the SPY performs. The blue lines are average values over all possible starting days.
@Epi indicates 16.2% CAGR with approx. -20% (monthly) drawdown. The minimum (daily) drawdown here is greater than -30% while the average is a miserable -50%. The 16.2% CAGR is also rather best case.
After seeing this, it was clear to me that I would not continue with this strategy. But what now?
Problems and solutions for 2xSPYTIPS
The main problem is that the strategy often reacts too slowly during periods of weakness. Especially during the Covidcrash, it can take a whole month to react.
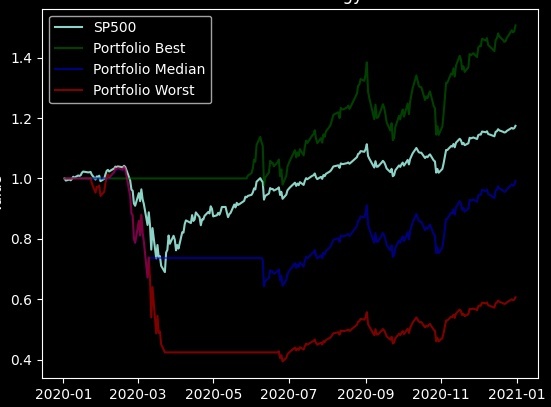
Here we also see the 60% drawdown. The month-end strategy was pretty close to the best case and thus the strategy seemed good.
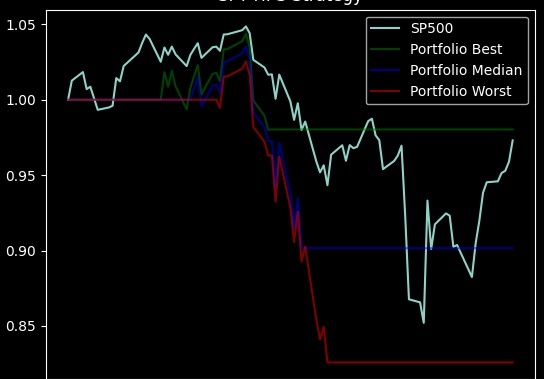
This is the strategy this year. You can also see huge differences here.
Often you are also late to the top.
Various modifications have been suggested here in the forum. For example, weekly or daily execution. However, this leads to the "problem" that many more trades are created and eat up fees (and effort). Especially when a price swings around the SMA. One way to tackle this problem is to add hysteresis (a two point switching system) where you buy when the price is e.g. 1% above SMA and sell when the price is 1% below SMA. This only solves the problem for small fluctuations and introduces additional complexity. I have opted for a cooldown approach. This involves waiting at least k days after each trade before trading again.
First interim result
2xSPYTIPS is not robust. Nevertheless, the idea of using the TIPS and SPY indicator seems interesting. My modified strategy is as follows:
"Buy a 2xlev SPY when TIPS and SPY price are above their SMA at the end of a period of n days, as long as the last trade is at least k days away. Switch to cash if TIPS or SPY are below their SMA at the end of a period of n days, as long as the last trade is at least k days away."
Now there are 3 parameters that can be optimized:
- n - the investment interval in days (for 2xSPYTIPS this was approx. 21)
- k - the number of cooldown days after a trade (for 2xSPYTIPS 0)
- the value of the SMA (for 2xSPYTIPS 200 or 150 depending on the variant)
In the following simulations, I always looked at the minimum alpha and the maximum drawdown over all possible start days. Quasi as performance and risk metrics.
First simulations
First, I realized that n should probably be 1. The following is just one of many simulations that confirm this assumption. It also makes sense, as this is the quickest way to react to signal changes.
As I said, there were many other tests that led to this result, which is why I set n to 1 for the other simulations.
This means that if there is currently no cooldown, action is taken immediately when the signal changes. I have now been able to test one more parameter: SPY and TIPS SMA are now two parameters.
I was able to recognize an interesting pattern for TIPS:
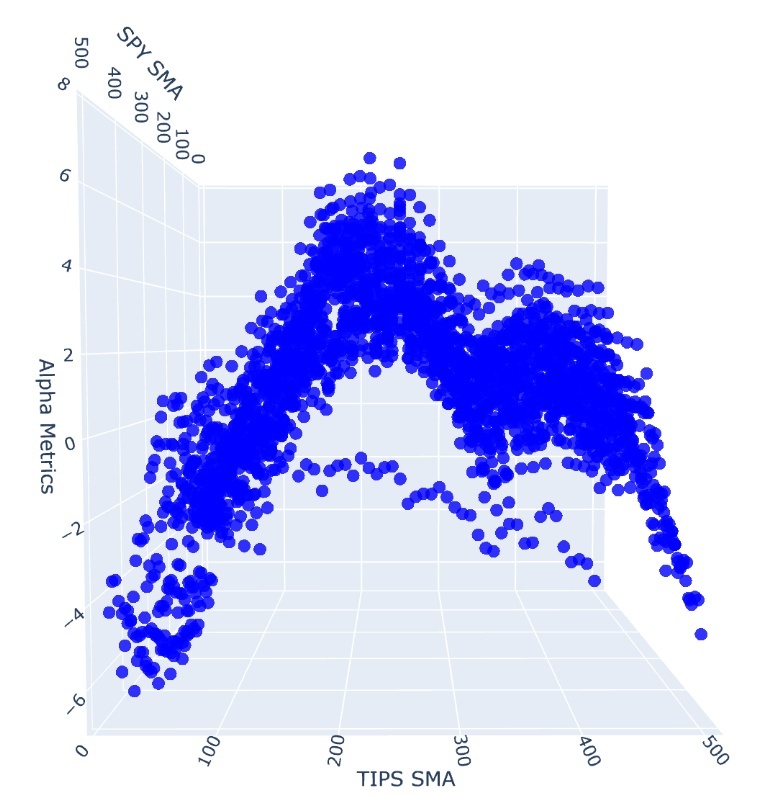
There seems to be a general sweet spot here between 200 and 250 SMA. There was no such clear picture for SPY SMA. This seems to confirm once again that the TIPS indicator is extremely important for performance.
There were also two sweet spots for the cooldown days: at around 10 and around 50
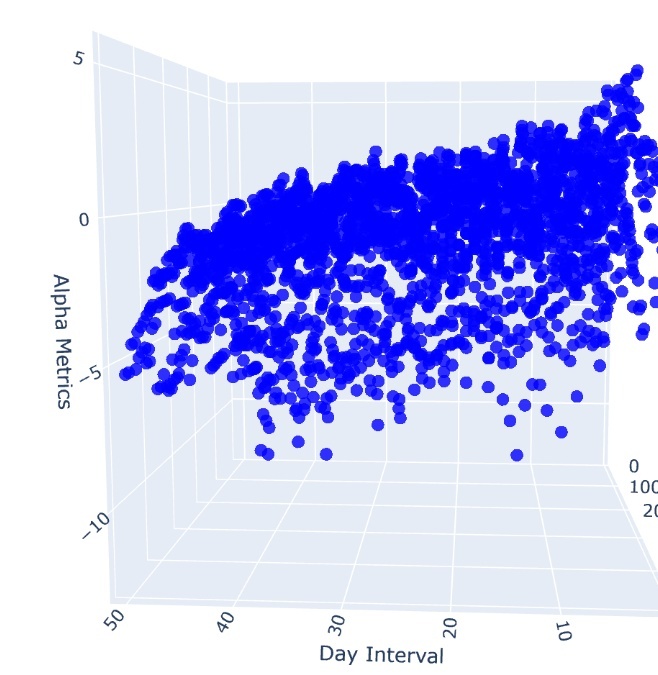
Below you can see the final scatter simulation. The 3 parameters on the axes. The color represents the alpha value of the strategy. Purple is the weakest and yellow is the best. It should be noted that purple is also a top strategy, as the poor strategies are already hidden here.
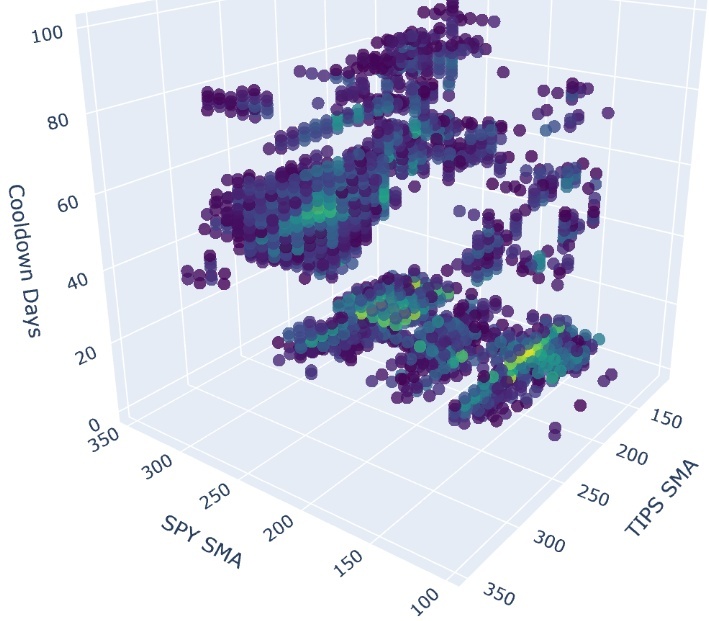
There are 3 clusters (of seemingly good strategies):
- approx. 150 SPY SMA, 200 TIPS SMA, 10 cooldown days
- approx. 270 SPY SMA, 200 TIPS SMA, 10 cooldown days
- approx. 270 SPY SMA, 250 TIPS SMA, 50 cooldown days
It is also important to mention that these are not individual outliers, but compact clusters with similar parameters, which represent a similarly good strategy. It can therefore be assumed that the general strategy is reasonably consistent and that a point in the middle of a lump represents a relatively robust strategy.
However, various robustness tests follow, which some strategies do not pass...
Robustness?
After this step (and a few other simulations), I picked out 12 strategies that are surrounded by other good strategies as far as possible.
The first small robustness test was a simulation of the strategies, not only from 2003-2023, as before, but from 2003-2013 and 2013-2023.
This means that the range is not just divided into two 10-year periods. In particular, the 2008 financial crisis and the 2020 Covidcrash were separated. The strategies had to show a positive alpha in both phases. 3 failed to do so, leaving 9.
Monte Carlo is Formula 1, isn't it?
It is important to avoid overfitting in order to ensure robustness. But how do you test for overfitting? This is where the Monte Carlo permutation test comes into play.
The basic idea is that the price trend of the indicator (or indicators) is "diced" anew. The daily percentage changes are randomly rearranged. The result is a permutation whose statistical properties (performance, risk, variance, etc.) correspond almost exactly to the original indicator.
Here is an example of such permutations:
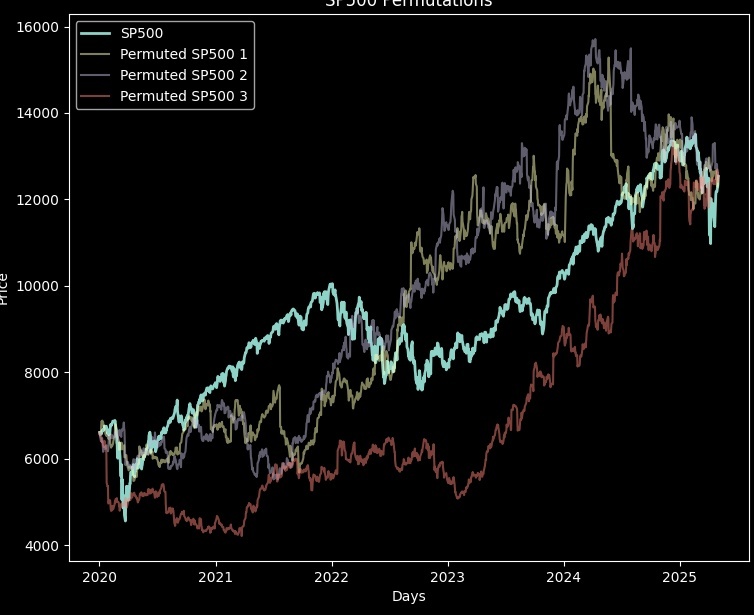
Same start, same end, different progression.
The optimization is then carried out on the new course. The best parameters for the permutation process are searched for, so to speak. If the strategy found generates a higher alpha with the same or lower drawdown, then it is considered better. Otherwise it is worse.
A strategy is robust if optimized random permutations perform worse than the optimization on the original data. This proves that the strategy is really finding patterns in the data and not just learning the data. I tested over 1000 permutations between 2003-2023 and calculated a p-value for each of the 9 strategies (indicates how large the proportion of better strategies was). This should therefore be as low as possible (>0.1 away with it, <0.1 okay, <0.05 good, <0.025 very good)
PS1: Two indicators have to be permuted for our strategy (SPY and TIPS). The daily changes of both indicators were mixed up with the same (random) pattern. Thus the correlation of the indices is maintained.
PS2: long memory and volatility clustering are not preserved by permutations. This is not a problem, as the procedure recognizes overfitting, but does not prove the absence of overfitting. Since the trend following strategy is based on these properties, we can safely discard all strategies that do not pass the test, since the test is easily in our favor if these properties are missing
Second interim result
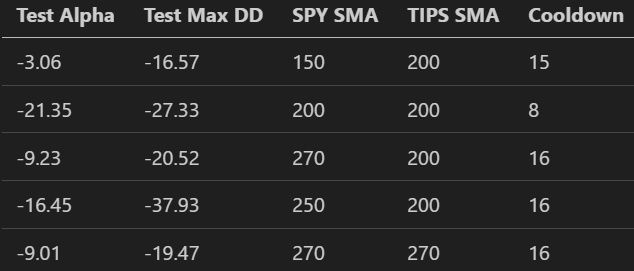
4 of the 9 strategies had a p-value > 0.1 and were eliminated. Here is an overview of the 5 strategies for the "final":
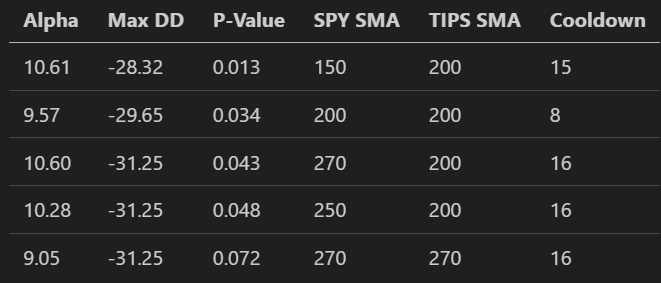
Performance on test data
Next, the strategies from 2024 - May 2025 were tested. Admittedly, this is quite a small test area, but again it is intended to be used to exclude strategies rather than to confirm robustness.
Here, all SPYTIPS strategies perform poorly in terms of alpha, as the period is relatively volatile. By way of comparison, the traditional 2xSPYTIPS generated an average alpha of -14.4 and even -22.5 in the word case during this period. The maximum drawdown was -25.3%. The benchmark market (SPY) had a drawdown of -18.8% (and an alpha of 0). Now the finalists:
The second and fourth strategies deliver weak values, while the first delivers surprisingly good values.
Second round Monte Carlo
The Monte Carlo permutation test is now performed again on the test data. This time, however, the permutation strategy is not optimized, but the same strategy is used that was used on the real data. It is therefore checked whether the strategy would also have worked on random permutations. If so, then the strategy has not been trained correctly on the patterns in the real data. The search is again on for better permutations. This time, a permutation is better if the strategy produces a higher alpha with the same or lower drawdown on the synthetic data. Again, a lower p-value is better. However, there are no good guidelines here.
(Since I ran into the picture limit, here are the values in writing:)
- 0.109
- 0.625
- 0.259
- 0.697
- 0.205
The test once again confirms the poor performance of strategies 2 and 4, which perform even worse than random with >0.5.
Winners and a few statistics
Strategy 1 is obviously the best. It comes out on top in all tests and is even more stable and profitable on test data (measured by drawdown) than the benchmark and especially than 2xSPYTIPS. But how good is the strategy now?
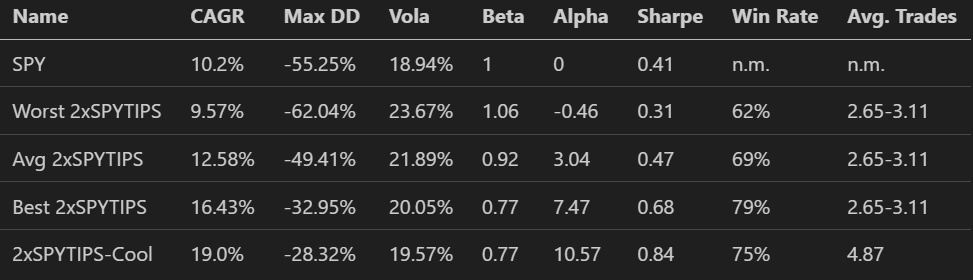
It even clearly beats the best case scenario of the 2xSPYTIPS strategy. It achieves almost double the SPY performance with half the maximum drawdown.
However, it not only requires almost 5 trades per year, but you usually have to react to the indicators on a daily basis, which makes it one of the more active strategies (and thus contradicts the idea that it should be a simple strategy with little effort. You could also test weekly execution again here, as all the data is available on Sunday, for example, and you can trade on Monday morning. That would probably come at the expense of risk). I have called it 2xSPYTIPS-Cool because it essentially adopts the idea of the 2xSPYTIPS strategy, but extends this concept to include the cooldown.
Conclusion
Although overfitting and non-robustness could not be proven by my tests, further testing is still required. Especially on longer test data periods. Nevertheless, the results look promising.
It should also be mentioned that the parameters are also very round numbers (150, 200, 15), which indicates patterns in the market, as many market participants pay attention to these numbers.
However, I will perform other robustness tests as the drawdown can be significantly increased (to about -40%) by small changes in the strategy. The (270,270, 16) and (270, 200, 16) strategy also looked very promising.
I will discuss this in a separate post, as this one has become quite long.
I hope you were able to take something away and it wasn't too complicated and technical. If anything is unclear, please feel free to ask.
Interesting ideas and suggestions for further tests / strategies / parameters are also very welcome.


