
I would like to use the current "black time" to structure my portfolio better and diversify it more. So far, I have overweighted some sectors rather arbitrarily, while others are completely absent. 😅
In order to achieve a more sound, sectoral diversification, I have looked at two things:
1. the long-term performance of the sectors in the S&P 500
2. the maximum drawdowns of these sectors over different time periods
----------------------------------------------------------------------------------------------------------
The following table shows the average annual returns of the S&P 500 sectors over 10, 20, 30 and 40 years.
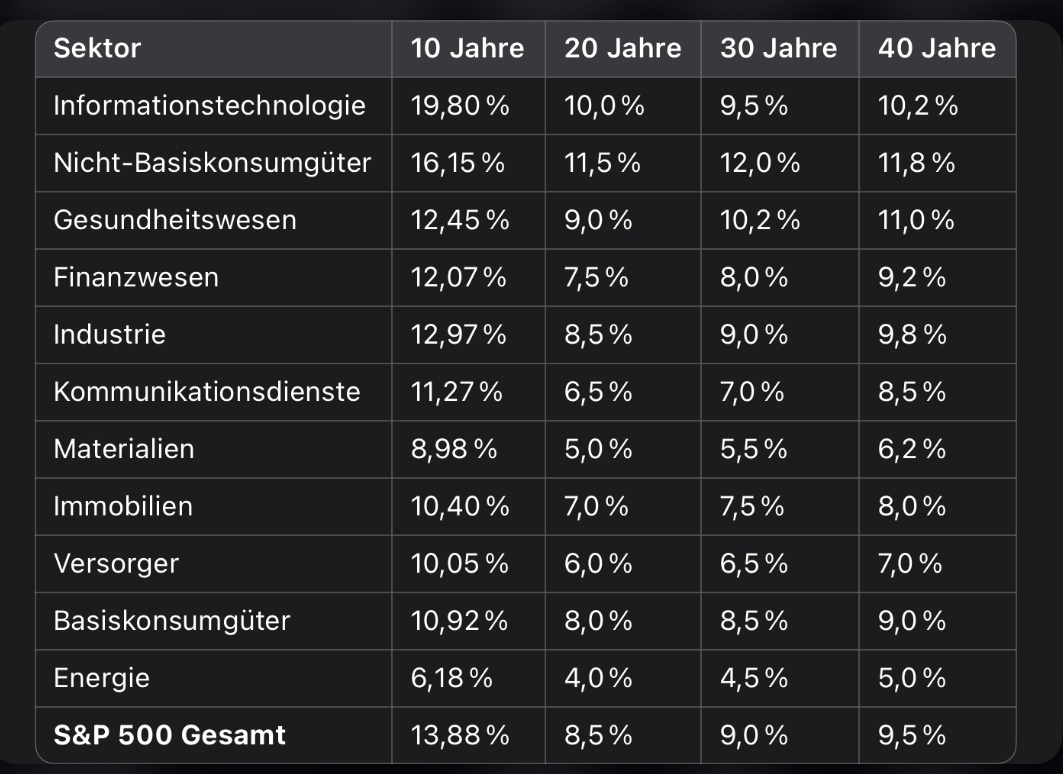
It is striking: Some sectors have performed significantly better than others over longer periods of time. Particularly noteworthy are
- Information technology
- Healthcare
- Consumer staples (cyclical consumption)
These sectors achieved long-term average annual returns of over 10% p.a.
By contrast, the following sectors performed less convincingly:
- Energy
- Materials (basic materials)
- Real estate
----------------------------------------------------------------------------------------------------------
Unfortunately, historical drawdown data by sector is limited and not uniformly available. Nevertheless, a clear trend can be identified: The available data shows that defensive sectors tend to have lower drawdowns, while cyclical sectors are more prone to larger declines. So it looks like sectors such as consumer discretionary and healthcare tend to have lower maximum drawdowns, while sectors such as financials and energy have had the sharpest declines.
In the next step, I looked at the current (2024) market weighting of the sectors in the S&P 500, i.e. a market capitalization-weighted allocation as a passive ETF would reflect it:
Information Technology 28%
Healthcare 13 %
Financial services 12 %
Consumer Discretionary 10%
Communication services 8 %
Industry 8 %
Consumer staples 6 %
Energy 4 %
Utilities 3 %
Materials 2.5 %
Real estate 2.5 %
This is the first time I realize how much you have to overweight or underweight a sector in order to have the greatest probability of hypothetically beating the market in a fictitious, ideal scenario by means of sectoral overweighting and underweighting.
For example, only a weighting of well over 28% in information technology would have led to a possible outperformance.
Conversely, only a complete abandonment of the real estate sector could have made a positive contribution. (in retrospect)
Of course, this is a gross oversimplification, as each sector consists of a large number of companies of very different quality. Nevertheless, valuable insights for the strategic portfolio orientation can be derived from this.
----------------------------------------------------------------------------------------------------------
But now I'm at a crossroads.
Option A
I analyze current valuation ratios such as P/E ratios, Shiller P/E ratios or earnings growth per sector and decide on this basis which sectors appear most attractive for the future, i.e. an active, forward-looking approach.
Option B (my favorite):
I take my cue from long-term, historical average returns and risks and use them as a guide for strategic allocation - in other words, a more rule-based approach with a rational derivation.
----------------------------------------------------------------------------------------------------------
My sectoral target portfolio, based on risk-return profile and personal preference, could look like this:
Let's start from the back, the weakest sectors such as energy, real estate, utilities and basic materials have proven to be underperforming and often volatile over the long term. In total, I would therefore like to limit these to a maximum of 10% of my portfolio.
Industry 8 %
Financial services with 9 %
Communication services 10 %
Consumer staples with 13 %,
Healthcare 15 %
Consumer staples 15%
Information technology 20 %
The above weighting aims to create a portfolio that is both growth-oriented and risk-optimized in the long term.
----------------------------------------------------------------------------------------------------------
Conclusion 🤓
With this train of thought, I am pursuing a systematic and long-term approach that takes both opportunities and risks into account. The aim is to create a portfolio that remains stable and profitable in different market phases. Of course, it will not always be easy to implement these weightings perfectly in practice, but this strategy provides a clear direction as a basis.
----------------------------------------------------------------------------------------------------------
Sources 🤯
JP Morgan Asset Management - Guide to the Markets
www.vanguard.com Principles for Investing Success


