$IREN (+5.67%) In the course of the "momentum" of trading with the help of AI, I am testing some of my standard setups. AI is actually only used indirectly here, i.e. I have had my indicator and strategy scripts scripted and improved with the help of Claude and Copilot. In the end, there have been around 25 iterations so far 😂
There will be a few more, as I want to improve the strategy in relation to price action and dynamic SL.
Enclosed for those interested in day trading my results on the box setup. What is the box theory about?
In box theory day trading, it is assumed that the price tends to overreact at the edges of the previous day's range: at the upper edge, a downward bounce is expected with increased probability (= short trade), as this is where the strongest sellers entered the market the day before. Whereas the lower edge is more likely to see an upward rebound is more likely to occur at the lower edge, as the strongest buyers entered the market the day before (= long trade). This creates clearly defined zones in which traders can speculate on trend reversals or false breakouts.
Management is important here in the event of a strong trendi.e. when the breakout from the box occurs. This is where the know-how of Orderflow and PriceAction comes into play. This was the trickiest part of my scripts, but with the help of AI I was able to code it 😁
For example, I can adjust the hysteresis of the activation zones at the bottom and top edge in the settings. I can also trade based on wick or body. Restrict order times and activate or deactivate confirmation candles for the fire signal.
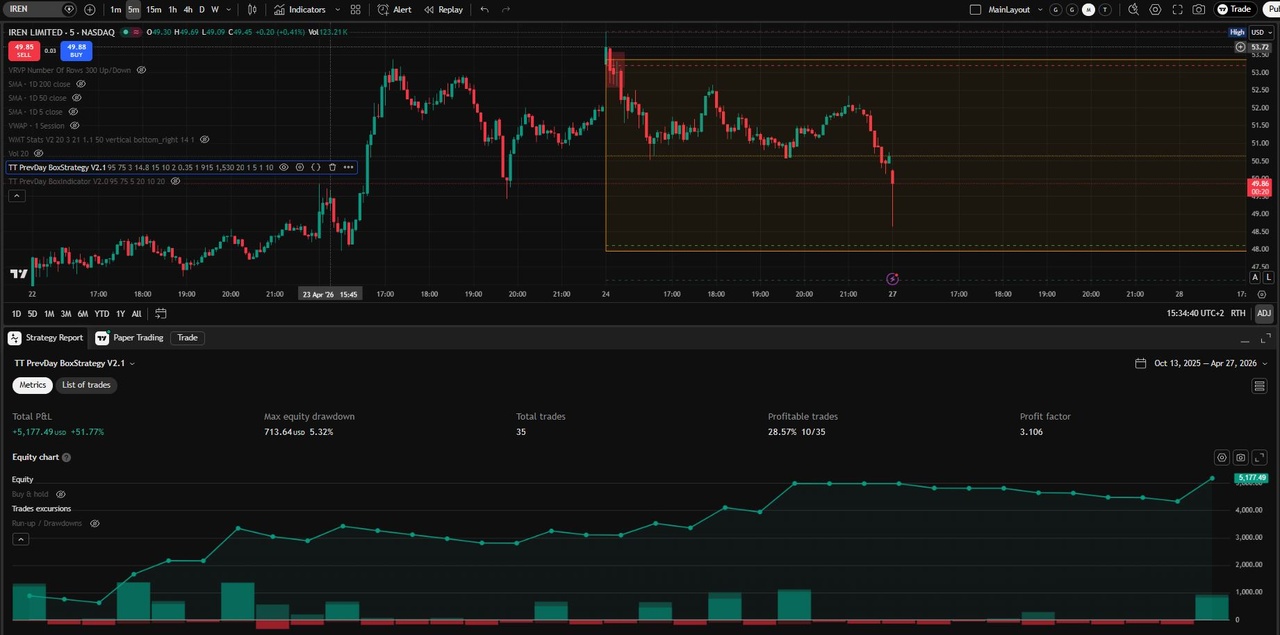
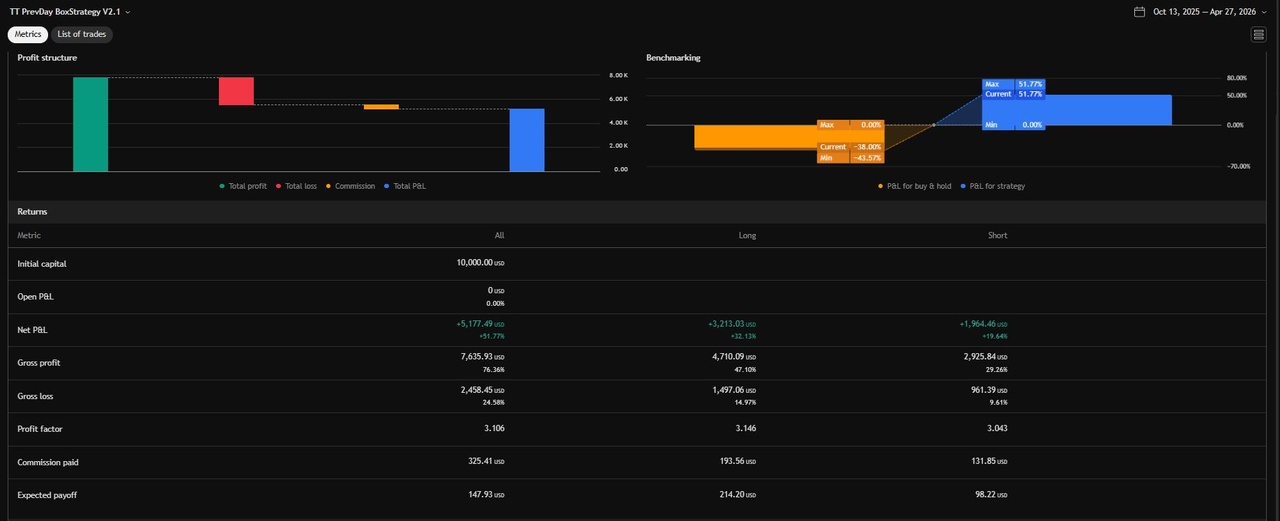
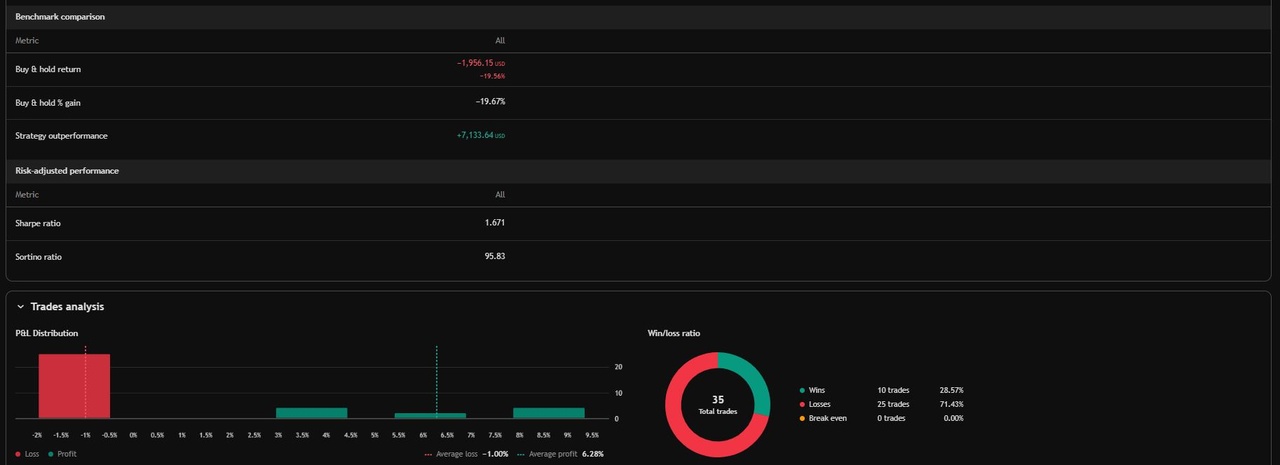
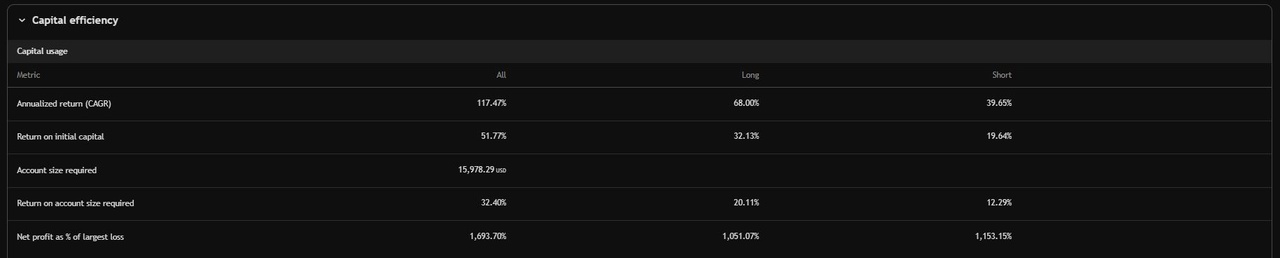
☝What is really interesting is that with very conservative risk management (SL at -1% / TP up to +10%) a good result is achieved! A fairly low win rate of under 30% is enough to make a good 50%+ in half a year, and that with a maximum drawdown of 5%☝😆
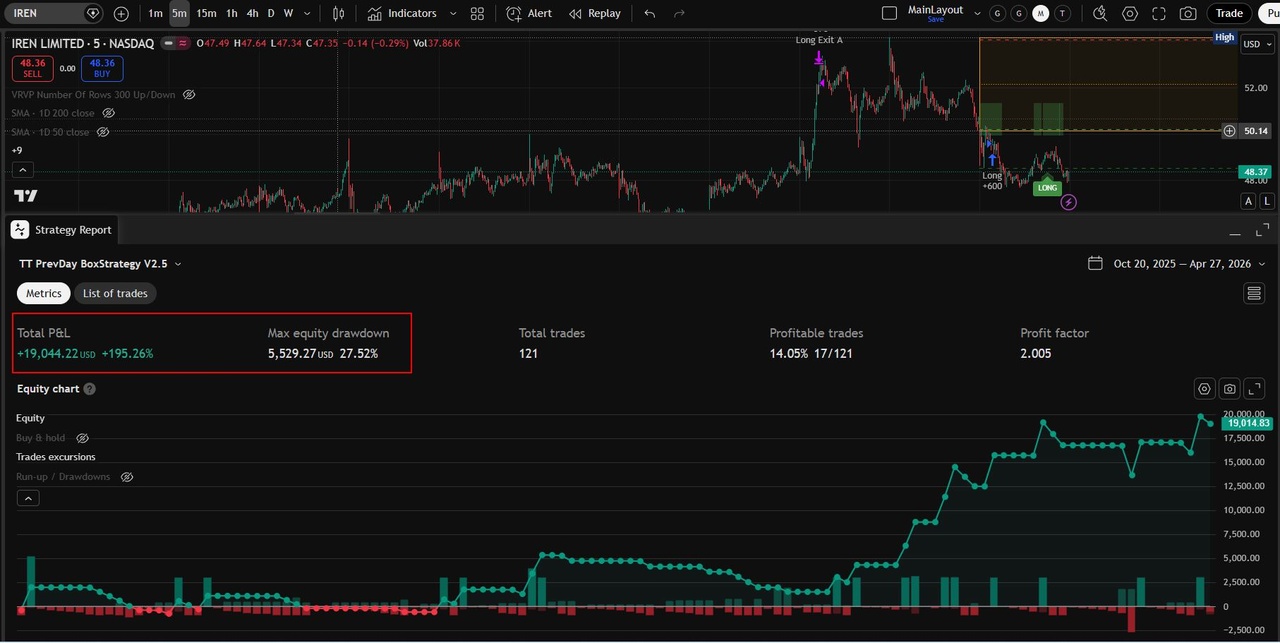
Enclosed a screenshot of the sample 5min chart October 2025-April 2026
In the upper part of the screenshot you can see the chart, on the right the orange box, which represents the range of the previous day. At the upper edge you can see the area highlighted in red, which represents the short activation zone using the script. If the candlestick formation matches my strategy, the "fire" signal appears and triggers the short trade.
In the lower area you can see the statistics of all trades since October 2025.
UPDATE: I have added a small detail so that I can use a toggle to choose whether I want to wait for the trade to close or let it continue until the SL / TP. The drawdown risk goes up, but so does the return - 28% to +195%