- free of charge and without registration
Today I would like to introduce you to the 'x-ray' tool from Morningstar.
Recently, there have been a number of portfolios with several ETFs where the overlaps are often - apparently - not clear. This tool makes it very easy to uncover and understand them.
https://tools.morningstar.de/de/xray/editholdings.aspx?LanguageId=de-DE&values=
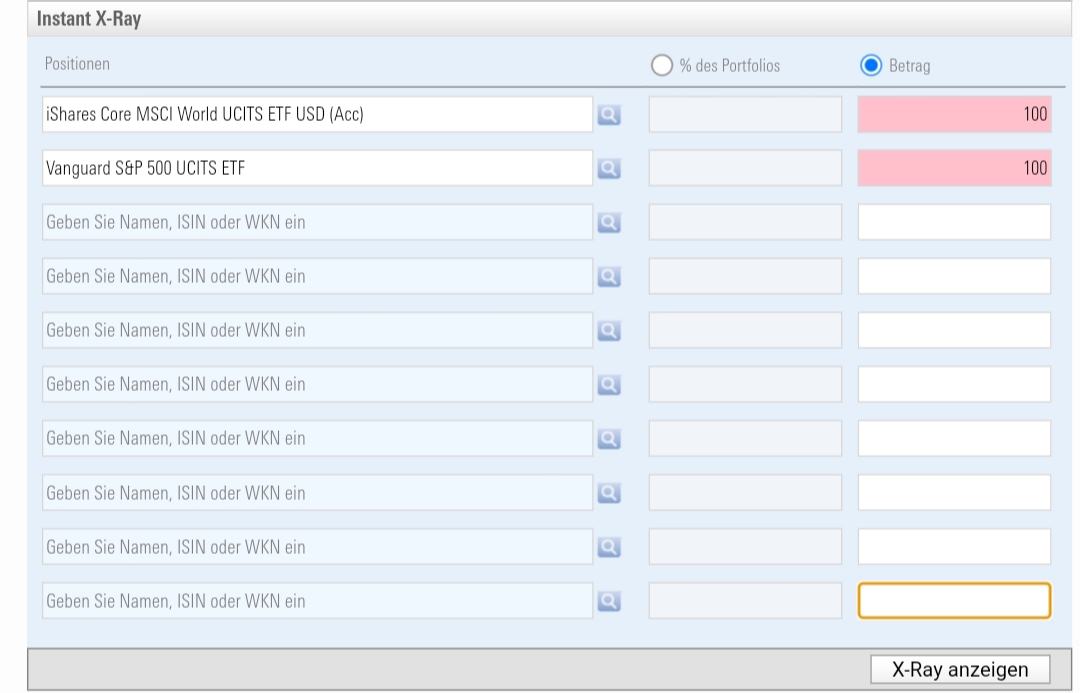
You can enter up to 15 positions on the start page. ETFs, other funds, individual shares etc. can be entered with the ISIN and weighted by amount in EUR or by the percentage share in your portfolio.
For this example, I have entered any Msci World and any S&P 500 with a weighting of EUR 100 each, i.e. 50 percent each, and clicked on 'Show X-Ray', after which the evaluation takes place.
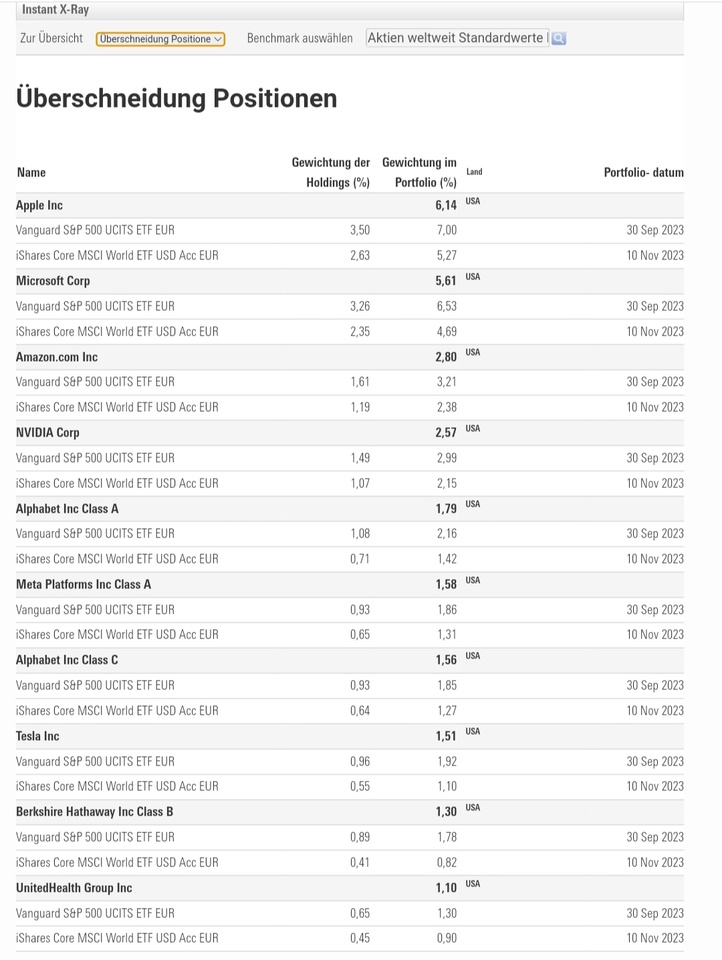
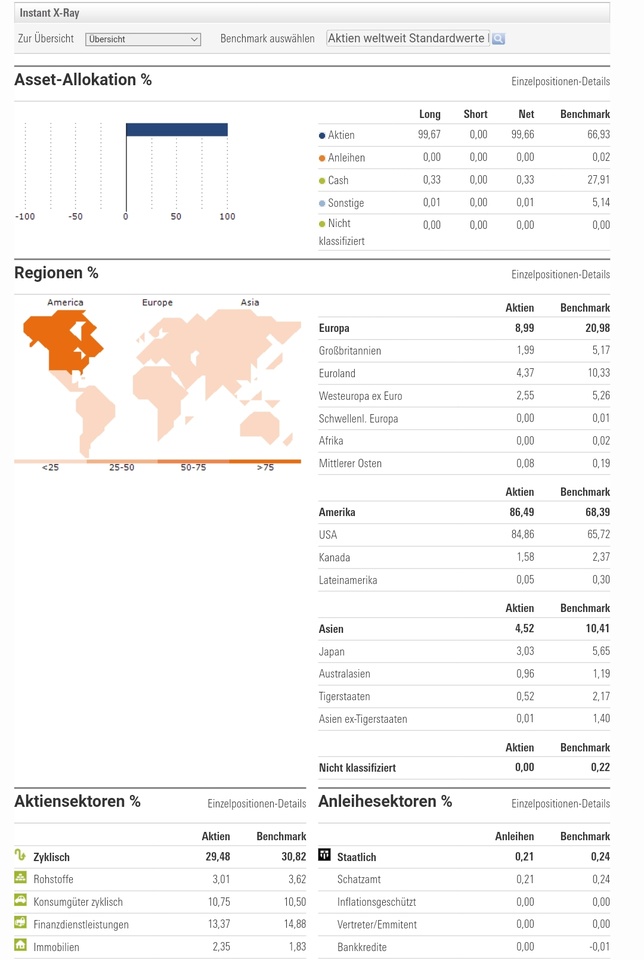
With this very simple example, it should be clear to most people on this platform what the effect is😏. In the pictures you can see the rough overview and the overlapping of the top 10 positions. With other ETFs and, above all, several ETFs, possibly even in combination with large individual share positions, however, it becomes very exciting.
You can click through everything else, it needs no further explanation 😉
...And yes, I am aware that many of you also have >15 positions in your portfolio. Please see it merely as an aid for those who want to use the tool to check the effects of combinations 🙂
Best regards
Tom A