$TGT (-0.48%) | Target Q2'24 Earnings Highlights:
🔹 EPS: $2.57 (Est. $2.19) 🟢; UP +42.8% YoY
🔹 Revenue: $25.45B (Est. $25.2B) 🟢; UP +2.7% YoY
🔹 Comp Sales: +2.0% (Est. +1.07%) 🟢
Raised FY'25 Guidance:
🔸 EPS: $9.00-$9.70 (Est. $9.28; Prior: $8.6 - $9.6) 🟢
🔸 Comparable Sales: Expected in the lower half of 0% to +2% growth
Q3 Outlook:
🔸 EPS: $2.10-$2.40 (Est. $2.24) 🟡
🔸 Comparable Sales: 0% to +2% (Est. +1.91%) 🟡
Other Q2 Metrics:
🔹 Net Income: $1.19B, UP +43% YoY
🔹 Operating Income: $1.64B (Est. $1.38B) 🟢; UP +37% YoY
🔹 Operating Income Margin Rate: 6.4% (Est. 5.46%) 🟢; UP from 4.8% YoY
🔹 Gross Margin: 28.9% (Est. 28%) 🟢; UP from 27.0% YoY
🔹 SG&A Expenses: $5.39B (Est. $5.35B) 🟡; UP +4% YoY
🔹 EBITDA: $2.40B (Est. $2.06B) 🟢; UP +26% YoY
🔹 Interest Expense: $110M, DOWN from $141M YoY
Sales and Customer Metrics:
🔹 Comparable Sales: +2.0% (Est. +1.07%) 🟢
🔹 Store Comparable Sales: +0.7% (Est. +0.67%) 🟢
🔹 Digital Comparable Sales: +8.7% (Est. +3.2%) 🟢
🔹 Customer Transactions: +3% YoY
🔹 Average Transaction Amount: -0.9% YoY (Est. -1.29%) 🟡
Discretionary Categories:
🔹 Apparel Comparable Sales: +3% YoY
🔸 Improving trends noted, supported by price adjustments and new product offerings.
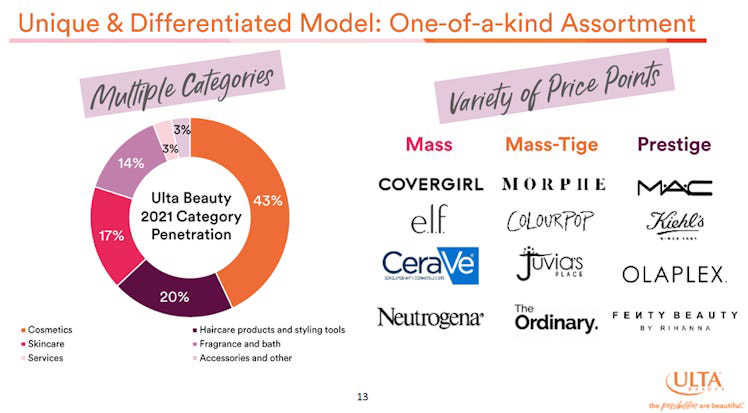
🔸 Continued strength observed in Beauty and other nonfood items.
Digital and Same-Day Services:
🔹 Digital Sales as Share of Total Sales: 17.9%, UP from 16.9% YoY
🔹 Same-Day Services: Saw double-digit growth, led by low teens growth in Drive Up and Target Circle 360™ same-day delivery.
Capital Deployment:
🔹 Dividends Paid: $509M, UP from $499M YoY
🔹 Shares Repurchased: $155M, retiring 1.1M shares at an average price of $145.94
🔹 Return on Invested Capital (ROIC): 16.6%, UP from 13.7% YoY


