Build a portfolio with a STRONG FOUNDATION
ETFs are the easiest way to do this
$SPY (-3.04%) S&P 500
$QQQ Invesco QQQ
$VTI (-3.04%) Vanguard Total Market
$DGRW WisdomTree Div Growth
$SCHD Schwab US Dividend Equity
Posts
30Build a portfolio with a STRONG FOUNDATION
ETFs are the easiest way to do this
$SPY (-3.04%) S&P 500
$QQQ Invesco QQQ
$VTI (-3.04%) Vanguard Total Market
$DGRW WisdomTree Div Growth
$SCHD Schwab US Dividend Equity
I still remember a conversation I had years ago with a new trader who was proud of his first big investment.
He told me, I just bought the S&P 500 ETF because I heard it’s the best index fund in the world.
I asked him, Do you know the difference between an ETF and an index fund?
He smiled and said, Aren’t they totally different things?
That’s when I realized, this confusion isn’t just for beginners. Even people already putting money to work often don’t fully understand what they’re buying. And in this business, what you don’t know can hurt you.
So here’s how I broke it down for him, the same way I’d explain it to anyone on the trading desk.
1. First, what’s an index?
An index is nothing more than a list. It’s not a product you can buy directly, it’s a benchmark that tracks the performance of a specific group of securities.
Examples:
• S&P 500 – 500 large U.S. companies, market-cap weighted.
• Nasdaq-100 – 100 largest non-financial stocks on Nasdaq.
• Russell 2000 – 2,000 small-cap U.S. companies.
Indices are rules-based. They have strict criteria for what’s included, how it’s weighted, and how often they’re rebalanced.
2. What’s an index fund?
An index fund is simply a pool of investor money that tries to copy the performance of a specific index.
It owns the same securities, in the same weights, as the index.
Two main formats:
• Mutual Fund Index Fund – Trades once a day at the end-of-day NAV (Net Asset Value). You can’t trade it intraday.
• ETF Index Fund – Trades like a stock all day long with real-time prices.
The big “aha” moment for most people is:
➡ An ETF can be an index fund, and an index fund can be an ETF. “Index fund” describes the strategy, “ETF” describes the structure.
3. Why traders love ETFs
For active traders and tactical investors, ETFs have major advantages:
• Intraday Trading – Enter and exit positions whenever the market is open.
• Tight Spreads – In heavily traded ETFs like $SPY (-3.04%) or $QQQ, spreads are often just a penny wide.
• Options Access – You can trade calls, puts, spreads, and hedges on many ETFs.
• Tax Efficiency – Thanks to the in-kind creation/redemption process, ETFs often avoid triggering capital gains distributions that mutual funds pass on to investors.
4. The hidden plumbing | creation/redemption
Most people never see this, but it’s what keeps ETFs functioning properly.
Large institutions called Authorized Participants (APs) create or redeem ETF shares by exchanging baskets of the underlying securities.
• If ETF prices drift above the value of the underlying assets, APs create new shares and sell them into the market, pushing the price back down toward fair value.
• If ETF prices drift below NAV, APs buy ETF shares in the market and redeem them for the underlying assets, pushing the price back up.
This constant arbitrage keeps ETFs trading very close to their NAV.
5. Advanced concepts & risks to understand
• Synthetic ETFs – Instead of owning the actual stocks, these use derivatives (like swaps) to mimic an index’s return. This can expose you to counterparty risk if the swap provider fails.
• Leveraged & Inverse ETFs – Designed for daily performance multipliers (2x, 3x) or the opposite (-1x, -2x, -3x) of an index. Over time, compounding and volatility decay can produce returns far different from what you expect. Great for short-term tactical plays, risky for long-term holding.
• Tracking Error – No ETF tracks its index perfectly. For large, liquid ETFs, the difference is tiny. For niche or illiquid markets, it can be much larger than you think.
• Liquidity & Spreads – Always check trading volume and spreads. A low-volume ETF might have a spread big enough to eat into your returns before you even get started.
6. How pros choose between ETFs and mutual funds
• Use ETFs if you want flexibility, options trading, lower minimum investments, or intraday control.
• Use mutual funds if you’re dollar-cost averaging in a retirement account, prefer automatic investments, or don’t need intraday pricing.
7. Real-world example
Want S&P 500 exposure?
• SPY (ETF) – Trades all day, ultra-liquid, optionable, small tracking error.
• VFIAX (Mutual Fund) – Same holdings, but only trades at end-of-day NAV, requires minimum investment, ideal for long-term retirement accounts.
Both are index funds. The difference is how they trade and fit your plan.
8. The biggest beginner mistakes
• Holding leveraged ETFs long-term thinking they’ll just go up faster.
• Buying low-volume ETFs without realizing spreads eat into returns.
• Owning synthetic ETFs without understanding the counterparty risk.
• Confusing the index itself with a tradable product.
Quick Reference Cheat Sheet (screenshot this)
• Index = List of securities (not tradable).
• Index Fund = Fund that tracks an index (can be mutual fund or ETF).
• ETF = Fund traded like a stock (can track an index or follow another strategy).
• Leveraged/Inverse ETFs = Short-term tactical tools, not long-term holdings.
• Synthetic ETFs = Use derivatives, have counterparty risk.
• Tracking Error = Difference between ETF performance and its index.
That new trader I spoke to years ago? He still owns ETFs today, but now he knows exactly why he’s using them, how they work behind the scenes, and which ones to avoid.
In this game, the right tool in the wrong hands can be dangerous… but the wrong tool in the right hands is worse.
Understand what you own, and you’ll trade and invest with confidence instead of luck.
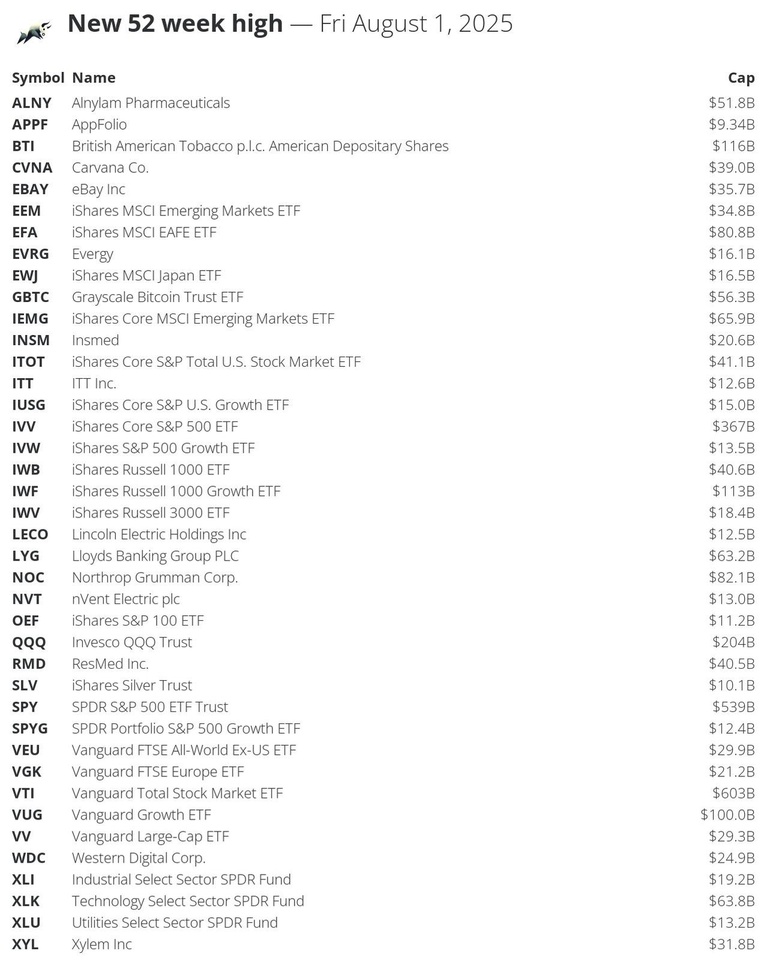
🔝 Stocks that made a new 52-week high today: $VTI (-3.04%)
$SPY (-3.04%)
$IVV (-3.07%)
$QQQ
$BTI (-0.68%)
$IWF (-3.54%)
$VUG (-3.63%)
$NOC (-2.31%)
$EFA
$IEMG (-4.05%)
$XLK
$LYG
$GBTC
$ALNY (+0.18%)
$ITOT (-3.12%)
$IWB (-3.05%)
$RMD (-2.58%)
$CVNA (-9.59%)
$EBAY (-2.91%)
$EEM
$XYL (-2.22%)
$VEU (-2.8%)
$VV (-3.05%)
$WDC (-5.61%)
$VGK (-1.57%)
$INSM (-1.41%)
$XLI
$IWV (-3.08%)
$EWJ (-4.38%)
$EVRG (+0.54%)
$IUSG
$IVW
$XLU
$NVT
$ITT (-1.67%)
$LECO (-3.2%)
$SPYG
$OEF (-3.15%)
$SLV
$APPF (-3.13%)
#52weekHigh
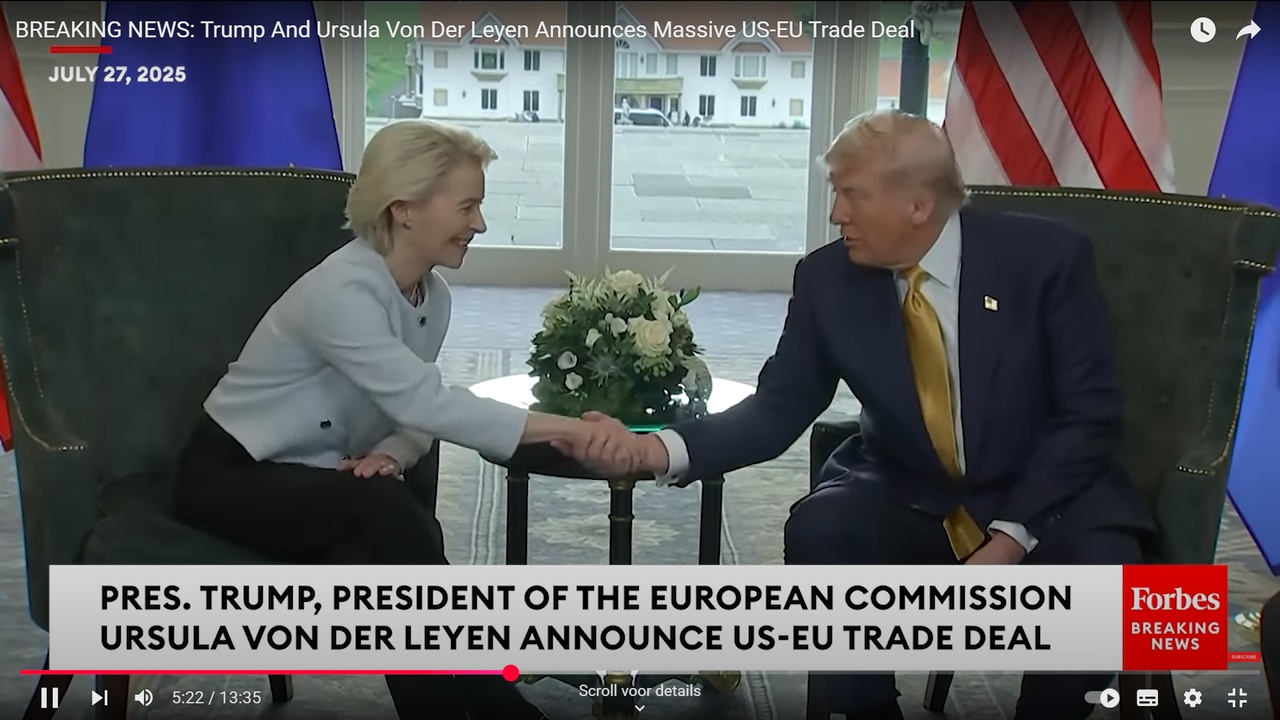
New US-EU trade deal worth $1.35 trillion
At a summit in Scotland, Donald Trump and Ursula von der Leyen reached a major trade deal. The US lowers its threatened import tariffs from 30% to 15% on almost all European exports. In return, the EU will invest $750 billion in U.S. energy and $600 billion in broader economic cooperation, including defense. Higher tariffs of up to 50% also remain in place on steel and aluminum. The deal avoids a trade war and marks a new chapter in transatlantic relations. $VOO (+0.04%)
$QQQ
$GLDA (+0.86%)

Any Suggestion.
My monthly adding
$VGT (-4.4%) 33.3%
$BRK.B (-2.44%) 33.3%
$QQQ 33.3%
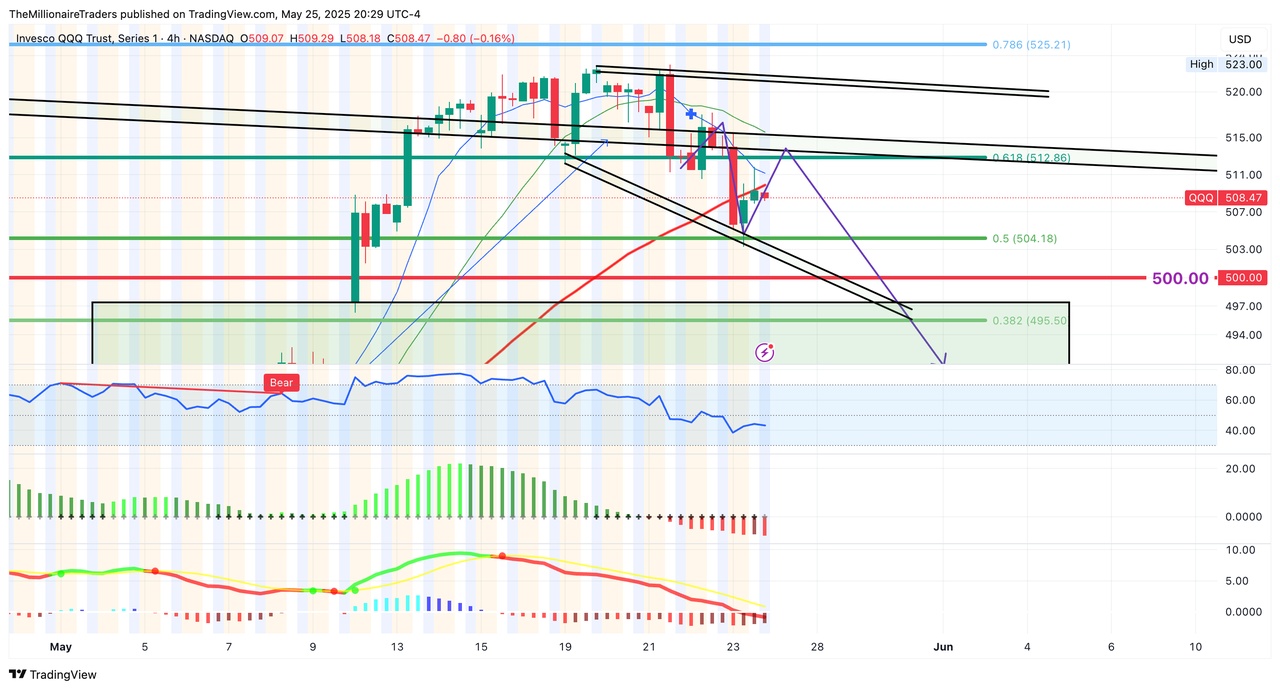
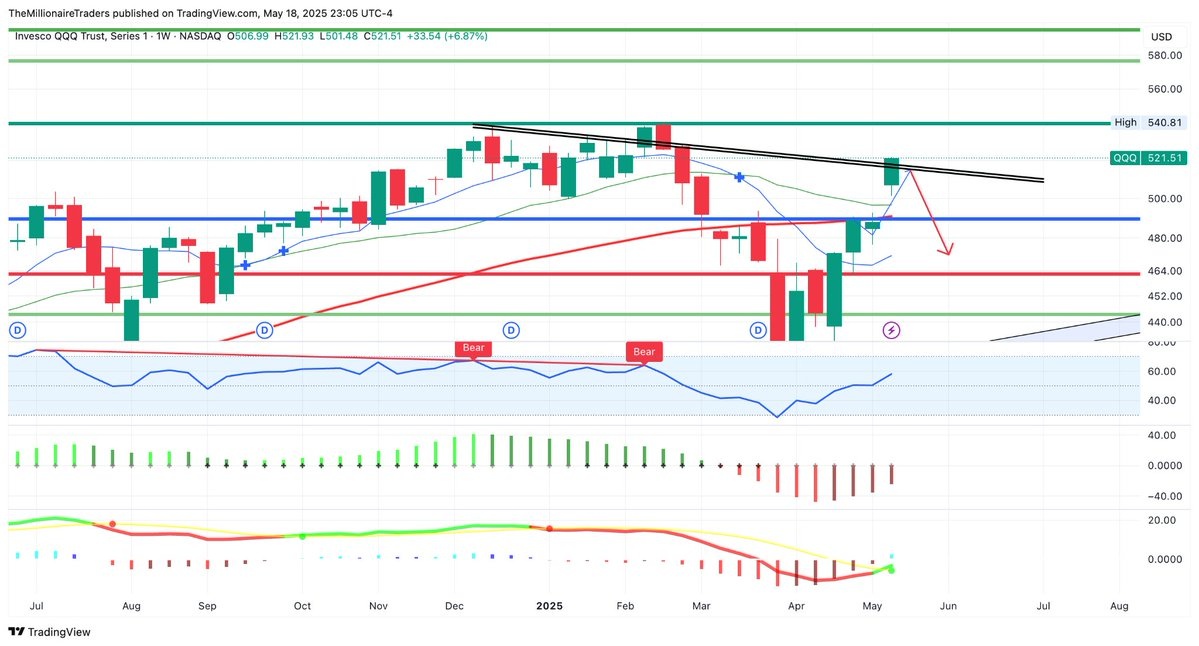
$QQQ $QQQ right shoulder invalidated. That H&S setup got smoked. Bulls defended hard above $515. Now watching if we build for a higher move, or just a fakeout.
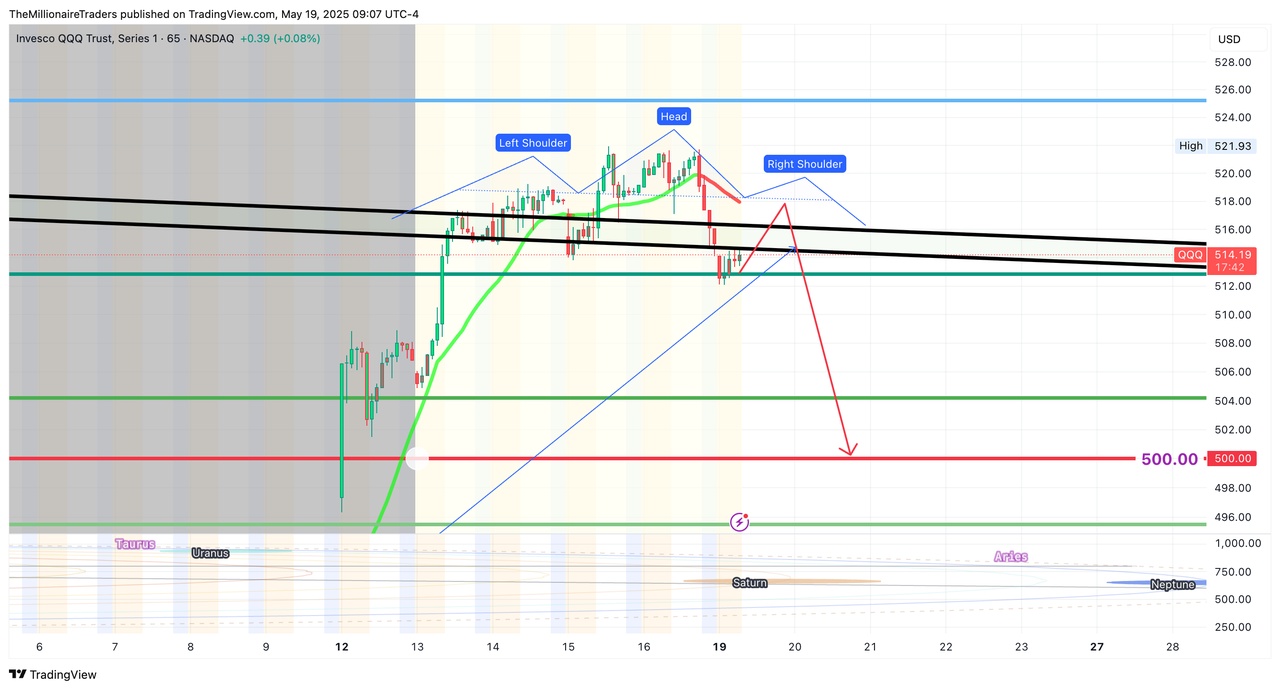
$QQQ $QQQ Clear head & shoulders forming on the 1H. Rejection at trendline + neckline in play. If this pattern plays out, $500 is the next magnet. Let’s see if bears show up. 👀
$QQQ $QQQ (Invesco QQQ Trust) pushing right into trendline resistance. Would prefer a pullback here to build structure potential for an inverse H&S if it sets up. Still a great move off the lows, but no need to chase.
Top creators this week