---𝐀𝐤𝐭𝐢𝐞𝐧𝐯𝐨𝐫𝐬𝐭𝐞𝐥𝐥𝐮𝐧𝐠---
Alfen N.V.
NL0012817175
Alfen N.V. is at the heart of the energy transition with its solutions. With transformers, energy storage, charging stations for electric cars and a wide range of other products and services, Alfen is the center and link in the power grid. With a wide range of products developed in-house and extensive experience as a system integrator, Alfen is working on the power grid of the future: reliable, sustainable and innovative [1]. Alfen is the market leader in the Netherlands in these areas. However, Alfen would like to continue to conquer the European market on this basis. Significant subsidiaries are located in the Netherlands, Finland and Belgium, with 61% of sales still generated directly from projects in the Netherlands, 38% in the EU and a marginal share outside the EU [2].
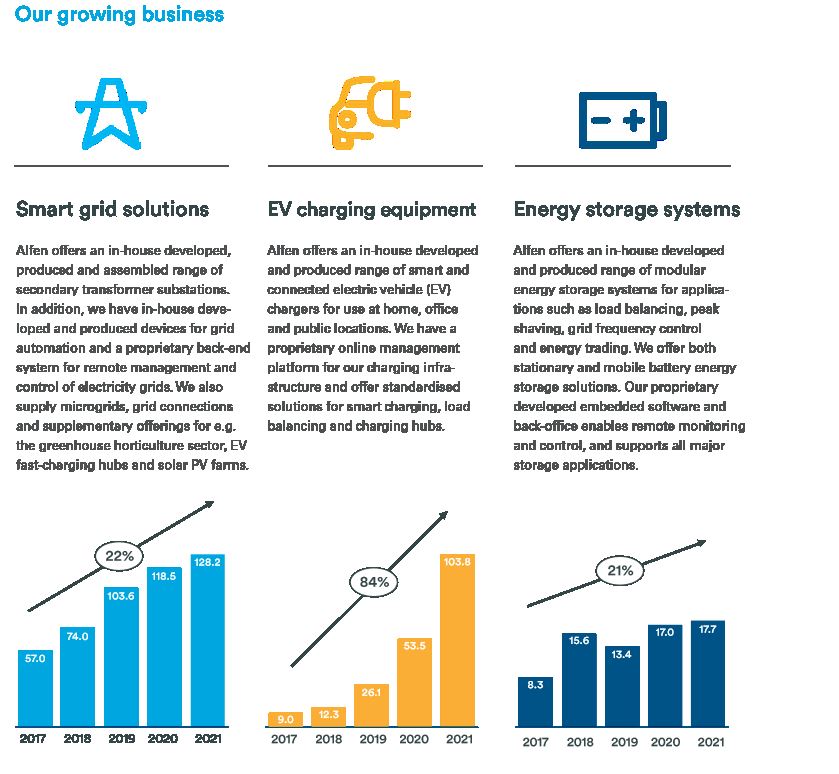
Revenue segments [2]:
Smart grid solutions (intelligent power grids): 52% of revenue.
Energy storage systems: 7% of sales
EV charging equipment (EV charging stations): 41% of sales
Key figures:
-KGV 2021: 89.1 [3]
-KGV 2022e: 61.3 [3]
-KGV 2023e: 43.0 [3]
-PEG 2022e (P/E/growth rate): 61.3/30%= 2.04 (rule of thumb: < 1 = very favorable)
-PEG 2023e: 43.0/30% = 1.43
-Goodwill: 0.13% of equity; 0.6% of 2021 earnings [2].
Goodwill contribution: https://app.getquin.com/activity/ymidZwhlTk
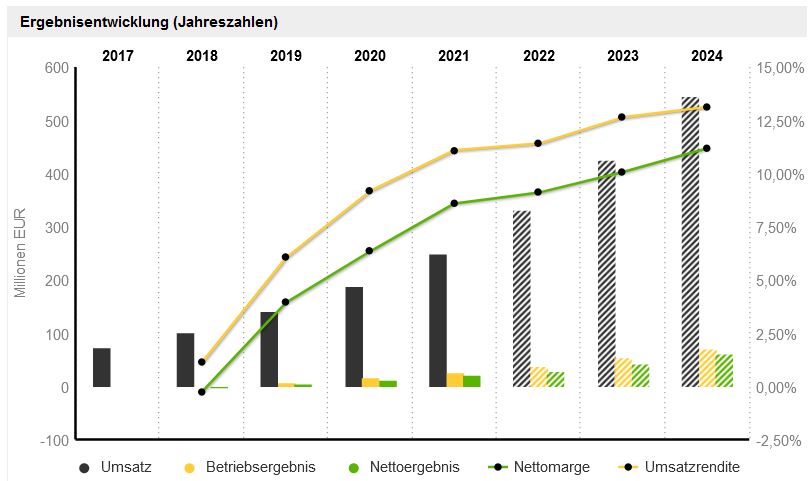
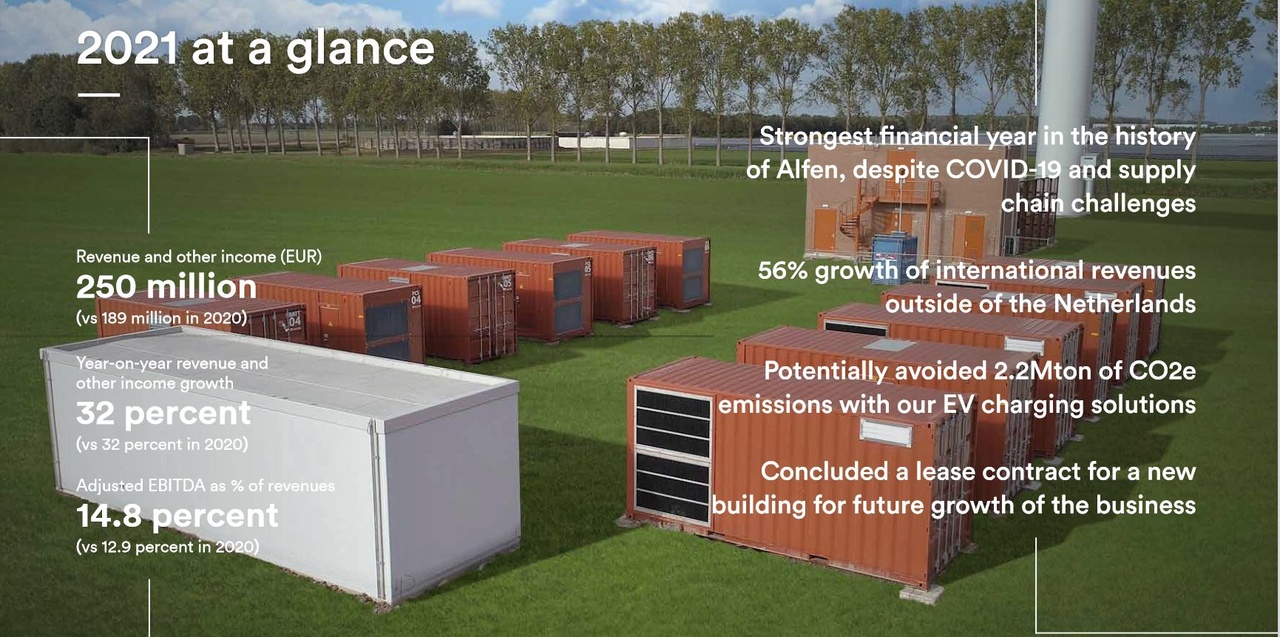
-Sales growth*: 2020 to 2021: 32% ; 2021 to 2022: 33.2%; 2022 to 2023: 37,88%
-EBIT growth*: 2020 to 2021 61%; 2021 to 2022: 33% ; 2022 to 2023: 41,8%
*10-year view not possible as data only available from 2015 (2015 sales €50 million). Due to industry and history, 10-year view not used. Annual report confirms the assumption of 30%.
Market Averages (EU) [5]:
-Aver. P/E Power: 16.99
-Aver. PEG Power: 1.71
-Aver. KGV Electronics (General): 30.73
-Aver. PEG Electronics (General): 0.95
Present Value Calculation = 89,46 € -->created by yourself
-Parameters/Data: G 2021; Required Return 10%, Growth 25% (conservative)
Share price as of 23.03.2022: € 84.32
Rubric - What would Buffet say (data from Annual Report 2021 [2]):
Criteria to be read in detail: https://app.getquin.com/activity/XcuRrJwmyP
Income Statement:
-Research and development: n/a (no data evident from Income Statement).
-Selling, general and administrative expenses: 21.48% of sales -->good!
-Gross margin: 35.97% -->good, tendency increasing! (Buffet's target: at least 40%)
-Net margin: 8.59% in 2021 (9.1% in 2022e) -->ok! (Buffet's target: >20%)
-Interest expense: 3.6% of operating profit-->very good! (Buffet's target: <15%)
Balance Sheet:
-Treasury shares: no buybacks planned!
-Debt < 4xEBIT: Verschuldung 3,7 --> ok!
Cash Flow Statement:
Capital Expenditures:
2021: 54% of net profit (Buffet's target: <50%)
2020: 80,6% des Reingewinns
2019: 118,9 % des Reingewinns
-->development ok, considering the industry, which has high investment needs. To this end, the cash position will be continuously expanded (2019: 134k; 2020: 52m; 2021: 47.2m).
Key Note:
For asset-intensive and project-driven companies, I like to look at the development of inventories, in conjunction with sales. It is good to see here that inventories are continuously growing in line with sales. This is also a sign that the order situation is good and that there are no particularly "slow-moving items" that will have to be written off at some point to reduce profits: The inventory turnover rate (sales/average inventory level) also indicates how often the company "turns over" its inventories within a year, i.e. how often the inventory is "emptied" in a year (even if this happens in practice on a rolling basis and the inventory is never completely empty - hopefully).
Inventory turnover rate 2021: 8.11 (249/30.7)
Inventory turnover 2020: 1.16 (19.9/17.15)
Inventory turnover rate 2019: 1.2 (14.4/ 11.95)
Sales 2021: 249 million
Sales 2020: 189 million
Sales 2019: 143 million
Inventories 2021: 41.5 million
Inventories 2020: 19.9 million
Inventories 2019: 14.4 million
Inventories 2018: 9.5 Mio
Burggraben:
Alfen is in a growing market with many opportunities. However, I do not see a concrete competitive advantage. However, with their charging stations and energy storage systems, the order books will certainly not be empty. Alfen wants to unify its solutions and systems to serve the entire supply chain (smart grids, electricity storage, charging stations). This strategy definitely makes them competitive. To that end, I definitely like the key figures.
Peer Group/Competition:
Siemens Energy
-KGV: negative (2021), 2022e: 154; 2023e: 21.4
-PEG 2022: 154/30 = 5.13; 2023: 0.71
Growth assumption analogous to Alfen. However, existing data could indicate more like 20-30%.
https://www.siemens-energy.com/de/de.html
Blink Charging
Profit zone hardly predictable. Growth given, however, still long way to go! Company is still at the beginning. Sales at just under 21 million in 2021!
Wallbox NV
No profit yet. Profit probably not until 2024/25, but very difficult to forecast. Growth, however, given, analogous to Alfen.
https://wallbox.com/de_de/ueber-uns/vi-er-wallbox
Non-public competition:
Nexgrid
Swissgrid
VTTI
Company classification according to Peter Lynch [4]:
Fast Grower (growth rate >20% )
Conclusion:
I find Alfen extremely exciting. The market allows for a lot of imagination. They have been in a major sideways chart move since January 2021. My hope is that they will serve this again and return in the €60-70 range. Of course, you can not be sure. Possibly there is also a good resistance at about 80€. The e-mobility company would do very well in my portfolio, since I do not really serve this sector yet. One thing to keep in mind, however, is the competition. In addition to the aforementioned peer group, I also see classic car manufacturers, which of course also include Tesla or VW, as competitors to a certain extent, even if not in all segments of Alfen.
As usual, you can also find my collected analyses under the following link:
https://app.getquin.com/activity/YyIXcpDduz?lang=de&utm_source=sharing
As always, no investment advice!
Sources:
[1] https://alfen.com/de/ueber-alfen
[2] https://alfen.com/sites/default/files/media/documents/Alfen%20Annual%20Report%202021.pdf
[3] https://de.marketscreener.com/kurs/aktie/ALFEN-N-V-42452474/fundamentals/
[4] https://diyinvestor.de/peter-lynch-6-kategorien-fuer-die-einordnung-von-unternehmen/
[5] https://pages.stern.nyu.edu/~adamodar/New_Home_Page/datafile/pedata.html
Graphs Source:
Earnings trend: https://de.marketscreener.com/kurs/aktie/ALFEN-N-V-42452474/fundamentals/
2021 at a glance: https://alfen.com/sites/default/files/media/documents/Alfen%20Annual%20Report%202021.pdf
Growing Businesses Overview: https://alfen.com/sites/default/files/media/documents/Alfen%20Annual%20Report%202021.pdf
Company homepage: