Dear people
I have dealt with $ORLY (-0,28%) dealt with
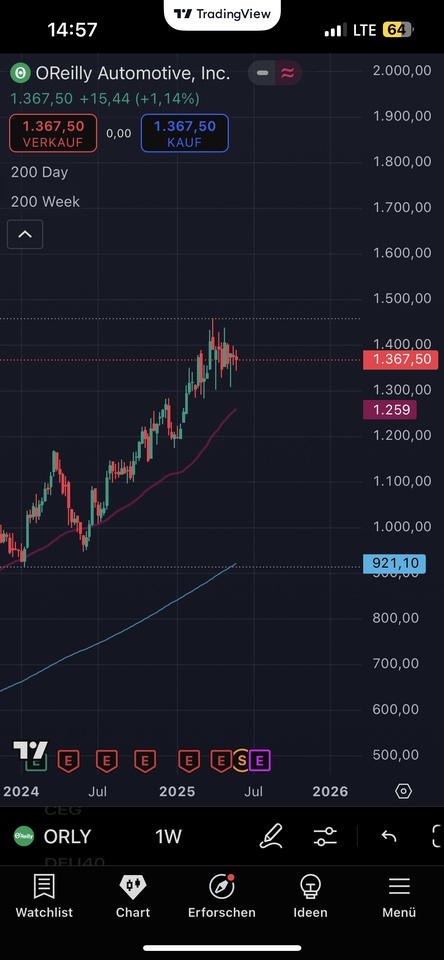
also about Tradingview
in my opinion strongly overvalued, kgv historically also very high
currently well above the 200 week linesee my chart
what is your opinion?
according to investing but fairly valued
I would sell and use the cash $NOVO B (+1,39%)
$MRK (+0,98%)
$PEP (+0,49%) and $ATCO B (+1,5%) buy more