Summary
- Netflix narrowly missed its revenue targets, with free cash flow significantly below expectations, weighed down by the failed $WBDdeal and higher taxes.
- The FY26 FCF forecast was lowered, while international growth continues to outpace growth in the UCAN region.
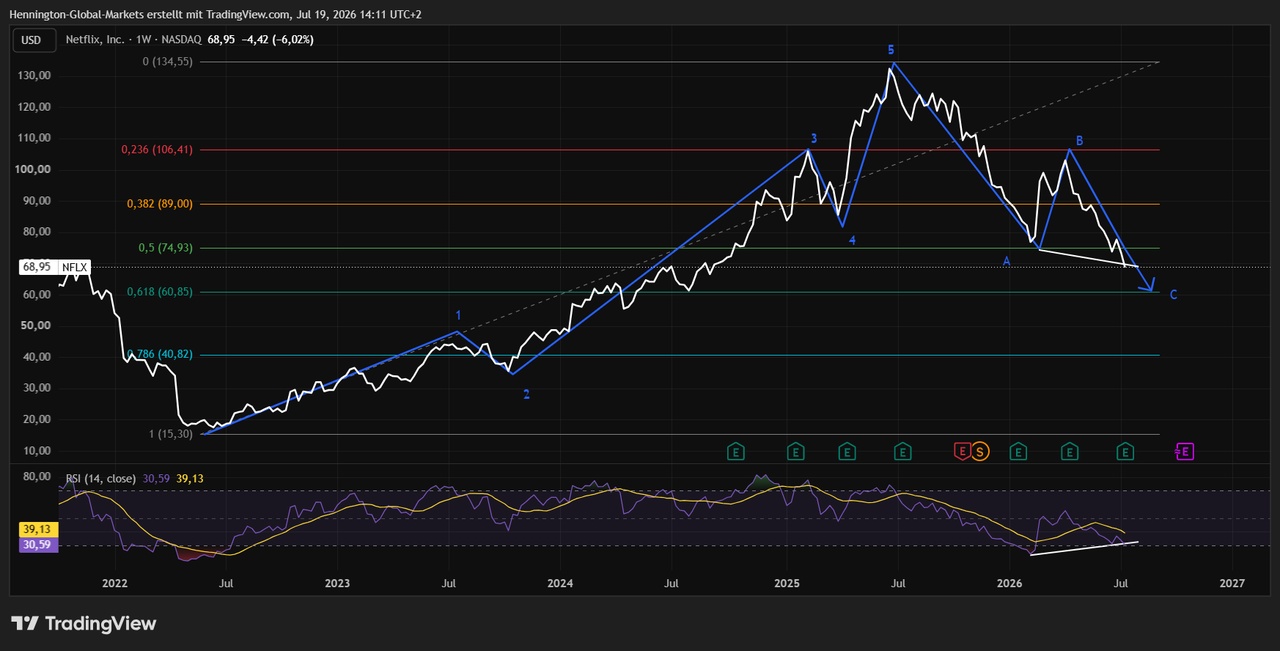
- The stock price is in the “C” correction wave, with the 0.618 Fibonacci retracement at 231.32 defined as the key technical support level on the chart. Entry point at approximately $60.
Why did the stock fall?
Overall, the quarterly results were okay—weak, but acceptable. Revenue of $12.56 billion, which fell short of estimates, EPS of $0.80, and an operating margin of 33%. The main issue was free cash flow, which came in at $1.53 billion, while the market had expected around $2.72 billion. The significant shortfall in FCF is primarily attributable to higher tax payments and the WBD termination fee.
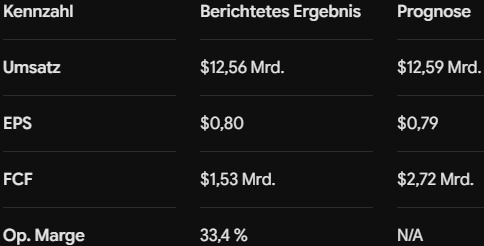
While growth in UCAN was moderate at +10% year-over-year, the international segments outperformed (EMEA +14%, LATAM +21%, APAC +16%). Guidance was significantly scaled back. The revenue growth forecast for the full year 2026 was lowered to 13–14%, and the FCF forecast was reduced to approximately $12.5 billion (instead of $13.09 billion).
Chart Analysis
The uptrend (waves 1–5) was completed at approximately $130. The ABC correction structure shows that the price $NFLX (-0,74%) is approaching point C, whose primary technical target is marked by the 0.618 Fibonacci retracement level at approximately $60.85. This level acts as a key support line, below which market stabilization is likely. Entry at approximately $60.