Hello my dears,
Every good investor should regularly subject his portfolio values to a quick test.
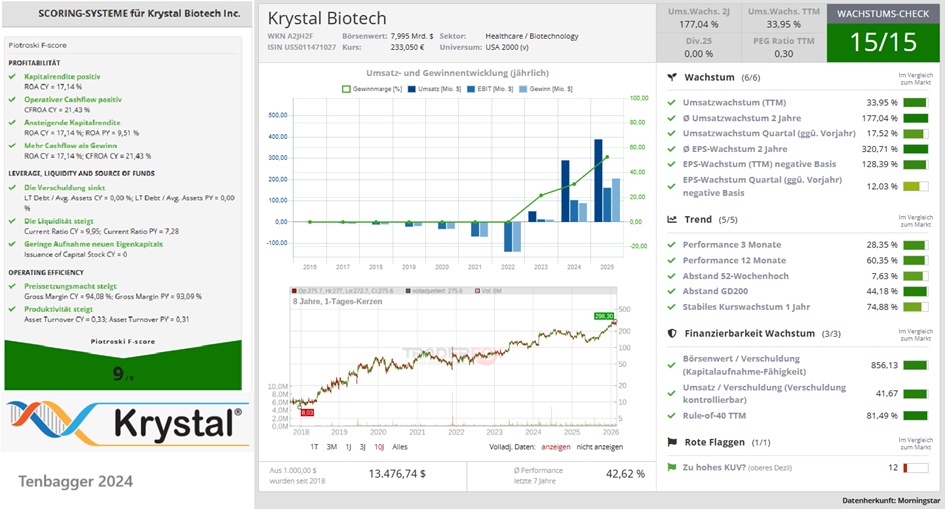
By the numbers, that means new estimates are available. This gives me the opportunity today $KRYS (-0,2%) to send them to the TÜV. In this case, I am the inspector myself today.
My dears, but you are welcome to take part in the check as TÜV inspectors.
Perhaps a value for the two critical inspectors.
Mr. Prompt @Raketentoni and the margin king @Get_Rich_or_Die_Tryin .
The sticker has already been awarded in my test:
(without major complaints, the value can continue in my depot)
- Double-digit increase in turnover
- Net result increases even better
- Double-digit increase in free cash flow
- Net debt does not exist
- EBIT margin increases to 60 %
- P/E ratio falls, and PEG falls to 0.6x
The tuning measures were also all approved by TÜV.
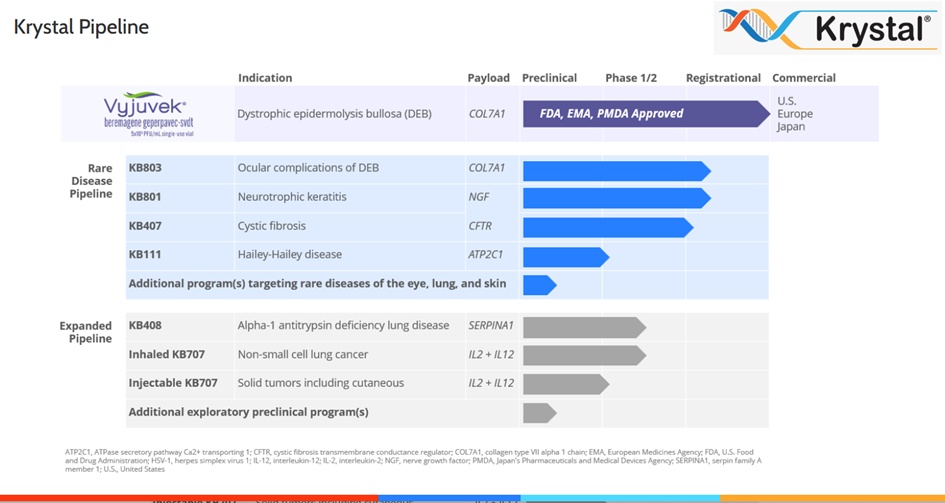
Krystal Biotech, Inc. is a commercial stage integrated biotechnology company. It is focused on the discovery, development and commercialization of genetic medicines for the treatment of diseases with high unmet medical need. The company's product candidates, which are in various stages of clinical and preclinical development, include VYJUVEK, KB407, KB408, KB707, KB105, KB104, KB104 and KB301. The commercial product VYJUVEK is a non-invasive, topical, reusable gene therapy that applies two copies of theCOL7A1 gene directly to DEB wounds. VYJUVEK is designed to treat DEB at the molecular level by providing the patient's skin cells with the template to produce the normal COL7 protein, thereby targeting the underlying disease mechanism. KB407 is being developed for the treatment of cystic fibrosis. KB408 is being developed for the treatment of alpha-1 antitrypsin deficiency. KB707 is being developed for the treatment of solid tumors. KB105 is being developed for TGM1-deficient autosomal recessive congenital ichthyosis.
Number of employees: 295
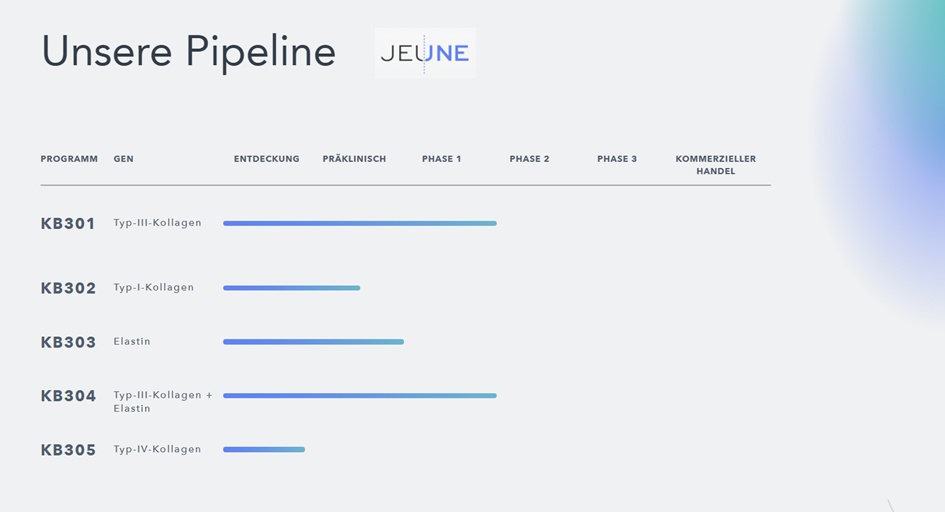
Jeune Aesthetics Pipeline
Jeune Aesthetics, a wholly owned subsidiary of Krystal Biotech, uses the same platform to treat aesthetic skin conditions.
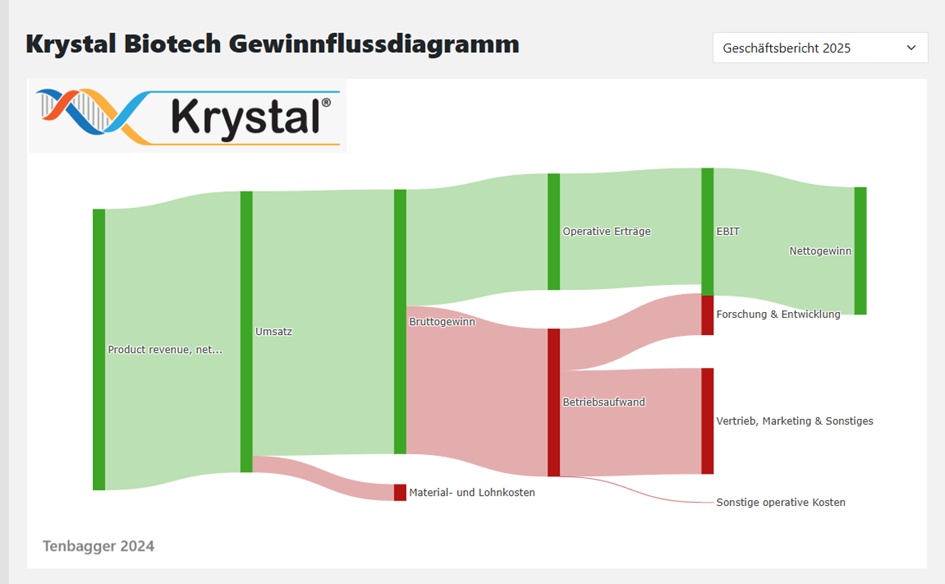
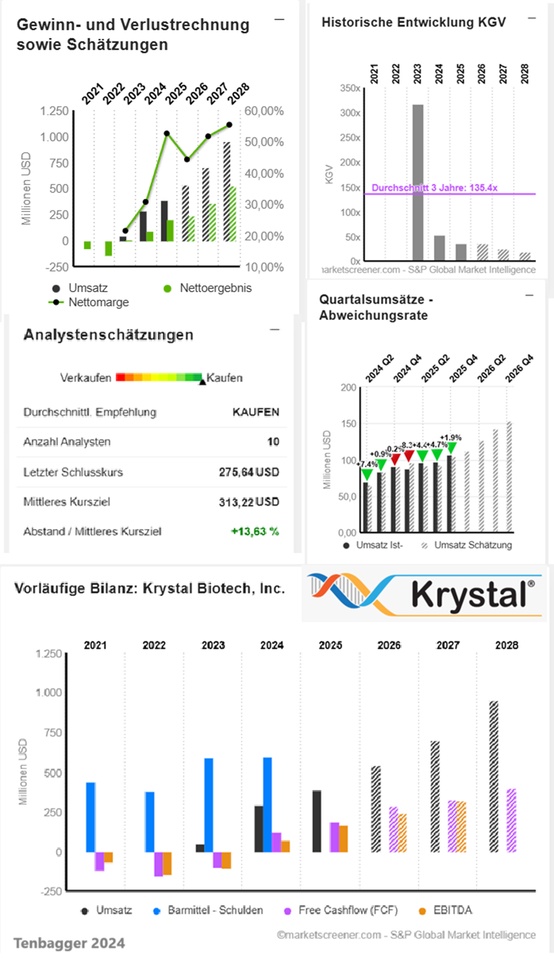
USD in millions
Estimates
Year Sales Change
2025 389,1 33,94 %
2026 541,4 39,13 %
2027 699,5 29,21 %
2028 953,4 36,29 %
Year EBIT Change
2025 161,3 145,52 %
2026 246,1 52,59 %
2027 369,8 50,26 %
2028 579,3 56,64 %
Year Net result Change
2025 204,8 129,74 %
2026 239,7 17,01 %
2027 361,8 50,95 %
2028 527,8 45,88 %
Net debt not available
Year Free cash flow Change in capex
2025 188,9 58,51 %
2026 286 51,39 % 8,175
2027 325,5 13,81 % 10,16
2028 398 22,27 % 22,27 %
Year EBIT margin ROE
2025 41,45 % 18,91 %
2026 45,46 % 15,93 %
2027 52,87 % 13,19 %
2028 60,77 %
Year Earnings per share Change
2025 6,84 128 %
2026 7,837 14,57 %
2027 11,06 41,13 %
2028 14,93 35,01 %
Year P/E ratio PEG
2025 36x 0x
2026 35.2x 2.4x
2027 24.9x 0.6x
2028 18.5x 0.5x
Market value 8,058
Number of shares (in thousands) 29,232
Date of publication 17.02.2026
Performance
1 week + 5.29 %
1 month - 0.62 %
6 months + 86.70 %
1 year + 59.01 %
3 years + 252.75 %
5 years + 249.40 %
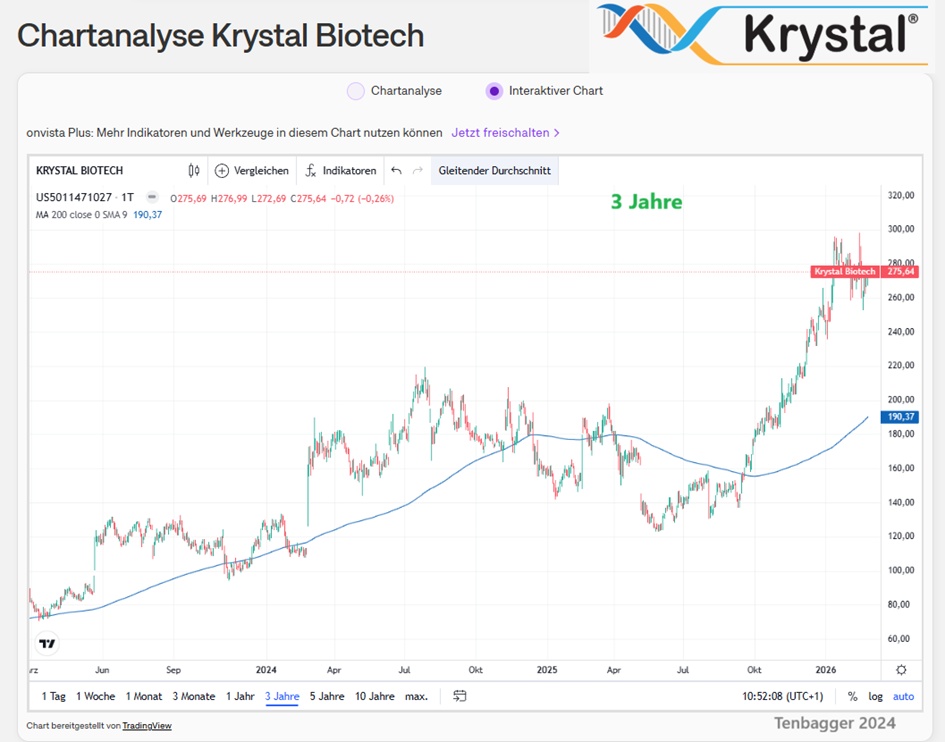
7 years + 1,083.00 %