6D·

3xGTAA - The big backtest (part 1)

Hello dear 3XGTAA fans,


I have set myself the task of writing a backtest of @Epi 3xGTAA going back at least 20 years, with accurate data and as few sweeping assumptions as possible. This is part 1 of this series. For now, this will just be about sourcing and data generation.


But now to the actual content:


To backtest the strategy to ~2000, we need all the assets that are necessary for the strategy.

These are:

- 3x Nasdaq 100

- 1x Bitcoin (BTC) *(from 2018)*

- 3x Gold

- 3x Silver

- 1x money market

- 7x USD / EUR

- 7x EUR / USD

- 2x Oil

- 5x US Treasuries (TLT)

- 3x Euro Stoxx 50


The basic process is the same for all assets - well, at least that's what I had hoped for, but more on that later. First, the data of the unleveraged asset is obtained and collected in raw format, converted into a standardized format and incorrect data is corrected. Then the required leveraged product is generated from the asset. Finally, the synthetic product is compared with the real ETF to ensure that all assumptions are correct.


Finding all the data as close as possible to the year 2000 is not particularly easy and sometimes requires creative solutions. From a simple API call to scraping websites, everything is involved, but I managed to find data for all assets.


How do you synthesize a leveraged asset?


The first thing you need for leverage is a reliable underlying asset: a net total return index for equities, the price for commodities, so far so clear.

You also need the interest rates of the country in which the product is traded (in our case usually USD). These are important as they represent the costs of the leverage (financing costs).

In addition to the risk-free interest costs, the issuers of a leveraged product must also pay an interest premium (spread), as these are not completely risk-free. This premium varies depending on the asset.

Of course, there are also the classic product costs - TER, should be a familiar term ;)

But now to a more specific factor, the drag. This is mainly caused by rolling losses in contango (when the futures price is higher than the spot price). When futures "roll" monthly, you have to sell cheap and buy expensive, which leads to constant losses. Conversely, rolling profits can arise with backwardation (future < spot). This effect should not be forgotten with gold and with oil it gets even crazier.

attachment

Everything is initially calculated in USD and later converted into euros if necessary.

Interest rates: I use US interest rates for the leverage products (initially 13-week T-bills, later even shorter-term rates such as overnight rates, as these are more accurate for leveraged currencies).


The assets in detail


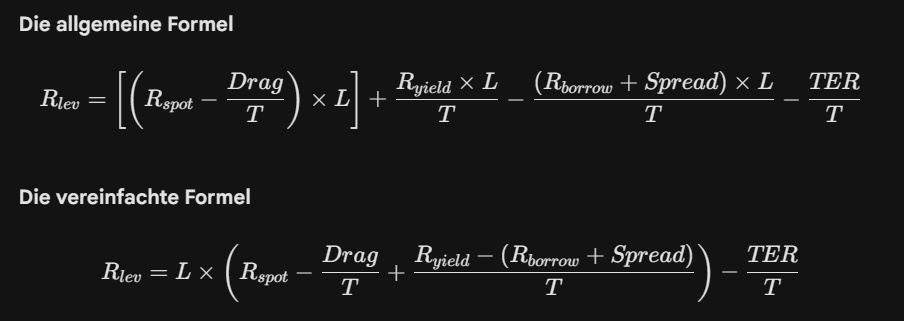
1x money market (synthetic)

First, I synthesized the European money market based on the ECB key interest rate and calculated back to 1999, as money market funds in their current form have only existed since around 2008. I then converted the result into USD in order to have a uniform currency later on.

The result looks like this:

attachment

Pretty boring, but that's a good thing. :)


It all started so nicely

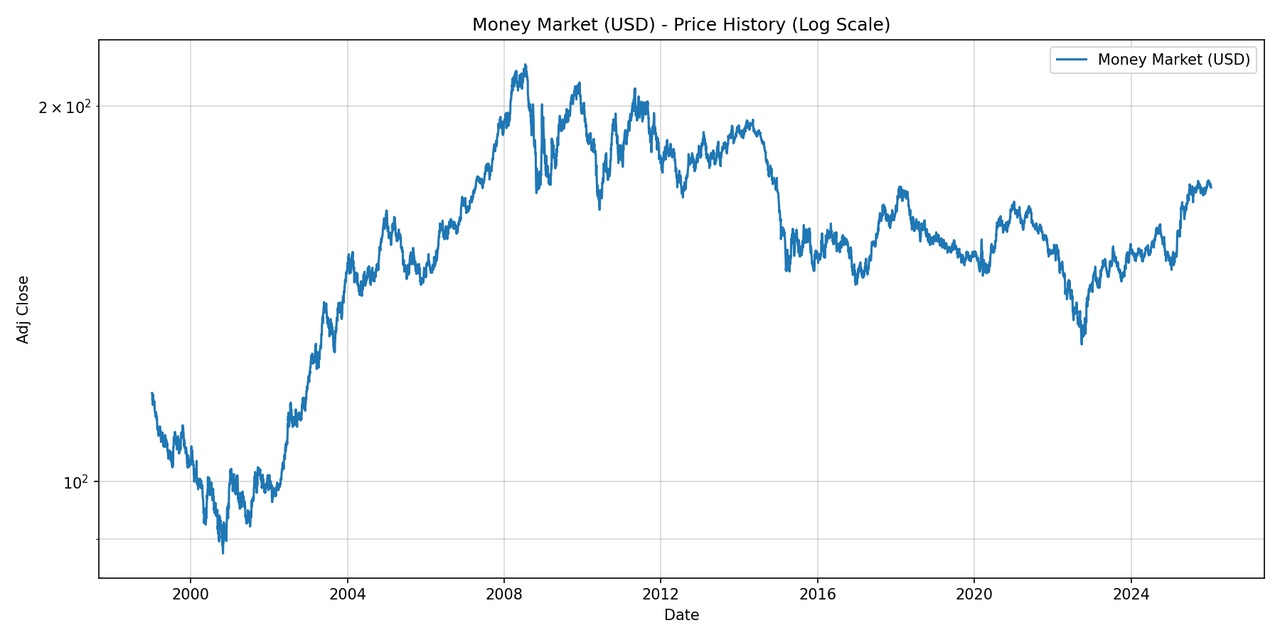
For Nasdaq, Gold I got the data directly from yfinance as it is very clean and goes back to 1999 - If only the other assets had been as easy. :(


3x Nasdaq 100

Leverage: 3

TER: 0.75%

Interest spread: 0.6%
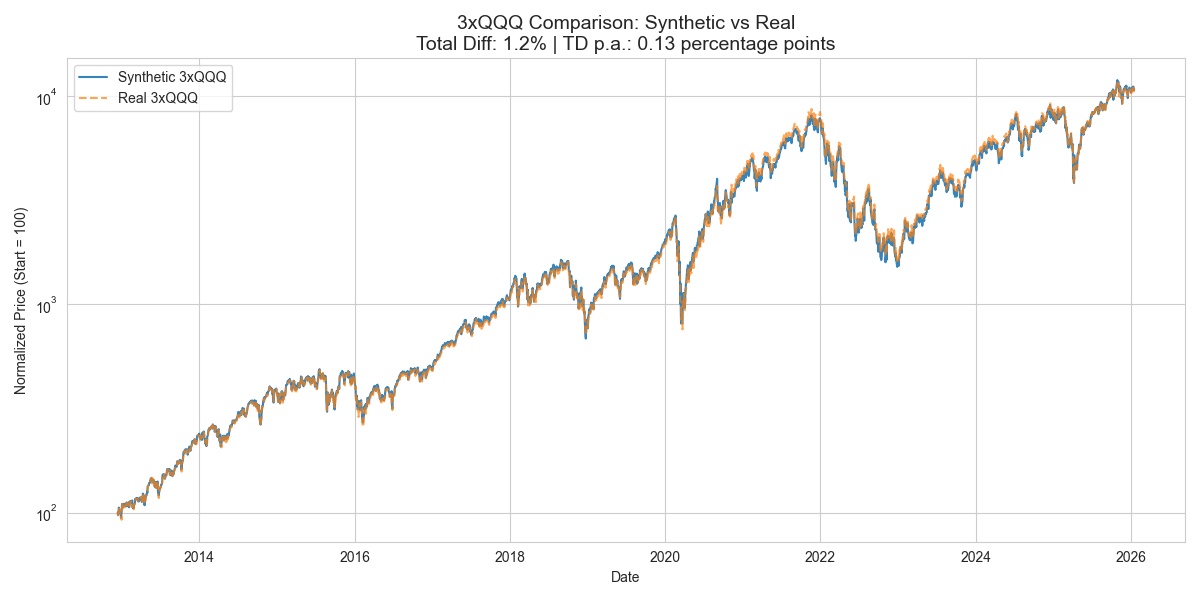
attachment


3x Gold

Leverage: 3

TER: 0.99%

Interest spread: 0.9%

Drag: 0.2%

attachment

As you can see, the result is pretty close to the real product.


1x Bitcoin

Technically, BTC is also in the "that was easy" group, but since it is not leveraged in the 3xGTAA, I am using the pure spot data here (available from 2014, backtest from 2018).


Forex

The currency rates from the ECB serve as the basis for this. There are special features in the interest rate spread.

This is where the problems began: Leveraged currencies work differently to equities. You hold one currency (yield, positive interest rate) and borrow the other (borrow, negative interest rate).

The standard formula had to be extended to reflect this "carry trade". see above.

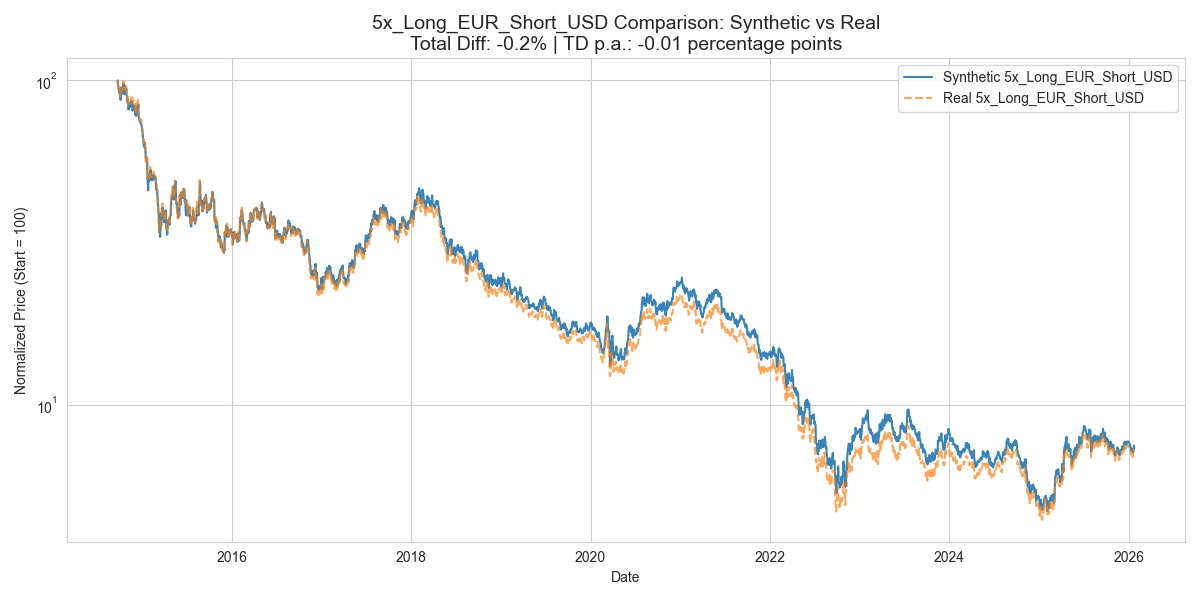
5x long EUR / short USD:

Leverage: 5

TER: 0.8%

Interest spread: 1.0% (Higher, as USD borrowing was historically more expensive/scarcer -> funding squeeze).

attachment


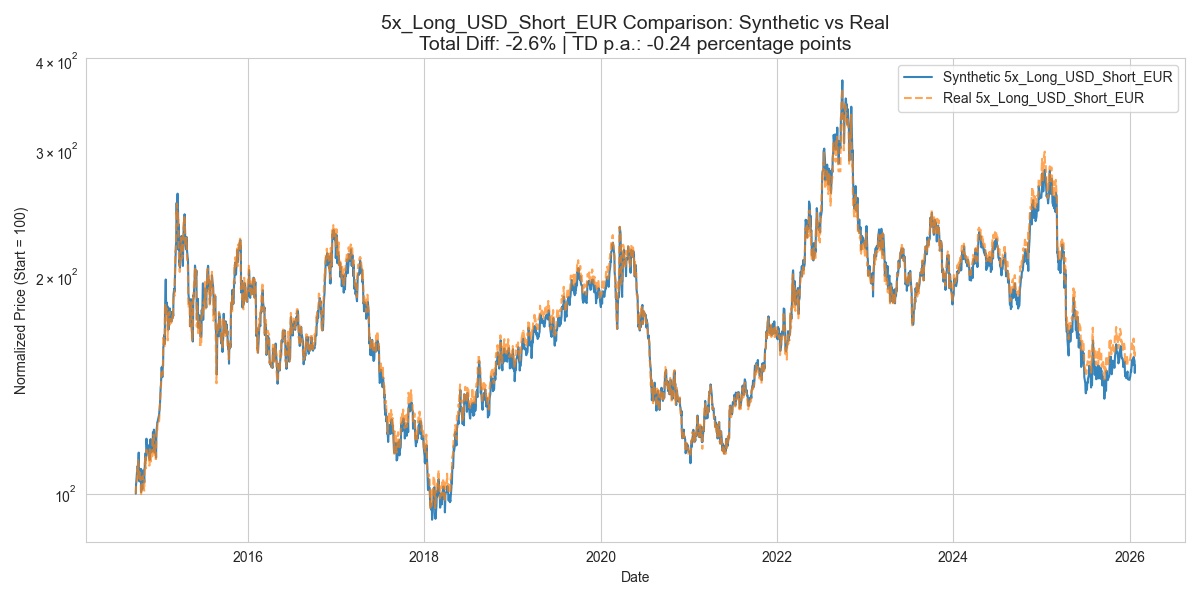
5x long USD / short EUR:

Leverage: 5 (and 7)

TER: 0.8%

Interest spread: 0.0%

attachment

(I have on the screen that in the 3xGTAA 7x currencies are used).


US Treasuries (TLT)

Edit: I also used the VUSTX to extend the data to before 2000 so it can be backtested to 2000.


Now the fun really started, unfortunately the TLT data is only available since ~2002 and then only as price and not as net total return.

Obtaining treasury data was particularly challenging as TLT only exists from 2002 onwards. In order to test the strategy up to 2000, a proxy had to be found.


Solution: VUSTX Backfill

I extended the history of TLT (iShares 20+ Year Treasury Bond) with the daily returns of VUSTX (Vanguard Long-Term Treasury Fund) back to 1999.


End difference: only -1.57% over 7 years.

attachment

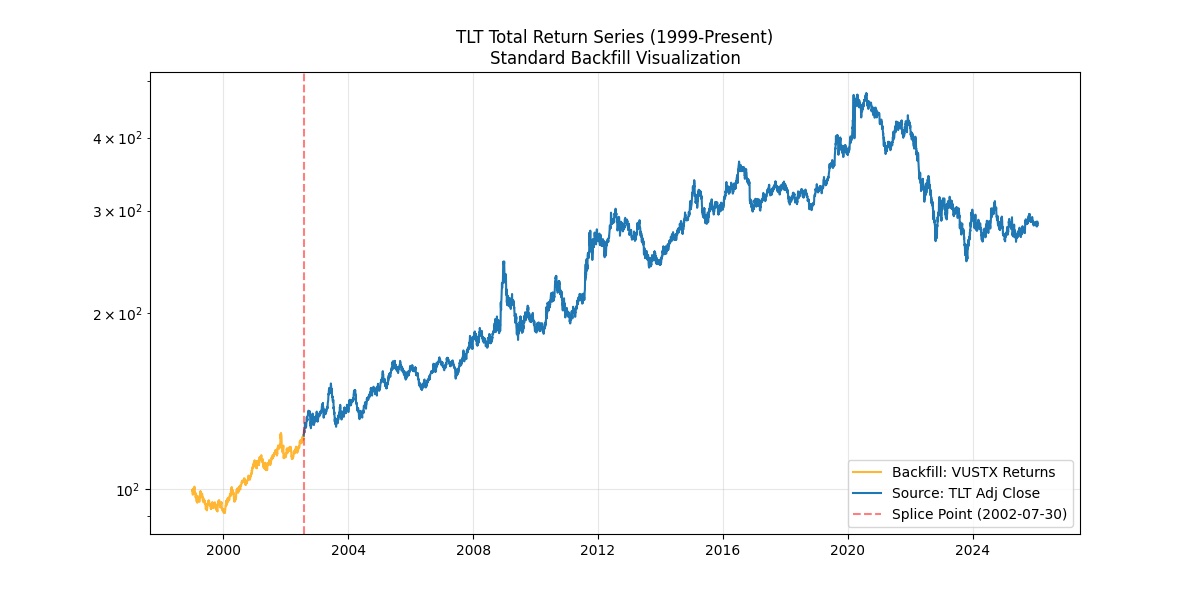
And no, there is no jump in the price, just a rapid rise.

5x TLT:

Leverage: 5

TER: 0.75%

Interest spread: 2.0% (Increased, as the options/ETP is very low).

attachment

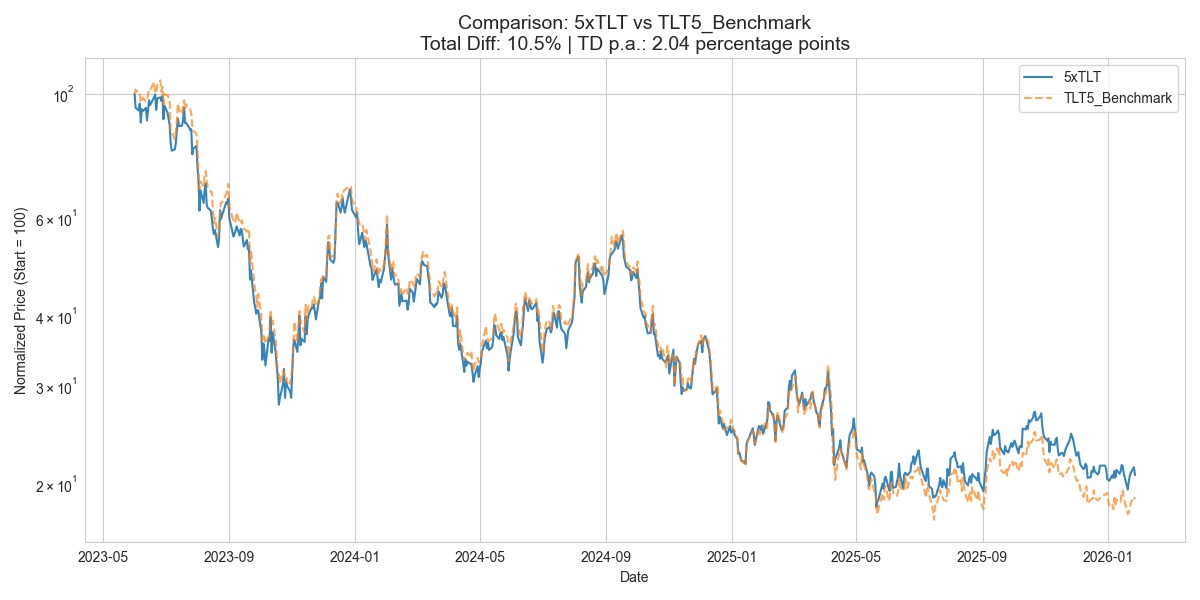
This is the shakiest product so far - but all in all still completely okay.


Oil (WTI)

Here I have again encountered problems. Not all oil prices are the same. There are spot prices and future prices and then there are the rolling costs. The problem: indices in which the rolling costs are already included are not readily available up to 2000. I have therefore calculated the rolling costs dynamically based on the spread between spot and USO (ETF).


Here are the historical roll costs (positive = loss/drag, negative = gain/yield):

From 2006 to 2008, the contango fell from 12.95% to 2.59%, before the super-contango (61.01%) followed in 2009. Between 2010 and 2013, costs fell from 15.26% to 1.26%, followed by the first backwardation in 2014 (-3.66%). In 2015 and 2016, the values rose again to up to 39.40%, fell to 10.48% in 2017 and briefly turned negative in 2018 (-4.81%). After 1.15% in 2019, corona caused another 47.10% in 2020 (super contango). The backwardation has continued since 2021, with values of -9.94% (2021), a record low of -22.37% (2022) and further negative values up to -13.00% (2025).


As you can see, costs fluctuate extremely. In crises (2009, 2020), rolling losses explode, while in periods of scarcity (2022), profits are even made through backwardation. A static assumption would be fatal here.


3x Oil:

Leverage: 3

TER: 0.99%

Interest spread: 1.5%

attachment

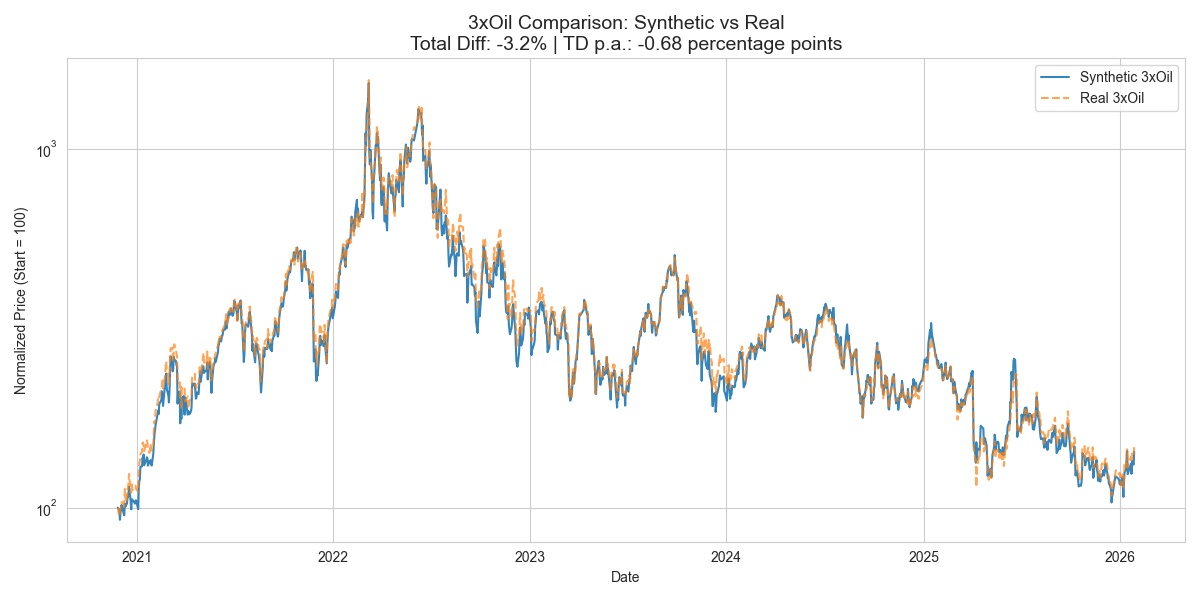
Comment: Oil should perhaps only serve as a warning and not be used as a core asset - but I will discuss this in more detail in part 2, right now it's just an idea of mine. (Yes, I am aware that the 3xGTAA only includes 2xWTI)
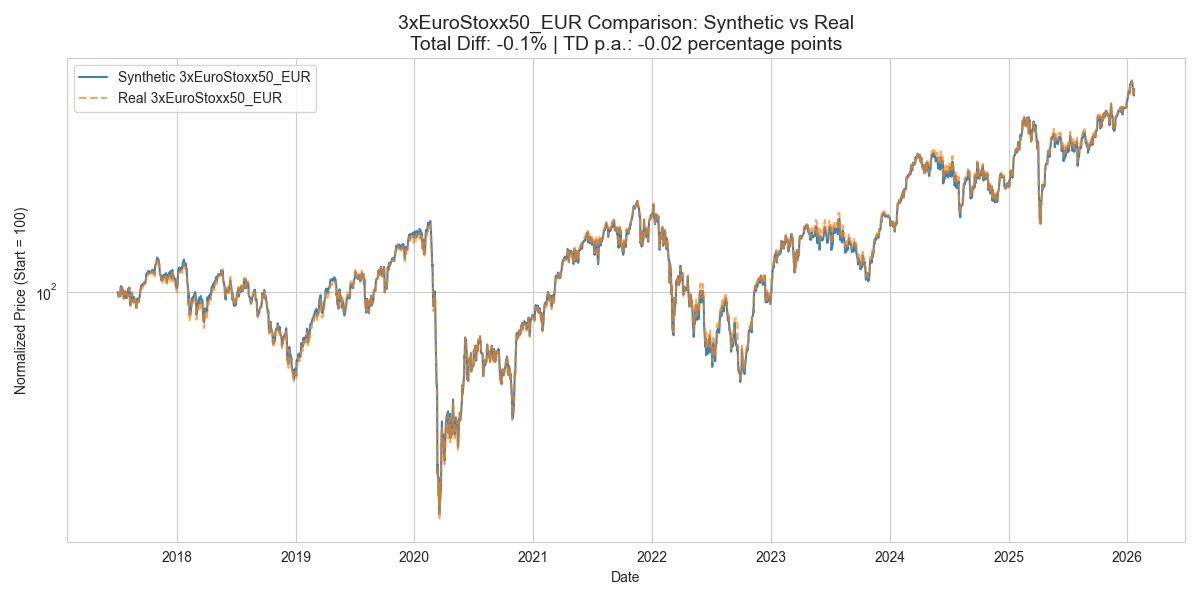

Euro Stoxx 50

To be honest, this is the nerdiest asset of all - the Euro Stoxx 50 is only available as a price index and not as a net total return. Therefore I first had to calculate the dividends of the index and then synthesize the NET Total Return.


Said and done, followed by the usual process - wrong thinking. You have to explicitly make sure that you leverage the index in EUR and then convert it to USD and not first convert it to USD and then leverage it.


Why: If you were to leverage the index already converted into USD (3x), you would also triple the currency effect (3x equity + 3x FX).

However, we want to simulate the behavior of an unhedged ETF: 3x equity performance + 1x currency effect. Therefore, the index must first be leveraged in local currency (EUR) before the result is converted once into USD.


3x Euro Stoxx 50:

Leverage: 3

TER: 0.8%

Interest spread: 0.7%

attachment

What's next?


In part 2 we will then look at the actual backtest and analyze and possibly optimize the performance of the strategy - but that won't happen for a few weeks, as I still have a few things to prepare. Perhaps I'll say a few words about black swans and survivorship bias before then, as this is also an important part of any leverage strategy.


I hope you enjoyed this little insight into the world of synthetic data.


PS: @Krush82 I will also backtest your momentum model and present the results to you. Unfortunately, the data quality of public APIs is not sufficient for this (data is too impure and listed stocks are often no longer available) - so I will probably have to spend money on it 😐. I will try to do all this quickly in one go after the 3xGTAA analysis.

103
56 Comentários

imagem de perfil
It's great that you're putting in the work and effort to set up the big backtest. I think a lot of people are looking forward to the result. And of course I'm also pleased that you want to test my model again. But first finish the 3xGTAA project :-)
11
imagem de perfil
I am very excited. Thanks for the effort. This @Epi did a backtest himself, but never trust a statistic that you haven't faked yourself 😁
6
imagem de perfil
@DonkeyInvestor Then why don't you do a back test?
Or is it just a test of your back?
2
imagem de perfil
@DonkeyInvestor Yes, but the assumption of a flat 3% interest cost is very shaky. Especially for oil and currencies.

Moreover, even then there are only backtests with parts of the assets up to 2000.

@Epi Correct me if I am wrong.
2
imagem de perfil
@Epi Why back? I test my wife's pastries regularly. If I test yours too, I'll get even fatter.
3
imagem de perfil
@DonkeyInvestor Ah, now your comment above makes sense. 👍
1
imagem de perfil
@Jesko You are basically right. Such backtests regularly require simplifying assumptions. It seems important to me that they give an approximate idea of how a model will behave in certain situations. You don't know the future exactly anyway.
imagem de perfil
@Jesko You have convinced me. What is your wikifolio called? I buy 🤪
1
imagem de perfil
@Iwamoto Take it easy with the young horses - the backtest itself isn't even finished yet =D
1
imagem de perfil
Top! Thanks for the effort. I'm looking forward to the results of your backtests, even if a little more went into the construction of the model than just looking in the rear-view mirror.
There were similar models that had better performance values but were either less stable (small changes in parameters = big changes in results) or economically less plausible.
It should also be noted that the influence of BTC is not insignificant.

But you can probably guess all that already. Therefore: 👍
6
imagem de perfil
@Epi That's exactly why I'm doing this, so that you can take a closer look. The entire tests are completely in Python and that opens up completely new possibilities in terms of information procurement.

Total loss of an asset.
The price of an asset only if the 3xGTAA holds it.
Effects of different SMA durations
Different dual momentum ranking methods
Inclusion of a daily SMA check when the momentum breaks away.

There are few limits to the imagination.

The first result is already there and it doesn't look amazing until 2017 - I think I'm still making a wrong assumption. I am currently selecting the assets as follows.
1: The asset must be above its 150 day SMA
2: Sort by the 1M + 3M + 6M +9M momentum

Is there a wrong assumption?
1
imagem de perfil
@Jesko Let me think about it. Answer will come later.
1
imagem de perfil
@Epi I only had an error in my code - but please check my assumptions.
1
imagem de perfil
@Jesko The assumptions seem correct to me. I would add the rule as to whether cash is part of the asset pool or treated separately.
1
imagem de perfil
Strong! The material is enough for a bachelor thesis 😉
I'm also very interested in your analyses 👍🏼
If you need a co-sponsor for the data of the single stock test, please get in touch. I'm only doing my tests very superficially because the deep dive is really time-consuming.
2
imagem de perfil
@Wealth-Accelerator I don't say no to sponsors =)
1
imagem de perfil
nice, I also just did a 3xGTAA backtest. I'll wait and see what results you get. I also leveraged synthetically, less complicated, but the results were still very good.
My leverage model:
lev_pct = pct_change * lev - (lev - 1) * (0.035 / 252)
So with a constant refinancing rate and without rolling, TER

The 3.5% ensures a conservative leverage. Most ETFs perform better

My entire backtest was quite sobering. I haven't tested the whole universe though, so if your results are very different I'll do it again
2
imagem de perfil
@SemiGrowth Does this mean that 3xGTAA is not such a great vehicle after all?
imagem de perfil
@Cyonix The returns are quite good, yes. But the maximum drawdown is as low as the S&P 500 (50%). Epi has only looked at monthly figures. Also, month end trading has been very lucky. I will do another post on this in the days to come
2
imagem de perfil
@SemiGrowth super thank you 🫶🏻
imagem de perfil
@SemiGrowth Rating monthly on the 15th via Corona works "super".
1
imagem de perfil
@Jesko That's the thing. I have tested all the possibilities and used the worst time
1
imagem de perfil
@SemiGrowth Believe it or not, I wrote almost 1:1 of your test for Spytips, so I know the values.
1
imagem de perfil
@SemiGrowth Thank you very much, I'm really looking forward to it. I also think that 3xGTAA is currently seen as a bit more magical than it is, even though I ride it as 2x myself.
2
imagem de perfil
@Simon_n will also be presenting my GTAA version soon. This also has an average lever 2
2
imagem de perfil
@Simon_n I think the GTAA is a good concept in itself, but the inclusion of BTC in 2018 distorts the results extremely.

I'm also not entirely comfortable with the 3-fold leverage, which I find a little too tricky to check only monthly.
imagem de perfil
@SemiGrowth I'm really looking forward to it!

How do you solve the problem that the assets lose momentum exactly after the evaluation for the whole month, did you choose a shorter period or a safety net? I'm really curious.
Ver todas as 12 restantes respostas
imagem de perfil
I am curious. Especially about Pre BTC times. So I'll give you a few coins that I got from @DonkeyInvestor at the time. So actually, you only got his.

I'm a big fan of data. The further back the better. Especially if you apply these backtests to existing models. Then you can quickly find out whether overfitting has been carried out.

@Epi Did you ever do some that went back less far?
1
imagem de perfil
@SchlaubiSchlumpf So far I think I still have a small "error" in my momentum calculation. But what I can already say is that it is better to be at triple leverage for all assets. 5x and 7x explodes too often - black swans and such.
imagem de perfil
@Jeskowhat do your backtests show so far? Period 2017-2027, CAGR ~ 15%, with MaxDD around 40%? The model only really ran mega from 2020/21 onwards according to our own tests. Momentum 1M+3M+6M+9M with SMA 150 also generally performed worse than SMA 200 with 1+3+5+8+10 lookback. However, I only used the data from yfinance and refrained from a synthetic replication.
1
imagem de perfil
@fastlane First of all, I haven't finished the QA of the code yet and only use 3x assets including the currencies and TLT, furthermore I assume you mean the performance from 2007 to 2017.
Also, I already considered a fee of a wikifolio (0.95% + 5% high watermark) and spreads 0.2% per trade.
Strategy Results (2007-01-01 - 2017-12-31):
CAGR (USD): 9.12%
CAGR (USD, after tax): 6.72%
CAGR (EUR): 10.13%
CAGR (EUR, after tax): 7.46%
Max Drawdown (USD): -52.19%
Max Drawdown (EUR): -54.24%
Final Value (USD): 26099.53
Final Value (EUR): 21762.31
1
imagem de perfil
@fastlane I just did another short run with 7xForex and 5xTLT:
Strategy Results (2007-01-01 - 2017-12-31):
CAGR (USD): 8.84%
CAGR (USD, after tax): 6.51%
CAGR (EUR): 9.85%
CAGR (EUR, after tax): 7.25%
Max Drawdown (USD): -63.36%
Max Drawdown (EUR): -65.13%
Final Value (USD): 25374.14
Final Value (EUR): 21157.46
1
imagem de perfil
@fastlane The problem with currencies is that you have to calculate the leverage somewhat differently here than with other assets. See the two formulas in Figure 1 of the article. If you don't do this, they look significantly better than they actually are. Irrespective of this, I would not use 7x leverage, as it always ruins everything with enough time.
1
imagem de perfil
Great. Thank you 👍
1
imagem de perfil
Awesome! Great work!
1
First of all, thank you very much for your work. I have a little something to add. If you have the time, you can take a look at the plotly library. I used to use matplotlib, but I find the interactive things you can make with plotly quite practical and have actually switched completely in the meantime.
1
imagem de perfil
@Lukas10999 I'll take a look, thanks for the tip!
imagem de perfil
Very cool!
1
imagem de perfil
Respect for the work. I will be following it closely!
1
imagem de perfil
Very cool, thank you! Looking forward to the other parts
imagem de perfil
Which broker do you use to leverage indexs? I am guessing that a leveraged etf is not efficient enough for this
imagem de perfil
@jonatan LETFs are sufficient, so you can use any brokerage Account that you like - but I assume that you use a Wikifolio for Tax reasons.
Participar na conversa