16H·

Profit growth: when it counts, when it is deceptive

Reading time: approx. 3-4 minutes

attachment

Amazon barely reported any profits between 2010 and 2015. The P/E ratio was in the three-digit range, at times not even meaningfully calculable. Anyone who looked at traditional valuation ratios avoided the share. And yet $AMZN (+3,03%) delivered one of the strongest returns in the entire US market during this phase.


What was actually working there?


Not the distribution, there was none. Nor was it a simple revaluation. Above all, something more fundamental: the market priced in profit growth that was not yet visible but was then delivered, driven primarily by AWS and the margin shift in the retail business. Those who understood this early on did not look at the current P/E ratio. They asked what the company would earn in five years' time.


That sounds simple. It is not.


Profit growth as a driver of returns only works under certain conditions.


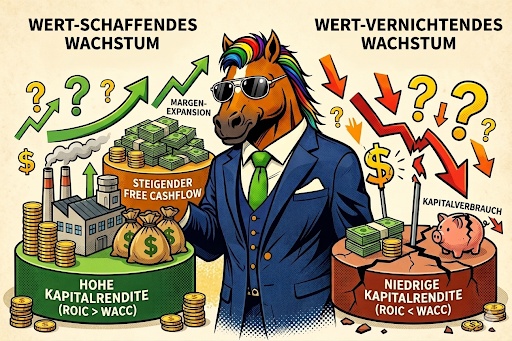
The most important one is that the return on invested capital must be above the cost of capital. Growth without this condition does not create value, it destroys it. That sounds trivial. But it is surprisingly often ignored.


Then there is the question of the margin structure. Expansion must be built into the business model, not into the economic upswing.


And the addressable market must be large enough to keep the growth window open. Short-term growth in a small market is not a profit driver.


Amazon fulfilled all three conditions. Between $META (+2,51%) between 2022 and 2024, it was a different path, but the same mechanism. No long reinvestment cycle, but a hard efficiency cut. The operating margin rose from under 20 percent to over 35 percent in two years. Free cash flow has more than doubled. Multiple expansion has helped, but the key driver has been a massive increase in profits.


The opposite is just as instructive.


$SNAP (+1,26%) had real user growth. The revenue curve was impressive. But the company never structurally achieved a return on capital above the cost of capital. The growth consumed capital without increasing it. Today, the share is trading well below the IPO price. $ZAL (+1,72%) is the European equivalent. Sales multiplied, return on capital sobering, free cash flow weak, share price sideways for years.

Both companies have grown. Neither has created value.


Before I invest in a company where profit growth is a key driver of returns, I go through a few questions.


Is the ROIC above the cost of capital, ideally over 15% in my estimation?

Is the free cash flow growing faster than sales, which indicates operating leverage?


Is the margin path concretely comprehensible or only vaguely promised?


And is the addressable market sufficient for at least five to ten years?


On the other hand, if sales are growing but free cash flow is stagnating, this is a clear warning signal. The same applies if ROIC remains below the cost of capital despite years of investment, or if growth is financed through dilution.


The key figures themselves are public.

Something else is more difficult: trusting the mechanism in a situation like Amazon 2012 or Meta 2022 when it is barely visible in the current figures. This is not a question of analysis. It is a question of conviction.


The next article is about what happens when neither profit growth nor multiple expansion clearly dominate. And why understanding the cycle makes all the difference in such phases.

26
17 Comentários

imagem de perfil
Back then I bought Amazon $AMZN and the spin-off $PYPL. As always, too little and PayPal already sold as a yield brake after years.
•
2
•
imagem de perfil
@Smudeo strong move. When did you get into Amazon?
••
imagem de perfil
Thank you for this new article 👍🏼
•
1
•
imagem de perfil
Thank you dear, again a lot of added value. For many people, my business ideas always seem to be too numbers-heavy. But your ideas always show us how important it is to look at these figures when investing. Now I will also add ROIC to my next presentations.
•
1
•
imagem de perfil
@Tenbagger2024 I think it's really great how many companies you look at and prepare. That's a lot of work you put into it.
I personally attach a lot of importance to key figures such as ROIC, free cash flow development or margin structure in my analysis. I don't believe that everything can be calculated. It doesn't. But I think they help to distinguish growth from real value. That is often the decisive difference on the stock market.
I look forward to more ideas from you!
••
imagem de perfil
@Liebesspieler Thank you dear. I often get the impression that many people don't even realize it. How much work it is. And even with AI, it always means checking sources and facts. That's why I usually provide the AI with the sources myself. Thanks to you, I now almost always include the FCF yield and pay more attention to it. But I'm also somewhat ambivalent about free cash flow. Many good companies also have large fluctuations here. With high interest rates, I think it might also make sense to minimize free cash flow and generate capex through this. Without going into debt. In my opinion, free cash flow is not for the piggy bank, but for working with it. And so I don't really know to what extent an increase is interesting here. I think the secret is to work with free cash flow in a meaningful way and to always look at the figures as a whole
•
1
•
imagem de perfil
@Tenbagger2024 Very good point, and I think it's great that you are now actively incorporating FCF Yield.
Personally, I'm a little less ambivalent about free cash flow. Of course it fluctuates, that's true. But that's exactly why I prefer to look at the trend over several years rather than at individual periods. In my opinion, if FCF and sales grow in the same direction over time, this is a strong signal that the business model is really working.
On the subject of interest rates, I would be cautious about describing the current level as high. The historical average of the US prime rate is somewhere between 4 and 6 percent. In the 1980s, it was 20 percent at times. What we've seen over the last ten years has been the exception rather than the norm, as I understand it. This perhaps changes the perspective on how to categorize capex decisions
••
imagem de perfil
@Liebesspieler You're right . I remember those days when banks advertised savings accounts and high interest rates
•
1
•
imagem de perfil
@Tenbagger2024 but @Soprano made an interesting post earlier. In which he writes that he has the impression that fundamental key figures, and I have the impression with the valuation key figures. That both are increasingly being pushed into the background by electronic trading. The question is whether it is just a perception on our part or whether there is something to it. And whether it might even be a harbinger of a bear market. .
•
2
•
imagem de perfil
@Tenbagger2024 exciting discussion. Thank you for that 🙏

It is difficult to disagree with the observation that fundamental indicators have become less important in short-term price action. Algorithmic trading, momentum strategies and passive flows often move prices independently of valuation. This is an effect that I also notice.

However, I would not overestimate this as a bear market indicator. Algorithms have dominated short-term trading for over a decade, and in that time there have been both strong bull markets and sharp corrections. What makes me personally think more of a bear market are stretched valuations without earnings growth behind them, credit cycles or macroeconomic shocks.

Perhaps the more interesting question is actually a different one: If fundamental metrics become more irrelevant in the short term, isn't that precisely an opportunity for investors with a long time horizon? After all, these inefficiencies have to be priced in at some point.
•
1
•
imagem de perfil
@Liebesspieler Yes, of course, I currently see opportunities in the software sector I mentioned earlier. But here the sector is driven by a lot of fear and uncertainty. And who among us is able to assess which models will benefit and which will lose out
••
imagem de perfil
@Tenbagger2024 I am somewhat ambivalent about the software sector as an example of this thesis. It is actually one of the most closely watched sectors of all. Institutional coverage is enormous, analyst coverage is dense, valuation models are constantly updated. I find it difficult to speak of inefficiency due to algorithms.

In my opinion, what you are describing is something else: fundamental uncertainty about which business models will gain or lose from AI. That's a legitimate and difficult question. But it's not a market structure problem, it's simply complex analysis.

Better examples of the original point would probably be smaller second-line stocks with low liquidity, cyclical sectors where momentum strategies are exaggerated, or companies in complex transformation phases. Software tends to be the opposite, which is what makes it so difficult.
•
1
•
imagem de perfil
@Liebesspieler The market remains exciting. It's hard to imagine what the market would look like without the AI story given the geopolitical uncertainties.
•
1
•
imagem de perfil
@Tenbagger2024 You make a good point there. The AI story has actually worked as a counterweight to geopolitical risks over the last two years. Without this narrative, multiples in the tech sector would probably have come under significant pressure.

But this is precisely where I see a certain ambivalence. When the market is so strongly supported by a single narrative, it makes it more vulnerable, not more stable. The crucial question is then: what happens if AI expectations are even partially disappointed, while the geopolitical risks remain?

Not necessarily a crash scenario. But it may explain why valuation discipline is more important right now than in phases when several independent drivers are supporting the market.
•
1
•
Ver todas as 3 restantes respostas
Participar na conversa