
Today we are going back into the chart-based deep dive. Something that I have noticed again and again is the talk of a "falling knife" under various purchases. One should wait for the bottom to form first, without being able to tell the creator exactly what it is. That is why I am now going to go into this topic, where I believe there could be a legitimate bottom formation. The fact is that there is never any certainty on the market, only a game of probabilities. The higher these are, the better. The best way to profit from trends over 1, 2 or 5 years is to use the weekly chart and the 50-week line (shown in red below) as the main average to work with. This always serves as a mean reversion in a bullish trend. As long as the price is above it, the trend is intact. If the price breaks sustainably below it (2-3 weekly closes below it), the trend is broken. One asset that adheres particularly well to this is Bitcoin. Another point to increase its probability of success and to create a kind of confirmation is the weekly RSI. Here, too, there is an average line where the indicator is either above or below the average. These two values result in 4 possible states:
Up - Up (price and RSI above average) (trend following)
Up - Down (price above average - RSI below average) (fake-out risk)
Down - Up (price below average - RSI above average)
Down - Down (price below average - RSI below average) (wait and see, "falling knife")
The up - up scenario is virtually nothing other than the trend-following strategy, which is practiced by some. The exact opposite case (down - down) is the so-called bottom fishing. This is exactly where we find the purchases posted on Getquin, where people supposedly reach for the falling knife. I will now list the examples.
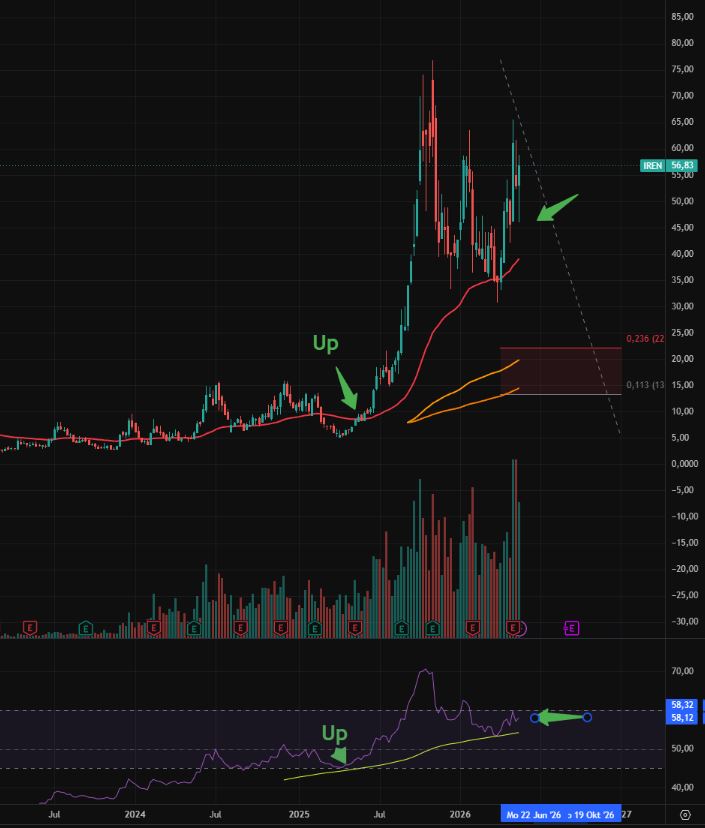
Up - Up (50s in red - RSI average yellow)
Currently: Krypro Miner, Energy, Semis
IREN
AMD
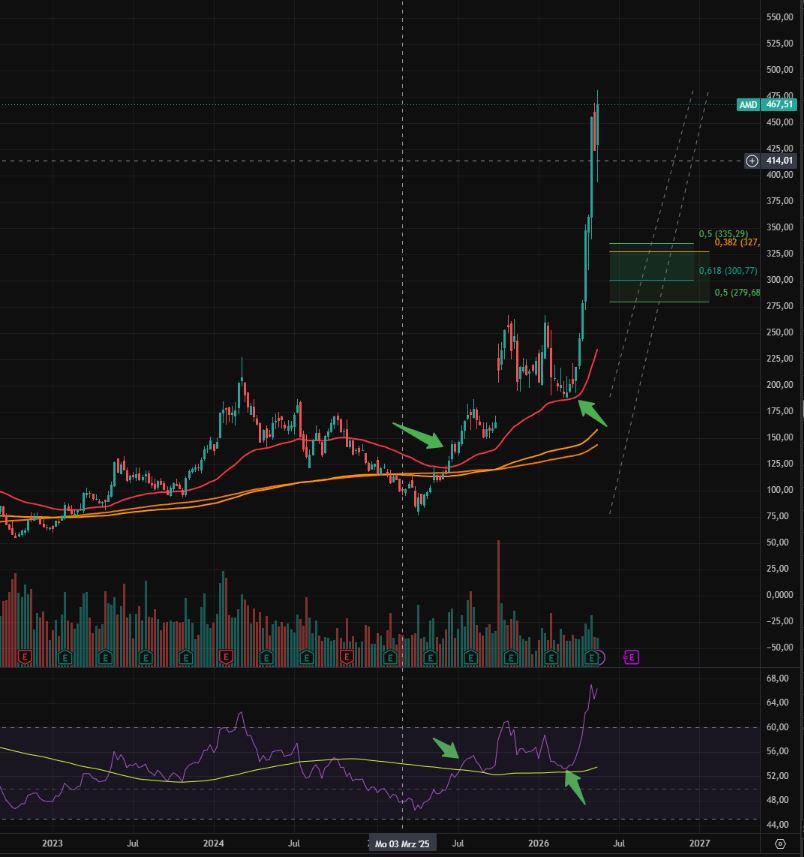
Such values are a trend follower's wet dream for a certain period of time. As long as both are above it, it is an easy hold.
But now we come to the main focus, the "falling knife" assets.
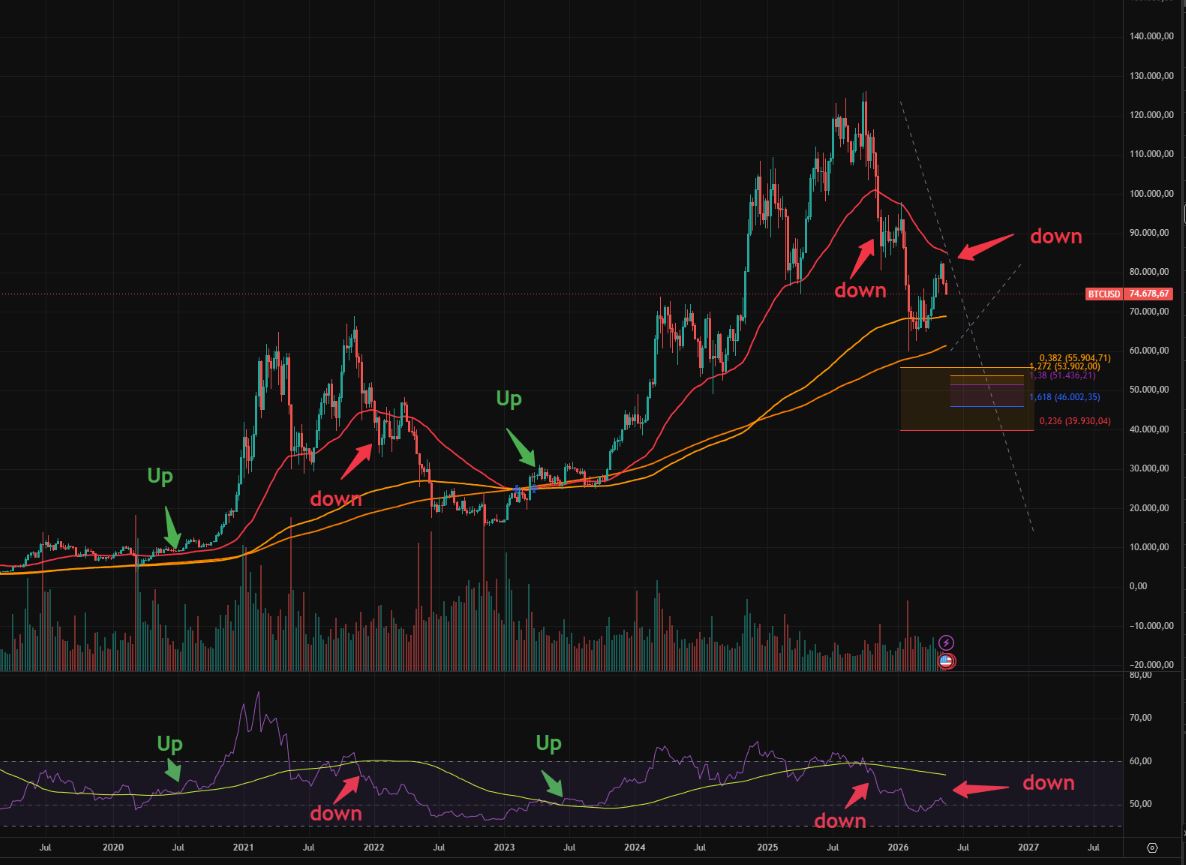
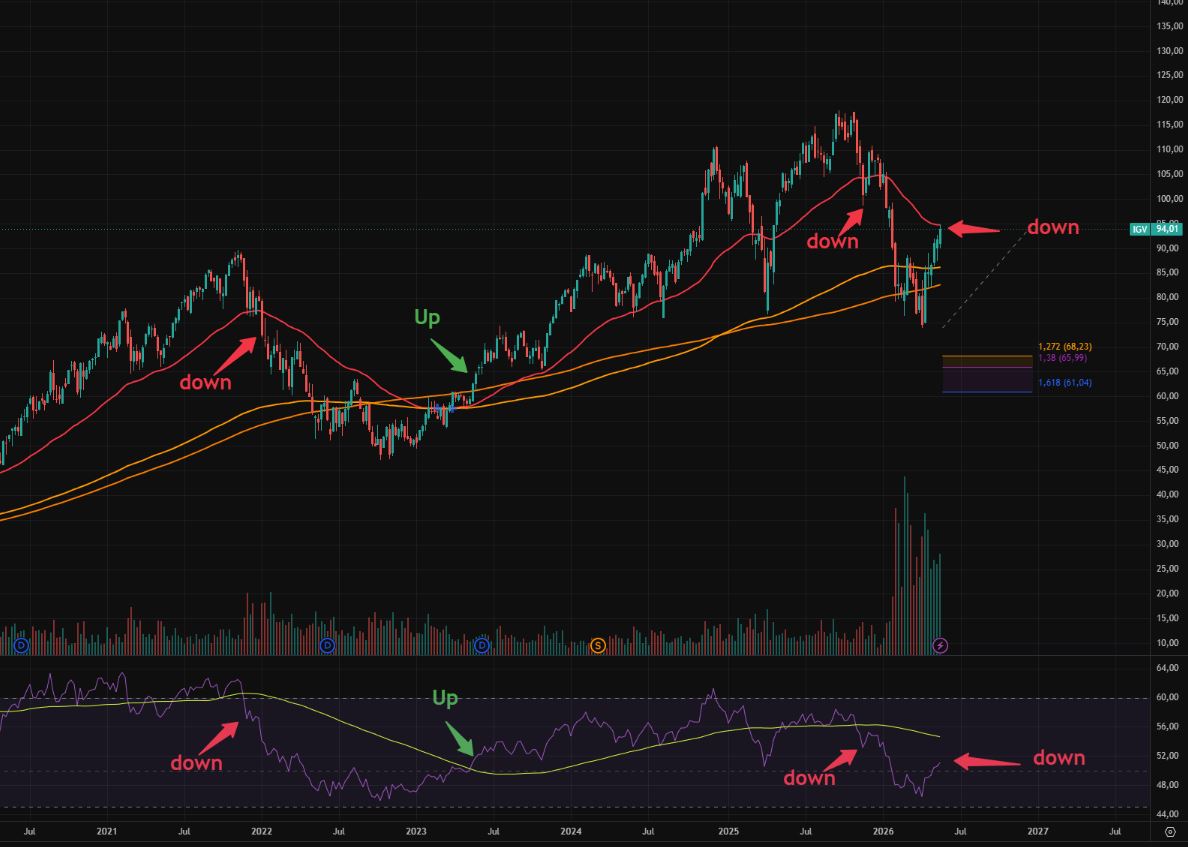
Down - Down (50s in red - RSI average yellow)
Currently: software, cloud, Bitcoin, Ethereum, e-commerce, neo-banks
Bitcoin (runs like Swiss clockwork)
Here you can see particularly well that up-up are always buy signals and down-down are always sell signals. As long as a value is in a down-down state, you can speak of a "falling knife" zone. You can buy here, but you don't have to. The technical chart confirmation, at least with a higher probability in my opinion, is always only present when there is a change to an upward trend. Bitcoin, software, etc. would therefore still not be a buy or buy later.
Bitcoin
IGV - Software ETF
SoFi
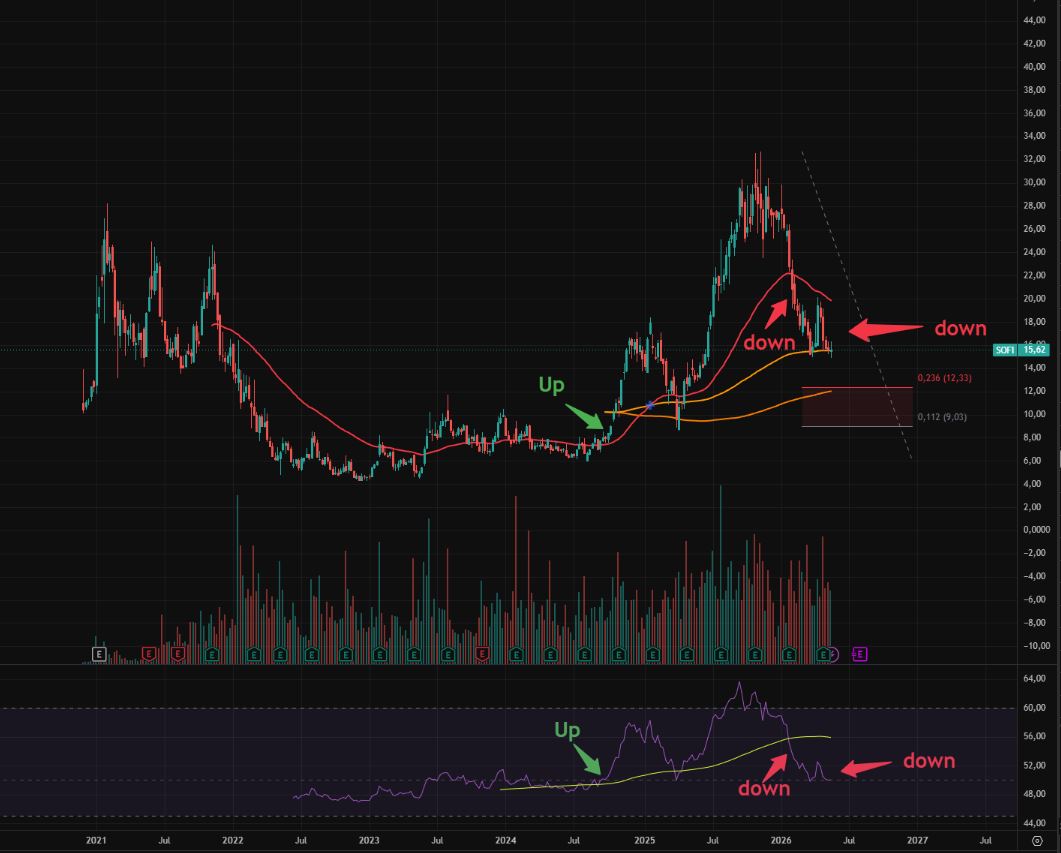
Wait and see, drink tea, wait for Up-Up
Special cases :
Up-Down
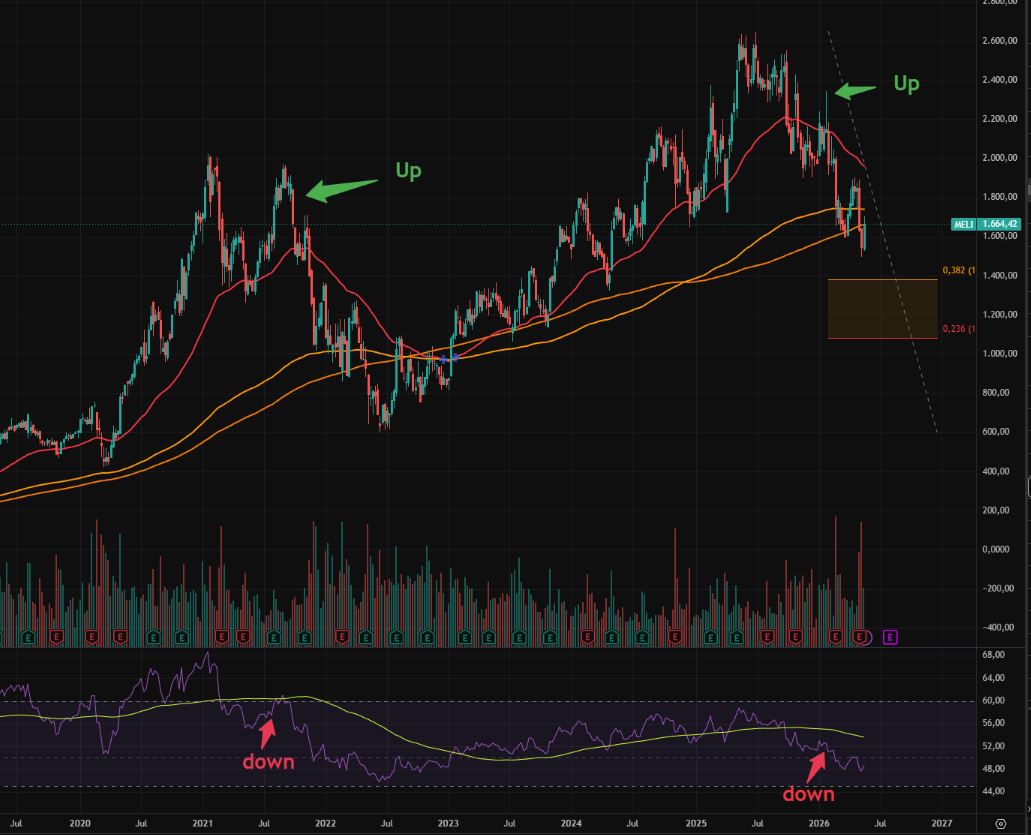
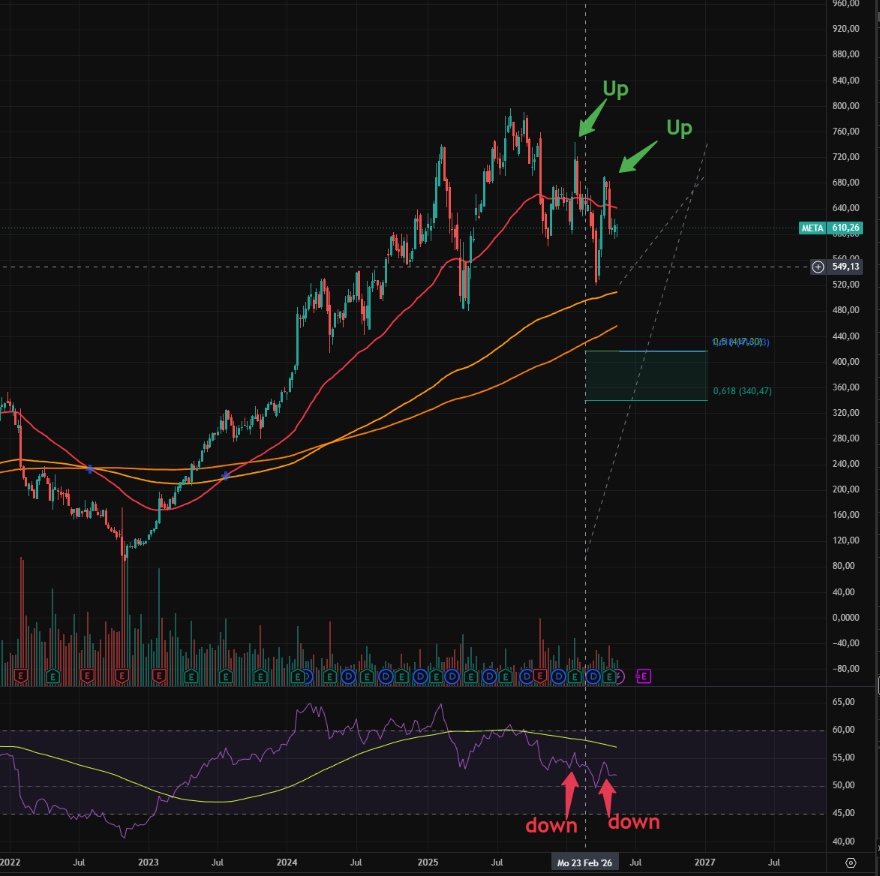
Cases where the price is above the 50 but below the RSI average have, in my opinion, a higher probability of "fake-outs" and are very deceptive and dangerous for buying or re-buying:
Example MeLi 2021 and 2026 (fake-out confirmed)
META (possible fake-out), even double
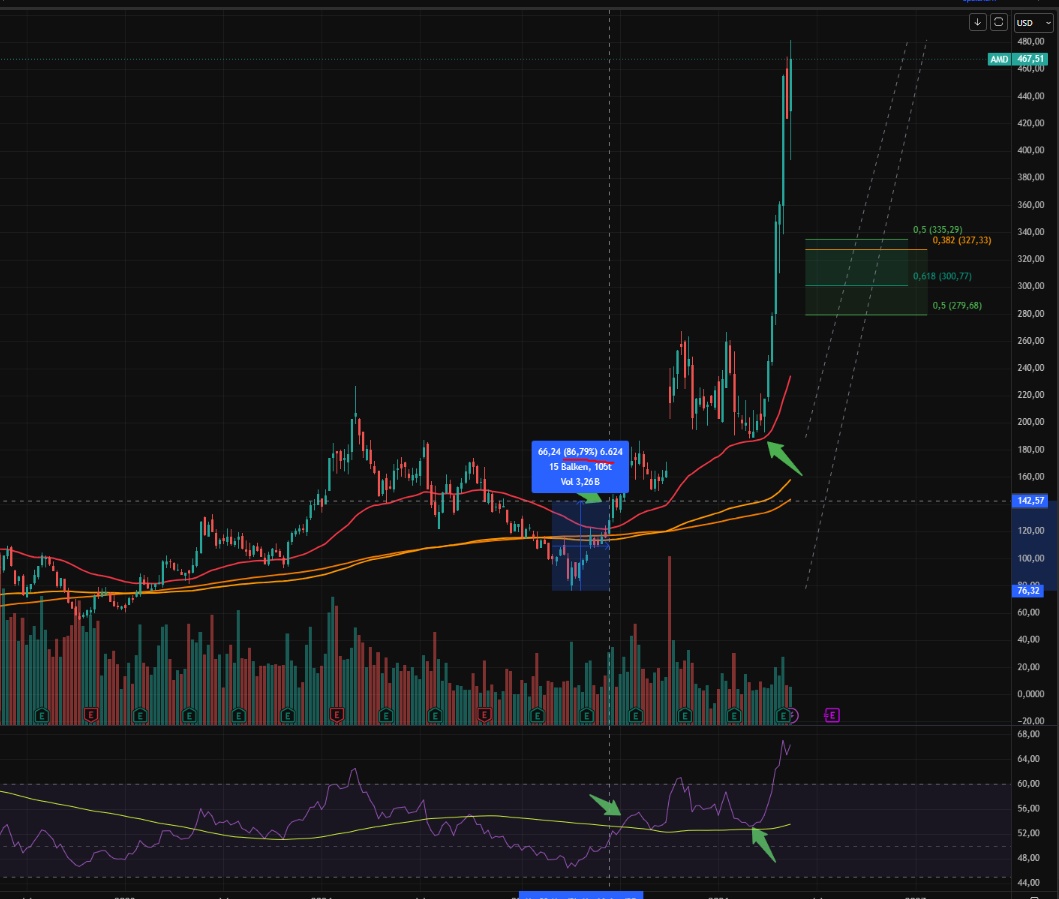
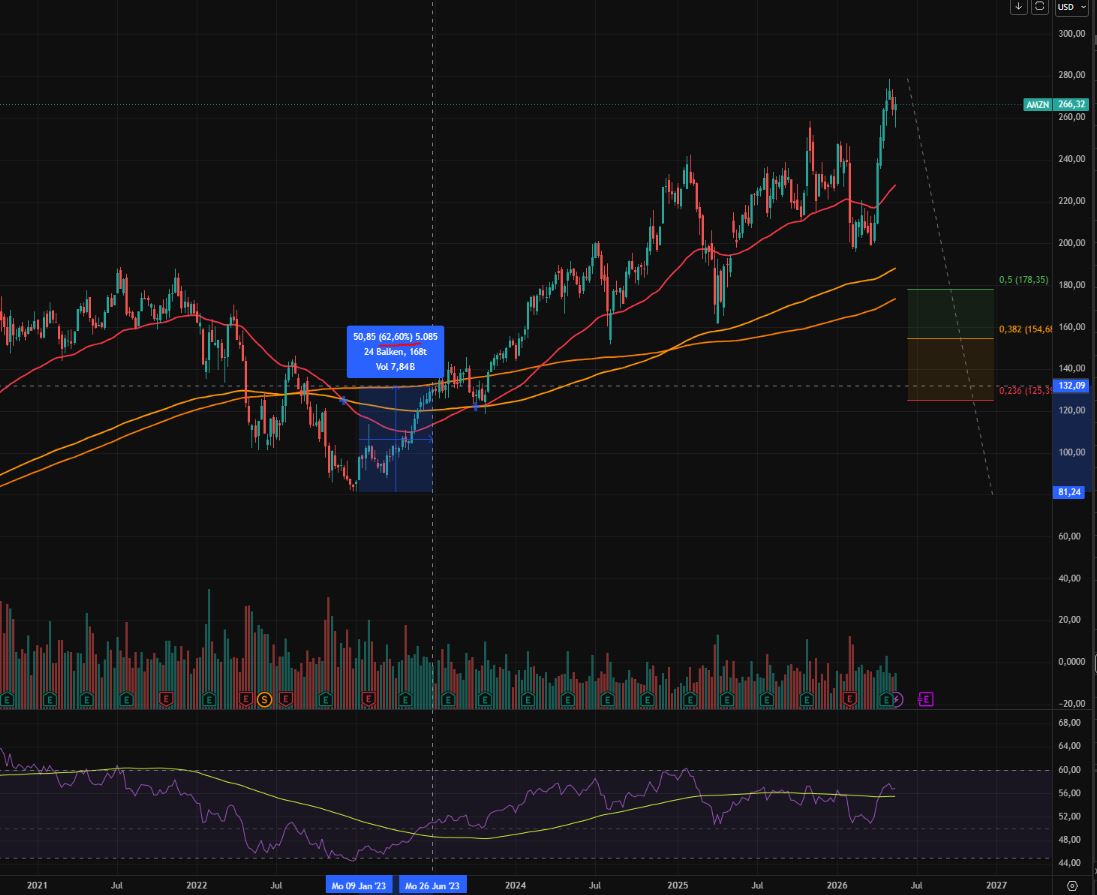
So how could we act now? Bottom fishing is fine if you accept further downside. If, on the other hand, you quickly get your panties in a bunch during corrections, the up-up signal would be something to work with. However, the up-up signal also has a price, namely the distance from the bottom to the up-up buy signal. I've looked through tons of charts and the return you give up is usually between 50-100%. It's more or less a deal: you forgo the first 50-100% return in the next trend, but you buy a kind of confirmation through the buy signal. Finally, here are a few examples of "yield sacrifice":
Bitcoin 2022
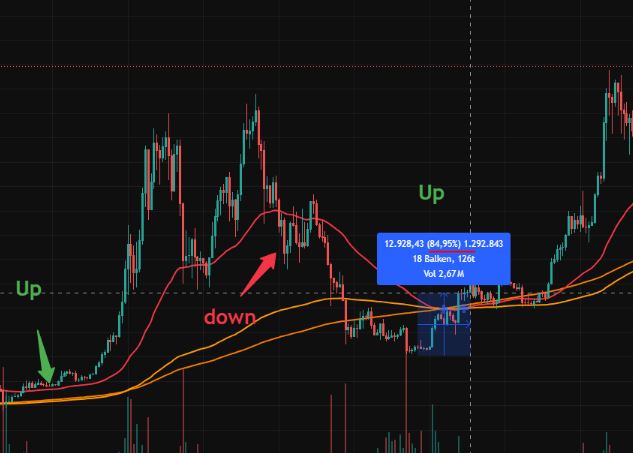
AMD
Amazon 2023
What do you think about this topic?
Do you also have indicators for buy signals or similar?
What is the bottom formation for you?
But for now, have a nice Whitsun. The weather is calling.

