2Mês·

More return, less risk with the 2xSPYTIPS strategy!

1) The plan


As some may already know, I am pursuing a dual momentum strategy with two ETFs from each of four asset classes (GTAA). In order not to be solely dependent on the success of this strategy, I am looking for another strategy that works largely independently and autonomously.


The perennial favorite B&H ACWI is out of the question for me, as a long-term return of 6%pa return with a risk of 60% max. drawdown is not a good risk/reward ratio in my eyes. Even the king of all indices S&P500 has (since 2000) only a performance of 7.6%pa with a max. drawdown of over -50%. In both cases, the return succession risk is so high that the safe withdrawal rate (approx. 3%pa) is too low for early financial freedom.


So I am looking for a strategy that offers: 1. a continuous double-digit return (>10%pa); 2. a psychologically easily bearable risk (<20% max. drawdown); 3. a cheap and convenient implementation similar to B&H ACWI (<2 transactions per year) and 4. a simple structure (1-2 ETFs). In short: I want a simple model that is systematically invested in bull markets and avoids bear markets.


In this post, I'll not only show you a brand new and largely unknown strategy that does just that, but also the thought process behind it. So you not only get the fish, but also the fishing rod. Interested? Then buckle up!


2) The classic: 200-day strategy


The classic approach to avoiding bear markets and participating in bull markets is trend following. Of the trend-following strategies, the 200-day strategy is probably the best known:


Rule: Buy an S&P500 ETF if the S&P500 is trading above the 200-day moving average at the end of the month. Otherwise, hold cash.


Result (since 2000): Return 8.1%pa, risk -22%maxDD. https://www.portfoliovisualizer.com/tactical-asset-allocation-model?s=y&sl=FYqXW8M7rFydJjq30MbKy (the following backtests are in USD and go back to the year 2000, if you want to see the whole thing, just create a test account)

attachment

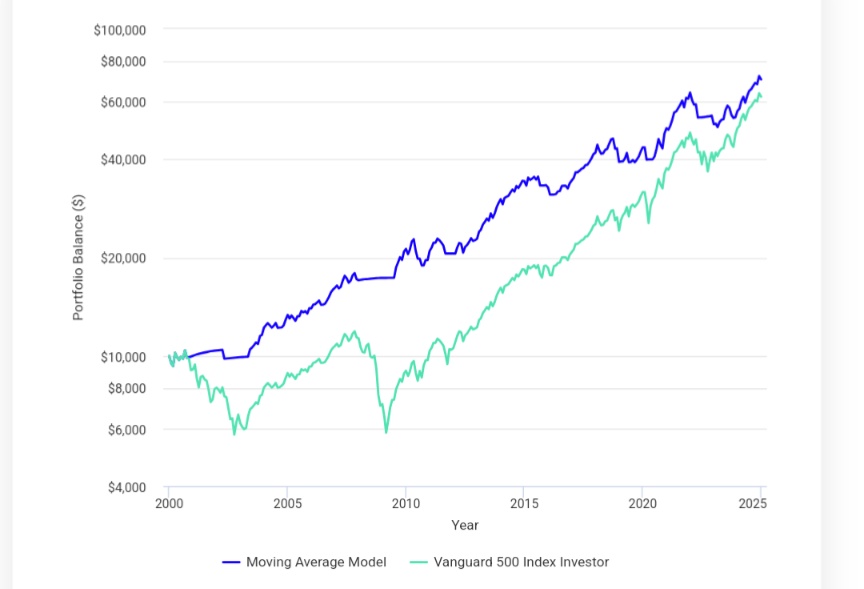
Evaluation: The 200-day strategy meets the requirements for risk and simplicity, but not for return. Why? With trend-following strategies, you don't catch the highs or the lows, but only the "middle" trend phases. You avoid the crashes and are present in the boom phases, but miss the major trend reversals and underperform in saw markets. The result is less volatility, but no higher returns. This can be tackled with the leveraged 200-day strategy.


Rule: Buy a 2x leveraged S&P500 ETF if the S&P500 is trading above the 200-day moving average at the end of the month. Otherwise, hold cash.


Result (since 2000): Return 12.2%pa, risk -42%maxDD. https://www.portfoliovisualizer.com/tactical-asset-allocation-model?s=y&sl=1GXyWqmgMP0qn1Mxnq8B7B (I replicated the 2xS&P500 ETF synthetically by leveraging the index 2x with 3% refinancing costs - this roughly corresponds to the ETF)

attachment

Evaluation: The return now meets the requirements, but the risk no longer does. Due to the refinancing costs and the leverage decay, the risk increases even more than the return.


Conclusion: The two simple strategies illustrate the difficulty of finding a simple strategy that both increases the return and reduces the risk. So let's go one step further. Attention, now it's getting economic!


3) The interest rate indicator strategy


The starting point is the following simple basic insight, which probably everyone knows: stock markets are primarily driven by liquidity. If there is an abundance of money, all shares are bought; if there is a shortage, most shares fall. When is liquidity injected into the market? That's right! When interest rates fall. A simple interest-based trading strategy can perhaps be derived from this:


Rule: buy the S&P500 ETF when a 7-10y US government bond ETF is trading above the 200-day moving average at month-end (i.e. interest rates are falling). Otherwise hold cash.


Result (since 2000): Yield 6.5%pa, risk -47%maxDD. https://www.portfoliovisualizer.com/tactical-asset-allocation-model?s=y&sl=5PYIS7ZMzBy3AREti5VHyG

attachment

Evaluation: The simple model brings no improvement compared to B&H S&P500 (7.6%pa, -51%mDD). Why? Quite simply, when interest rates fall, it is never for no reason, usually because the economy needs it and then the stock markets usually fall too or they have already fallen or vice versa. In any case, falling interest rates are not necessarily positive for equity markets.


This insight can be used to construct a combined trading strategy that only invests when interest rates are falling and equity markets are rising:


Rule: buy S&P500 ETF if at the end of the month the US 7-10y bond ETF AND the S&P500 are trading above their 200-day moving averages. Otherwise hold cash.


Result: return 8.4%pa, risk -16.6%maxDD. https://www.portfoliovisualizer.com/tactical-asset-allocation-model?s=y&sl=18bID68QT1iNCfN3HxEV4A (since PV does not allow the exact backtest of the rule, I created a synthetic 200-day average with the 5 lookback periods - the results should hardly differ).

attachment

Conclusion: The combination of 200-day and interest rate indicator again significantly reduces the risk, but the return remains below the requirements. Interest rates alone are therefore not a sufficient indicator for the strategy we are looking for. The third and final step follows. Attention: now it gets a little more complicated - so keep concentrating!


4) The TIPS indicator strategy


The starting point is again a simple, basic economic insight: Central banks have a political mandate to keep inflation low. They raise interest rates when the economy is booming and (therefore) inflation is rising, and they lower interest rates when the economy is in crisis and (therefore) inflation is falling. If inflation is taken into account for interest rates, the following picture emerges: central banks withdraw liquidity from the capital market when interest rates rise more sharply or fall more slowly than inflation ("hawkish"; "ahead of the curve"). Conversely, they inject liquidity into the market when interest rates rise more slowly or fall faster than inflation ("dovish", "behind the curve"). The decisive factor for assessing liquidity flows is therefore the change in real interest rates (= key interest rates minus inflation). In short: if real interest rates fall, money flows into the markets; if they rise, money flows out.


How cool would it be if you could track changes in real interest rates at a glance and in real time? You can, with Treasury Inflation Protected Securities (TIPS). This special type of US government bond does not pay a fixed interest rate, but in simple terms a fixed difference to the inflation rate. For example, if this difference is 1% and the inflation rate is 3%, then the bond pays 4%. TIPS therefore show the real interest rates live. As with normal bonds, TIPS rise when real interest rates fall and vice versa.


These insights can now be translated into a trading strategy by replacing the 7-10y US government bond ETF with a US TIPS ETF:


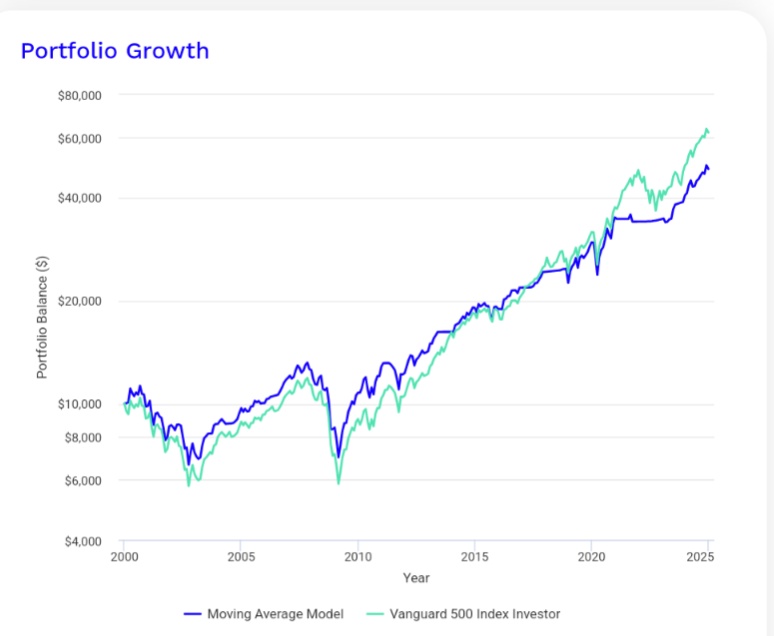
Rule: Buy S&P500 ETF if at month end the US TIPS ETF AND the S&P500 are trading above their 200-day moving averages. Otherwise, hold cash.


Result: Return: 9.8%pa, risk: -9.2% maxDD. https://www.portfoliovisualizer.com/tactical-asset-allocation-model?s=y&sl=56b7uZNB4k0v58mav0puPB

attachment

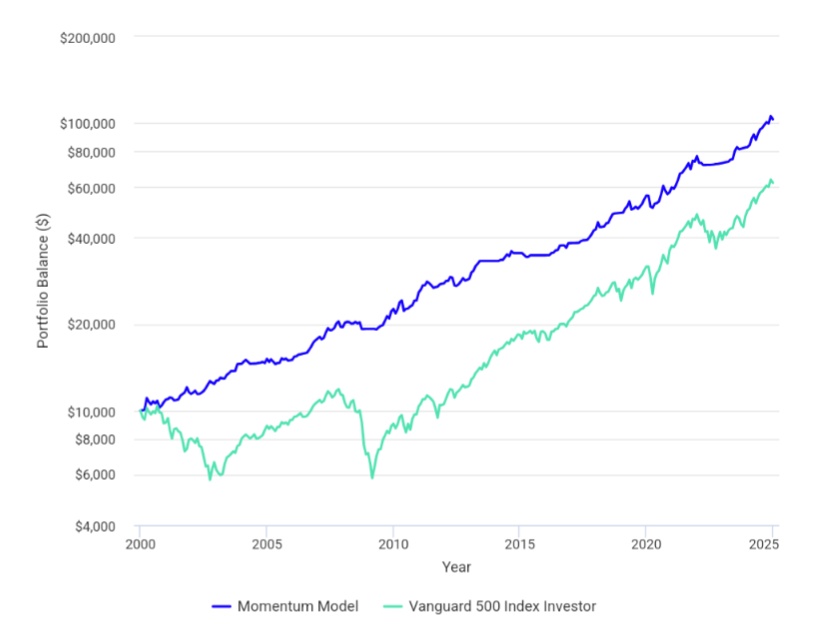
Evaluation: Voilá! The TIPS strategy shows a significantly reduced risk with the same return. This clears the way for leverage.


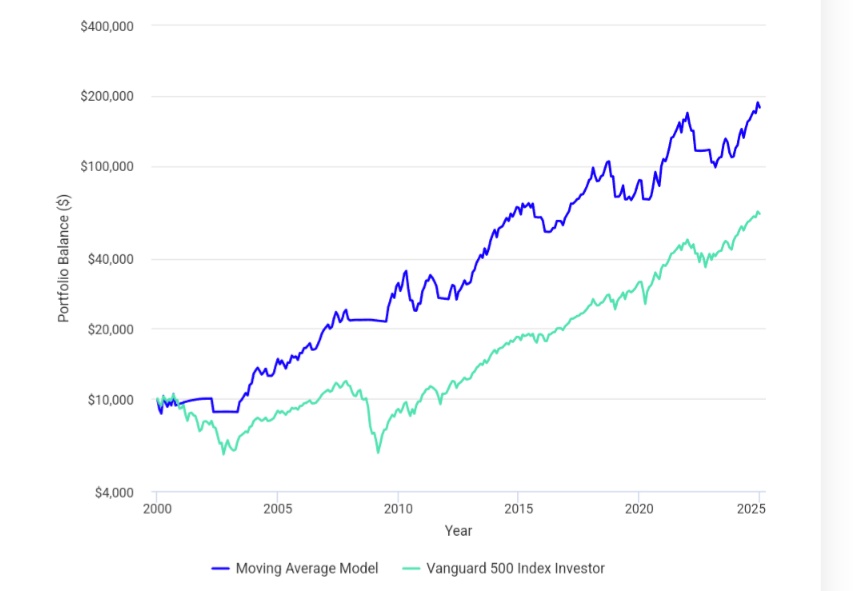
Rule: Buy a 2x leveraged S&P500 ETF if the US TIPS ETF AND the S&P500 are trading above their 200-day moving averages at the end of the month. Otherwise hold cash.


Result: Return 16.2%pa, risk -18.9% maxDD. https://www.portfoliovisualizer.com/tactical-asset-allocation-model?s=y&sl=5ihDYER8Ic5YwBzYQblrYa

attachment

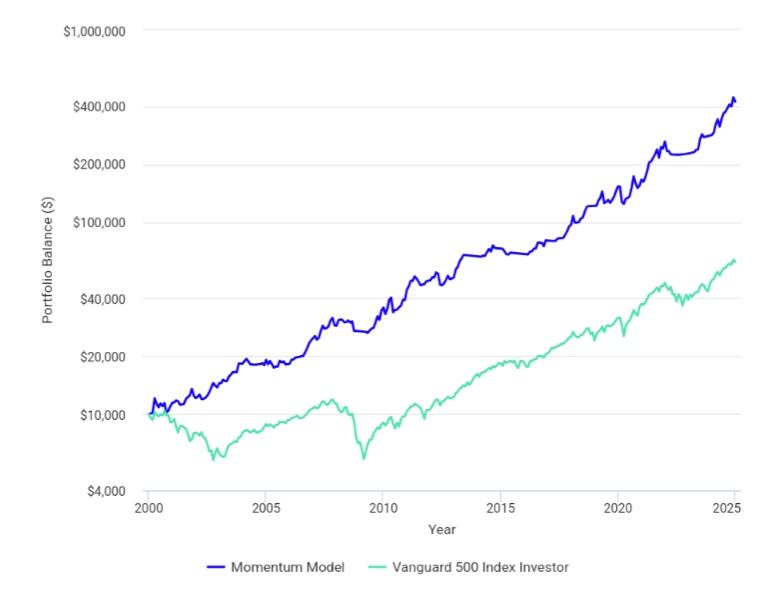
Evaluation: We have thus found a strategy that meets all the requirements: it is logical (real interest rate differential as liquidity indicator combined with the best of all factors: momentum), performant (16%pa), low-risk (-18.9%mDD) and simple (one ETF; 1.6 transactions pa). I have called them 2xSPYTIPS, not very creatively, but aptly.


5) Extensions, modifications, taxes, applications


I have just shown you the simplest version of 2xSPYTIPS. Of course, the model parameters can be further optimized. For example, you can change the average (from 200 days to 150 days) or use money market ETFs, short-dated government bonds or even gold instead of cash as an out-of-market asset. Try it out yourself for portfolio performance! However, only use assets that are highly likely to be followed by market participants in the future, such as the 200-day moving average. I myself will start a modified model in my own portfolio in 2025, which has slightly better performance data and is optimized to minimize transaction costs.


Some of you foxes are probably thinking to yourselves now: What works with the S&P500 should surely also work even better with other, better performing indices. Unfortunately, this is not the case: 2xNasdaq100: return 17.8%, risk -55% maxDD; US small caps: return 7.6%, risk -53% maxDD. Why? This is probably because the US large caps in particular depend on liquidity. Technology and small-cap stocks obviously have other dominant influencing factors. Therefore, BTC does not work so well either, even though I have found TIPS-based strategies that deliver even higher returns and avoid the deep drawdowns of BTC.


There is still the vexed question of taxation: the reallocations normally result in capital gains tax, which reduces the return. 26% CIT less 30% partial exemption = 18% CIT. 16.2%pa - 18% KES = 13.3%pa. Not pretty, but still worlds better than the 6%pa with B&H ACWI. The only way I know of to get around these costs without too much trouble is in a tax sheltered wrapper that allows leveraged ETFs to be traded. As far as I know, this is via Wikifolio (0.95%pa costs + 5% profit commission) or via "Mylife Invest" (0.5%pa costs + 0.2% per transaction). In both variants you would end up with approx. 15%pa after costs. Unfortunately, both variants have a catch: a "2xSPYTIPS Wikifolio" does not (yet) exist and "Mylife Invest" is an insurance policy (for many here it's the devil's bargain, but for this particular strategy perhaps just the right thing - I'm also planning to go down this route for the next few years because of the tax benefits in the payout phase).


6) ETF recommendations


Index: Xtrackers S&P 500 2x Leveraged Daily Swap UCITS ETF, LU0411078552

Cash: Xtrackers II EUR Overnight Rate Swap UCITS ETF 1C, LU0290358497

Indicator: iShares USD TIPS UCITS ETF EUR Hedged (Acc), IE00BDZVH966


7) Literature


The strategy is inspired by the article: Keller/ Keuning: Dual and Canary Momentum with Rising Yields/Inflation: Hybrid Asset Allocation (HAA), 2023. https://papers.ssrn.com/sol3/papers.cfm?abstract_id=4346906&download=yes


Outside of that, you won't find much on the web about this strategy.

What do you think of 2xSPYTIPS? Let us know in the comments!


Your Epi

243
283 Comentários

2Mês
Hello everyone,

First of all, I would like to thank you very much for the exciting and detailed strategy proposed by @Epi. It inspired me to test its applicability and performance by analyzing it on my own. Using a short Python script, I evaluated the strategy by accessing the Yahoo Finance database to test different parameter combinations.

Approach
The focus was on TIPS (Treasury Inflation-Protected Securities) and the S&P500. For both asset classes, I examined moving averages - both Simple Moving Averages (SMA) and Exponential Moving Averages (EMA) - with time windows from 100 to 240 days, in increments of 5, and their combinations.

In addition, I tested the strategy over different time periods: ten consecutive ten-year periods between 2000 and 2025. The aim was to evaluate both the stability and the performance of the parameters over different market phases.

Results
SMA vs. EMA:
The EMA did not deliver satisfactory results in any of the scenarios tested. The SMA, on the other hand, showed consistently better performance values.

Parameter optimization:
For TIPS, an SMA with a period of 165 days emerged as a stable peak value, regardless of the decade considered. For the S&P500, the optimal parameters varied somewhat more - here the best SMA value ranged between 140 and 165 days, depending on the time period considered. It is noteworthy that an SMA of 165 consistently delivered the best results across all ten-year periods in both asset classes (TIPS and S&P500).

Alternative rebalancing strategies:
Additionally, I investigated whether shifting into gold or gold x2 instead of cash could provide an improvement. The result was sobering:

Gold x2 significantly worsened performance.
Gold as a rebalancing option only led to slightly worse results, but offered no recognizable added value compared to the original strategy.
Top results
The best three combinations are listed below, based on the average of the 10 ten-year periods:

(EDIT: I invested in the S&P500 x2 for the test, by the way).

SP_SMA TIPS_SMA AltAsset Mean_Sharpe Mean_CAGR Mean_MaxDD Mean_Vol
165 165 Cash 0.671534 0.125473 -0.240317 0.182836
160 165 Cash 0.662812 0.122270 -0.240301 0.180637
165 155 Cash 0.662389 0.122090 -0.240321 0.180596

Assumptions and restrictions
To better reflect reality, I have taken into account a tax-free allowance of 1,000 euros per year, while taxes of 25% were deducted for profits in excess of this amount. However, the implementation of this model is quite rudimentary, as I only spent a limited amount of time on these tests. I did not consider the TER of the ETFs used.

Open questions and optimization possibilities
I invite you to critically scrutinize the results and point out possible errors in my analysis. It would be great if you could share suggestions for improvement - both for the code and for the strategy itself.

In particular, I would be happy to hear about alternative investments that might be suitable as a rebalancing option during the phases in which we are divesting from the S&P500.

Thank you very much for your support and suggestions!
31
imagem de perfil
2Mês
@LDA Wow! Great reaction! Thanks for that!

A few comments:
1. sma165 looks a bit random and like overfitting. What economic justification would there be for this value? I find SMA150 to be more justifiable as the average of the two most frequently observed SMAs 100 and 200.

2. try long-dated government bonds as an out-of-market asset. However, you may then need additional rules to avoid high drawdowns like 2022. But perhaps it is sometimes best to simply stand on the sidelines and hold cash?

3. why do you deduct 25% tax? 2x leveraged equity ETFs fall under the 30% partial exemption, so in the end it's only 18% tax. With OutOfMarket assets it may be different again.

4. an important point: does your test work with currency-hedged ETFs/indices? The signals in USD often differ significantly from those in EUR. The strategy is US-centric, and your test must take this into account.

5) I would find it interesting to backtest an international variant, i.e. MSCIWorld and International Inflation Protected Secs. Can you test that? Unfortunately not possible with PV.
3
2Mês
@Epi Sure, with pleasure. It was only the first throw.

1. i had periods tested independently of each other, each 10 years and in the period from 2000-2025. if you had started at the beginning of each year 2000-2015 and implemented this strategy for 10 years (until the end: 2010-2025), the combination 165 / 165 would have been the best on average. Of course, this analysis is adjusted to the years 2000-2025. Longer periods would probably yield different results.

2 I would be happy to give it a try. I just find cash boring, but that's more of a headache for me.

3 I've made a rough estimate. But I'm happy to assume 18% in the following, then the result will of course be nicer.

4. good hint! I didn't pay attention to that. I'll check it right away.

5 I'll take a look. No guarantee, of course.
1
imagem de perfil
2Mês
@LDA Thank you! I'm looking forward to it.
Regarding the taxes: your result corresponds quite well to my backtest on PV. You came to 12.5%pa with 25% tax, I came to 13.3%pa with 18%.

Since there is still the option of insurance, where you only have to deduct 1%pa from the CAGR, a test without any taxes is also quite useful as a reference. 👍
1
2Mês
@Epi

Well, I have only looked at ETF consistently in USD. Tickers: ^GSPC, TIP, SSO and GLD.

Test at 18% in continuous model (10 years each):
=== Top 3 combinations (by mean Sharpe) ===
SP_SMA TIPS_SMA AltAsset Mean_Sharpe Mean_CAGR Mean_MaxDD Mean_Vol \
40 165 165 Cash 0.735795 0.137082 -0.239206 0.182224
38 165 155 Cash 0.725835 0.133400 -0.239209 0.179971
33 160 165 Cash 0.725677 0.133490 -0.239195 0.180041

The top combination 165/165 remains at a CAGR of 13.7%pa.

Excluding tax (0%), the top result looks like this:
=== Top 3 combinations (by mean Sharpe) ===
SP_SMA TIPS_SMA AltAsset Mean_Sharpe Mean_CAGR Mean_MaxDD Mean_Vol \
40 165 165 Cash 0.911523 0.169572 -0.23616 0.181738
38 165 155 Cash 0.899429 0.165053 -0.23616 0.179436
33 160 165 Cash 0.897650 0.164913 -0.23616 0.179586

Top combo remains 165/165 at CAGR 17%pa.


Note: Could it be that the S&P500 x2 has only existed since 2006? This means that our strategy only applies from 2006 onwards and therefore the CAGR should be higher.

(
EDIT: However, the data for the strategy from 2006 with 18% would look like this:
=== Top 3 combinations (by mean Sharpe) ===
SP_SMA TIPS_SMA AltAsset Mean_Sharpe Mean_CAGR Mean_MaxDD Mean_Vol \
40 165 165 Cash 0.786565 0.154436 -0.239206 0.197697
38 165 155 Cash 0.779914 0.151394 -0.239208 0.195083
33 160 165 Cash 0.775764 0.150493 -0.239195 0.195424
)

Please give me a few tickers that I should try out. They should all be available on Yahoo, otherwise I won't be able to access them.
1
imagem de perfil
2Mês
@LDA That looks good!
The 2x leverage ETFs on S&P500 have not been around as long as the backtest goes back. That's why I created a synthetic 2xSPY via 100% leverage and 3% financing costs for the long backtest, as already written in the article. This tracks the 2xS&P500 ETF quite accurately.
1
2Mês
I have now also replicated the S&P500 x2 synthetically - works well. I have to say that I really like this strategy! Really outstanding performance with manageable risk (at least according to the history). I find the strategy's handling of situations like the early 2000s, 2008 & 2009, and 2022 particularly impressive (& the fact that the corona slump was filtered out so well was a stroke of luck ;)). I would like to share a few pictures, but I couldn't find this function here. But then here is a short example in figures: 2007 - 2010: CAGR: 12.11%, mDD: -21.42%, Vola: 21.78%, Sharpe Ratio: 0.56. The strategy has come out of this period with a juicy plus, while the S&P500 has still not fully recovered - of course, it doesn't have to happen that way again.

I am now having the signals issued according to the strategy and will probably try my luck with it in the future - at the moment we are sitting on the sidelines (strategy says 31.12.24: hold cash). Nevertheless, a big thank you to @Epi for this wonderful idea! If you (@Epi ) have any ideas for expanding this approach in the future, please let me know, I would also make myself available for systematic backtesting.
3
imagem de perfil
2Mês
@LDA I'm glad you appreciate the strategy. I actually think it's quite a game changer that makes the classic B&H world ETF obsolete. But only a few people see it that way, I don't know why.
Anyway, as I said, I would be interested in an international version. Initially only synthetic, as there is no 2XMSCIWorld. But if something like that is ever launched, I might even find it more interesting than a purely US-focused strategy. Can you manage that?
1
imagem de perfil
@LDA I would also be interested in a test with the 2x MSCI USA, which should have the ticker CL2.PA :)
2Mês
@Epi @derphux

So, I did it with the same model structure with the MSCI World (URTH). Unfortunately, the history only goes back to 2012, so we are only looking at 2012-2025 here.

Result with 0.18 taxes:
- CAGR: 12.41%
- Max drawdown: -23.30%
- Volatility: 20.04%
- Sharpe Ratio: 0.62

Here without taxes:
- CAGR: 13.81%
- Max drawdown: -23.30%
- Volatility: 19.92%
- Sharpe Ratio: 0.69

Here the S&P500 in the same period for comparison:
- CAGR: 18.73%
- Max drawdown: -27.56%
- Volatility: 20.90%
- Sharpe Ratio: 0.90

Important note: I took a look at your model (@Rmann) on PV. You use not only the MA but also a dual momentum over several periods between index and TIPS. This model structure naturally improves the performance again and reduces the drawdown. Incidentally, the MA 200 provides the best service here. I have recoded your model using Python and tested it: your model seems to be "perfect" as far as possible. I wouldn't change the parameters any more.

All in all, it also seems to work well with the MSCI World, but that's not surprising as the MSCI World is largely made up of the S&P500 (to put it bluntly). By the way, I also tested the Nasdaq 100... I wouldn't do it. Similar returns, huge drawdowns.

One more note: For those who want to trade on the signals but don't want to spend money on the full version of PV: ChatGPT o1 is quite powerful, with precise instructions it manages to implement the model setup very well in Python, no programming skills needed. If you are interested you can look up the keywords: Python and Jupyter Notebook at ChatGPT. ChatGPT can answer the rest. Estimated effort for a beginner to build their own model (with know-how development): approx. 3-5 hours. But it's worth it! I "taught" myself how to code using ChatGPT as part of my ongoing master's thesis, and with a little interest it goes faster than you think.
3
imagem de perfil
2Mês
@LDA Thanks for that! I really need to have a look at Pythonscripts via ChatGPT in a quiet minute.

Regarding your tests: if I understand correctly, you used MSCIWorld with US TIPS Signal. Systematically this is difficult because US liquidity is not world liquidity. I would therefore rather use a EUR-hedged Global Inflation Protected Government Bonds ETF. Yes, there is such a thing! LU0290357929
That should do the trick.
1
Ver todas as 20 restantes respostas
imagem de perfil
You have my attention 😲❤️
It's been a long time since I've seen an article that adds real value to the community. Many thanks for that!
6
imagem de perfil
I'm thrilled. Have you already started? I would start my own PF with 10k. Would it be possible for you to add the indicators to your post every month?
4
imagem de perfil
2Mês
@Bein-Godik I'm glad you like the strategy. It's also very good ;-) However, I would advise you not to rely on individuals on the net for a long-term strategy. You can easily monitor the US TIPS ETF yourself. You'll be on the safe side in the long term.
1
imagem de perfil
@Epi I took a look at the TIPS ETF. It has been below the 200-day line since December 19. So entry into the 2xS&P is not possible until February 1?
1
imagem de perfil
2Mês
@Bein-Godik Correct. The strategy has just switched to sell. Judging by the backtests, this is likely to remain the case for a few months. Rapid signal changes are rare.
There are also opportunities to make decent returns in the tips-neg phases.
1
imagem de perfil
@Epi Is it possible to look at this on a weekly basis, i.e. perhaps always trade on Sunday and then Monday morning, similar to the Gebert indicator?
imagem de perfil
2Mês
@Bein-Godik Of course you can, why not? The question is whether you want to and whether this will improve performance. Just test it out!
For me, the monthly model is ideal.
1
imagem de perfil
@Epi There seems to have been a quick signal change for once, right?
imagem de perfil
2Mês
@T-Dax The signal situation is not yet 100% clear, but yes, it would be one of the rare quick changes. Indicates uncertainty on the interest rate market.
imagem de perfil
Thank you for the article, very interesting strategy 👍

One comment: The question of whether the S&P 500 is above or below the 200-day line should really be based on the index itself and not (as you recently wrote) on the ETF?
3
imagem de perfil
2Mês
@ChrisBizz If the ETF is hedged, you can also use it, as it tracks the index fairly accurately. However, there is no hedged 2x leveraged S&P500, so the signals and performances may be different.
These are the usual problems of practical implementation. You have to make compromises here and there. However, this should become relative over time.
1
imagem de perfil
@Epi I have now written a script for this strategy. It is currently still in the beta phase at Tradingview. But it already looks quite promising.
3
imagem de perfil
2Mês
@Pe4k Super! What exactly does the script do?
1
imagem de perfil
@Epi Abstract:

You can insert it into TradingView to display direct buy or sell indicators for the S&P 500. In the background, the TIPS ETF on the NASDAQ is checked to see whether it is trading above or below the 200-day line.

Unfortunately I can't post a photo here...
1
imagem de perfil
2Mês
@Pe4k Sounds simple.
Very nice. That's how the model was intended - that everyone can implement it with their own skills and needs.
1
Ok so if no longer beta can you find the script there or would you have to make it available?
2
imagem de perfil
@Happysurfer I'll write a post about it soon, if there are enough people interested, I'll upload it there. I hope it's that easy 😅
4
@Pe4k really cool! I would love to try it
Due to the lack of S&P500 2x ETFs that are authorized for distribution in Switzerland or available at Degiro, I have calculated your model with the MSCI USA. If I have adjusted everything correctly, I can achieve slightly better values (+22% / -18.9%).

https://www.portfoliovisualizer.com/tactical-asset-allocation-model?s=y&sl=5XgoPzYSce7uJxgZRqsHma
3
imagem de perfil
2Mês
@jangchi_ Very well noted! This is one of the ways the model can be further improved! 👍

Just didn't want to serve everything on a platter. 😁
1
imagem de perfil
@jangchi_ Hello, as I am Swiss myself and interested in this strategy, I also noticed that there is a lack of S&P500 2x ETF's authorized in Switzerland.

Could you elaborate on your changes? So that I can understand it and maybe consider it?
@Kazuo There are two options, either you buy a leverage certificate (DE000PF05PB7) or e.g. an ETF based on the MSCI USA (18MF / FR0010755611). The MSCI USA is an alternative index that comes very close to the SP500.
2
imagem de perfil
This could be the first entry on 01.02.
3
imagem de perfil
2Mês
@Finanzaristokrat A bit surprising for me, but yes, it could start directly next Monday with a leveraged entry into the US market.
2
imagem de perfil
@Epi I didn't expect anything and am also very pessimistic about getting in now. DeepSeek Monday showed how fragile the S&P 500 is right now.
imagem de perfil
2Mês
@portfolio_genius_pxvmr But I think that's the funny thing about rule-based strategies: they run independently and often seemingly contrary to the news.
The fact is that inflation is rising in the USA and interest rates are falling in EUR. Both are good for equities. 🤷
imagem de perfil
@Epi Yep... That's why I'm going to get in on Monday. At the end of the day, you should act without emotion.
2
imagem de perfil
2Mês
@le_petit_rick I have already got in - with a large part of the planned capital. 😬 The signal situation is quite clear and the momentum is quite high at the moment. I follow the saying Time in the Market beats timing the Market.
It wasn't foreseeable, but a rule is a rule.
1
imagem de perfil
@Finanzaristokrat but that's wafer-thin right now. I'll wait and see tomorrow and possibly Monday. But the strategy is great, cash is ready.
1
imagem de perfil
@Epi you are circumventing your own rules 😆. Because currently TIPS says sell. 😌
imagem de perfil
2Mês
@Finanzaristokrat Nope, I'm interpreting the rules. TIPS is trading well above SMA200, the buy signal is 99% likely to come on Mon. And today I had some time to look after my portfolios. So I traded.
2
imagem de perfil
@Epi No problem. I have the TIPS in Portfolio Performance. It stands there at 5.21 to 5.20 on the SMA. It will also go in on Monday. I find that exciting
1
imagem de perfil
@Finanzaristokrat Despite the trade war scenario and tariff battle, you're going in?
Ver todas as 4 restantes respostas
imagem de perfil
Interesting strategy. But I have one question to understand: by "otherwise hold cash", do you mean that everything is sold at the end of the month and only re-entered when the criteria are met?
2
imagem de perfil
2Mês
@Wuestenschiff Correct. 👍
The correct instruction would probably be "Buy cash." But that's kind of nonsense. 😅
3
imagem de perfil
@Epi So does this mean selling the S&P500 and buying the Overnight Rate Swap ETF when the S&P500 and TIPS ETF are below the 200 day average? Or just selling the S&P500 ETF and then waiting until it is time to reinvest?
imagem de perfil
2Mês
@mrnohu You can take this as you wish and it also depends on the costs of your broker.
But a correction to understand: The 2xSPY is only bought if both S&P500 and TIPS are above SMA200. In all other (3) cases, cash/ Xeon/ government bonds are held.

The strategy is hesitant in the market, but then offensive.
You should do the same with women! 😅
5
imagem de perfil
Really good! Thanks for all the work and the good illustration!
2
imagem de perfil
2Mês
@Ikigai Thank you. Unfortunately, it got a bit lost among all the recaps. Maybe I'll just repost it when everyone has calmed down a bit. 🤷
1
imagem de perfil
@Epi bookmarked - reading once is definitely not enough!
1
sounds very interesting. i would also like to look into it. which tools are recommended for tracking sma 200 or for an even more detailed method like sma 165? or is that even possible here and i'm too stupid for it? ;)
2
imagem de perfil
2Mês
@Happysurfer I use Portfolioperformance. It's simple and reliable.
1
@Epi thank you very much
1
Hi guys, I just created a full script about this strategy, do you know if I can send a link here so you could help me adding important things? I think is ok as it is now. @Epi
2
imagem de perfil
1Mês
@FrancescoC Sure, just put a link in. We'll be happy to watch and comment. 👍
1
imagem de perfil
1Mês
@FrancescoC Thank you! I'll probably have to familiarize myself with it first. 😅
1
@Epi ok, let me know if I managed to bring your strategy back to trading view at 100%👍🏼😆
Ops sorry, that was the wrong link
1
imagem de perfil
1Mês
@FrancescoC Ah, that's easier now! 😅

The buy rule is not quite correct. It is: Buy if S&P500 & TIPS are above SMA200 at the end of the month, otherwise cash.
There is no take profit or stop loss. 👍
1
@Epi ok I will fix it as soon as I can!
So s& and p500 & are 2 different things? I'm new to this, sorry🥲
imagem de perfil
1Mês
@FrancescoC Just take the S&P500. I don't know the other one.
Ver todas as 5 restantes respostas
imagem de perfil
Very nice contribution!
Just two quick questions:

1. how was performance/drawdown at GTAA?

2. what if you take the 2xMSCI USA $CL2 instead of the 2x S&P 500? It is a little more diversified.
1
Ver todas as 3 restantes respostas
imagem de perfil
Super contribution. Very informative. Thank you dir👍🏽
1
imagem de perfil
Addition to my post from just now 🙂
1
Wann GTAA6
1
Mostrar resposta
Whow, great! Thanks for the inspiration 👍🙂
1
I agree with these people, a really very well-founded analysis. From a practical point of view, I would now be interested in how to combine the parameters or build an automation to be informed via a push notification when the two US TIPS ETF AND the S&P500 ETF are trading above their 200-day averages. Are there perhaps already practical use cases from your side? Otherwise you would have to manually compare the two charts on a daily basis. Thank you in advance for any possible solutions.
1
Ver todas as 2 restantes respostas
imagem de perfil
Strak, thanks for the post!
1
imagem de perfil
Very nice strategy and contribution! Inspired by this, I will try to find something similar but for the global indexes, as I am not a fan of overexposure to the US. Thanks again!
1
Ver todas as 4 restantes respostas
imagem de perfil
I have been using 200MAs in crypto for some time, but not yet with this approach. Very interesting
1
Ver todas as 3 restantes respostas
imagem de perfil
Thank you very much for this exciting insight! When you read something like this, you really doubt B&H ACWI. Especially the relative simplicity is amazing.
1
Mostrar resposta
imagem de perfil
1
Mostrar resposta
imagem de perfil
Really nice tip...or tips ! ;)
1
imagem de perfil
I once looked into the question of the 30% partial exemption. I found the prospectus from Xtrackers dated
23.12.2024 found. It says on page 119 that this asset class of LU0411078552 is an equity fund and therefore the 30% partial exemption is taken into account!

https://etf.dws.com/de-de/AssetDownload/Index/7ba0fddd-5b91-44c9-9f95-c9256d6a8b69/Prospectus-Xtrackers.pdf
1
Ver todas as 7 restantes respostas
imagem de perfil
Thanks!
1
imagem de perfil
1
Mostrar resposta
imagem de perfil
I looked into it as part of my bachelor's thesis, and it was quite exciting. Of course, not with a 5% return on investment, the calculation no longer works out, which is why I'm not in the wikifolio, but it's certainly exciting.


I don't think it fulfills the wishes of all World ETF fans, mainly because of the need for active management. As it happens, I have also been looking into this :) We tend to listen to others when it comes to complicated issues and almost beg them to hand over responsibility.
If there is a long and deep DD in an allworld, you can shift the blame (as with your wikifolio). If there is a dry spell in a strategy that you have actively implemented yourself, you have to deal with the actual rational aspects of the situation...

What sounds like an accusation is not meant to be one, the human psyche is designed that way for reasons.
1
imagem de perfil
Hello @Epi

Super exciting approach! I have just sold my active funds due to lack of performance and came across your post while looking for a new strategy.

Do you think the strategy is potentially 100% savable?

When developing a strategy, I have so far tended to be conservative with 90% All-Word/10% cash.

I now have a nest egg.

After reading this article, I'm considering whether I should switch completely or at least follow your strategy with 10%.
1
Ver todas as 5 restantes respostas
imagem de perfil
I will now try out the strategy with about 5% of my portfolio :)
I have now written a bot that will automatically inform me when a new signal has been generated
1
Ver todas as 7 restantes respostas
imagem de perfil
Now also part of #gqevergreens 👍
1
Ver todas as 2 restantes respostas
Participar na conversa