2Mês·

Technical analysis - Nu Holdings

After the nice fundamental analysis of @BamBamInvest and the hype, I thought I would take a brief look at the technical indicators at $NU (-1,35%) .


No investment advice.

I am invested in Nu myself. In the pictures 4h-Candles in EUR are used (unless otherwise stated).


Possible bullish signals


attachment
attachment
attachment
attachment
attachment
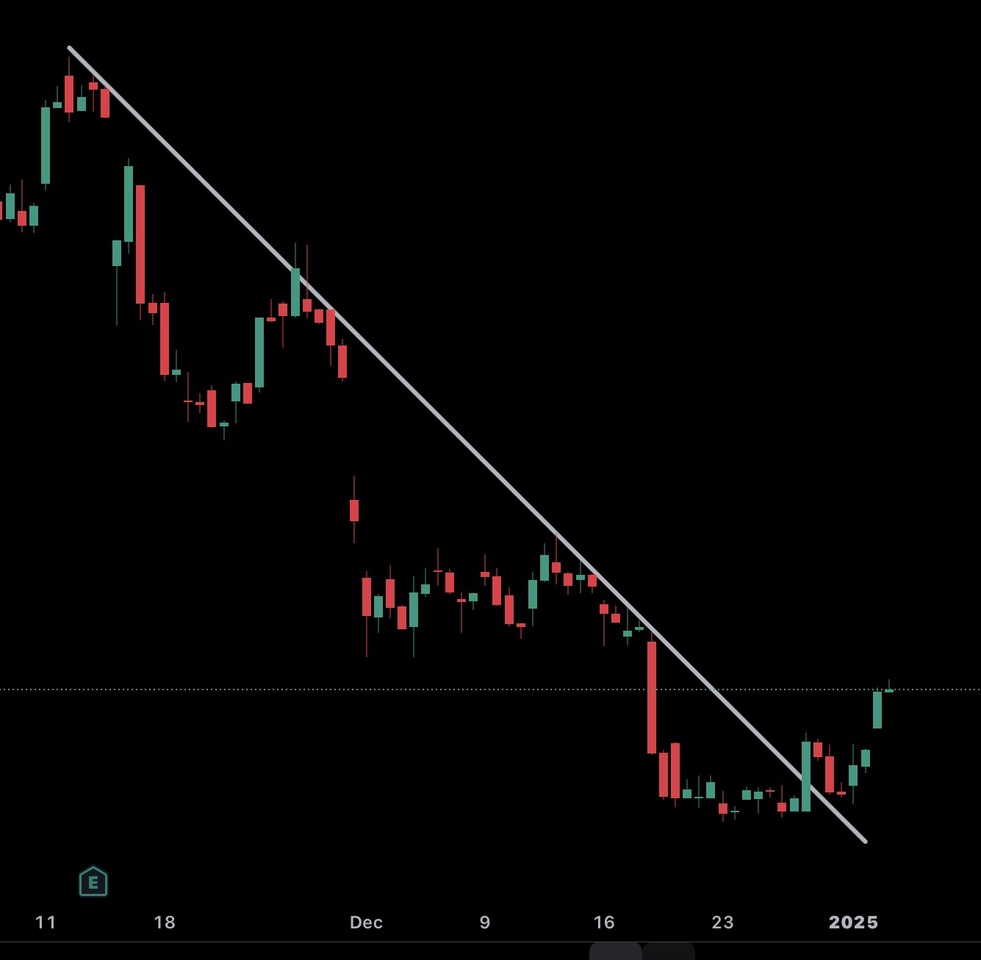
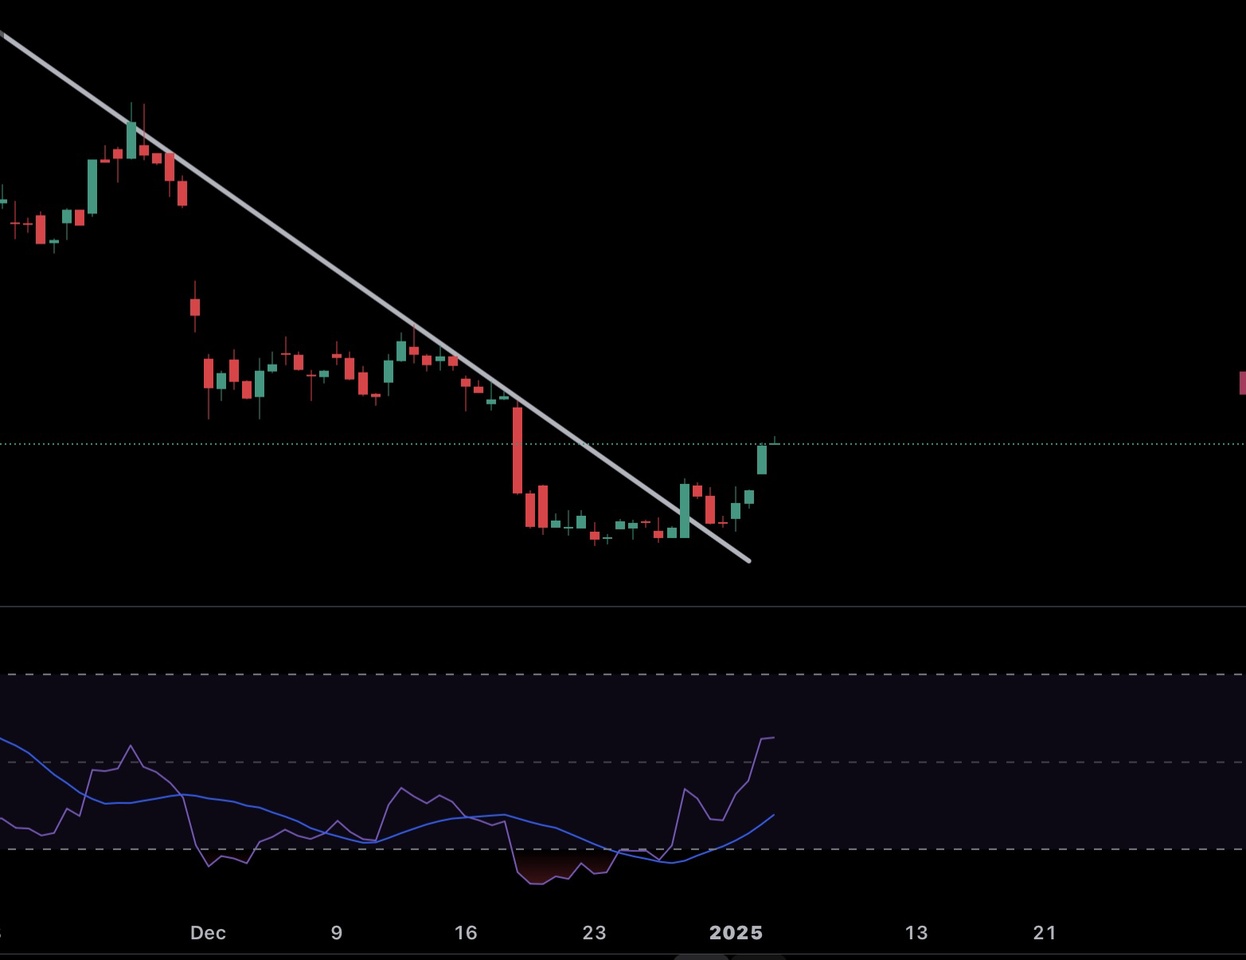
  • Nu has been in a relatively strict downtrend for more than a month now. downward trend which is now breaking down. The trend line has been broken and the price is currently hovering ~9% above support (recently rising).
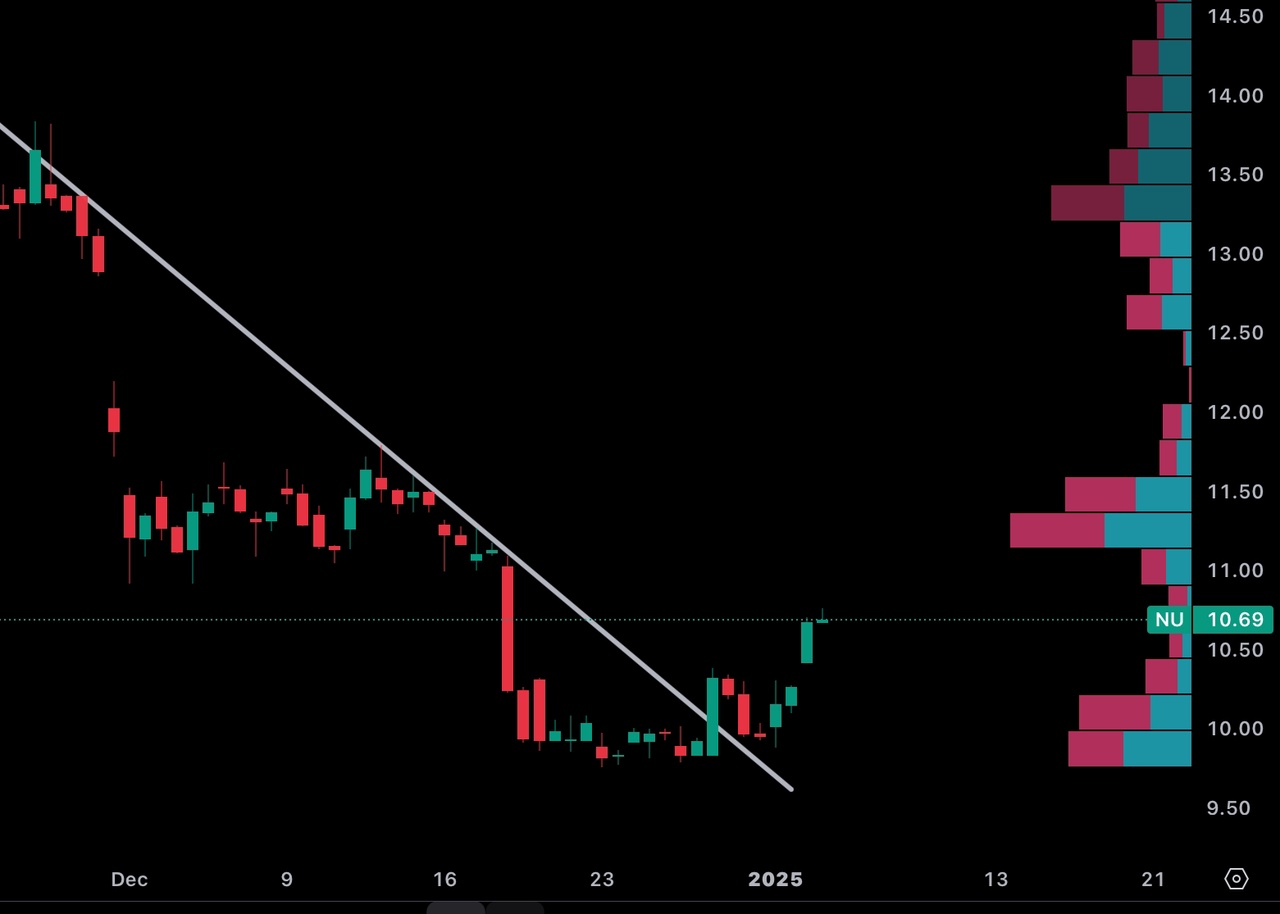
  • The last support has a comparatively high volume, which stabilizes the price. (Bar on the right in the picture)
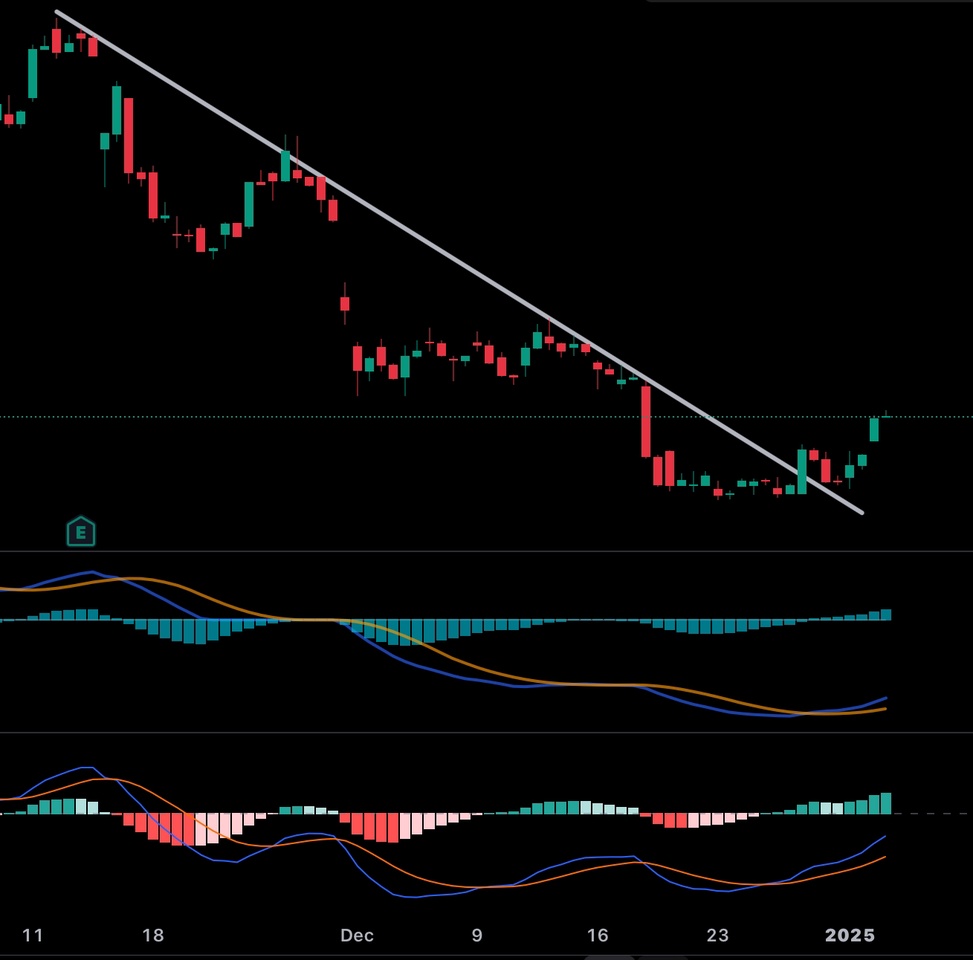
  • The MACD (Moving Average Convergence / Divergence) shows increasing upward momentum, and MACD and signal line are approaching the zero level from below, which could indicate a transition to an upward trend. (above: impulse-adjusted MACD, below: standard MACD)
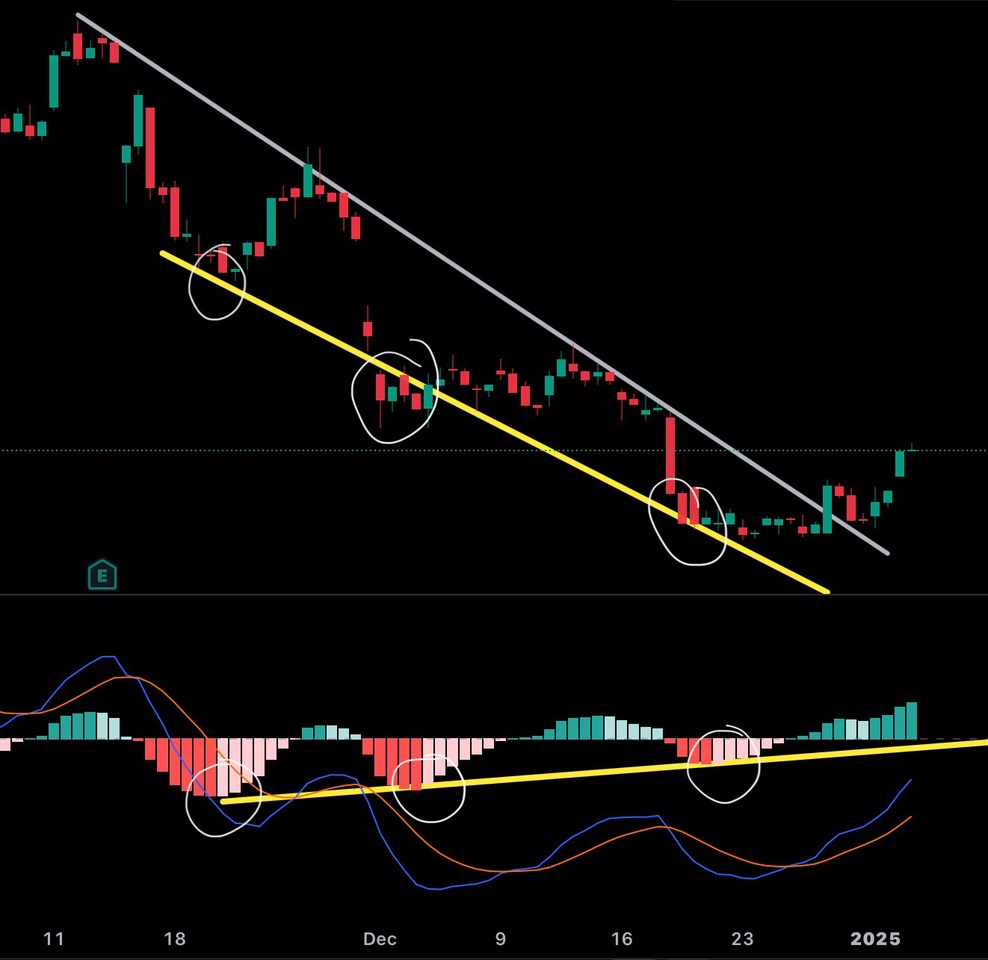
  • It is noticeable that the price has formed lower lows since mid-November ( -> downtrend), while the MACD has formed higher lows. This bullish & reversible divergence shows that although the price continues to fall, the downward momentum is decreasing and the trend is therefore tiring.
  • The RSI (Relative Strength Index) currently currently higher lows and is therefore rising. Buyers are more active again and the momentum is shifting towards "bullish".


Possible bearish signals


  • The price is still in a downward downward trendeven if the previously entered trend line was slightly broken.


attachment
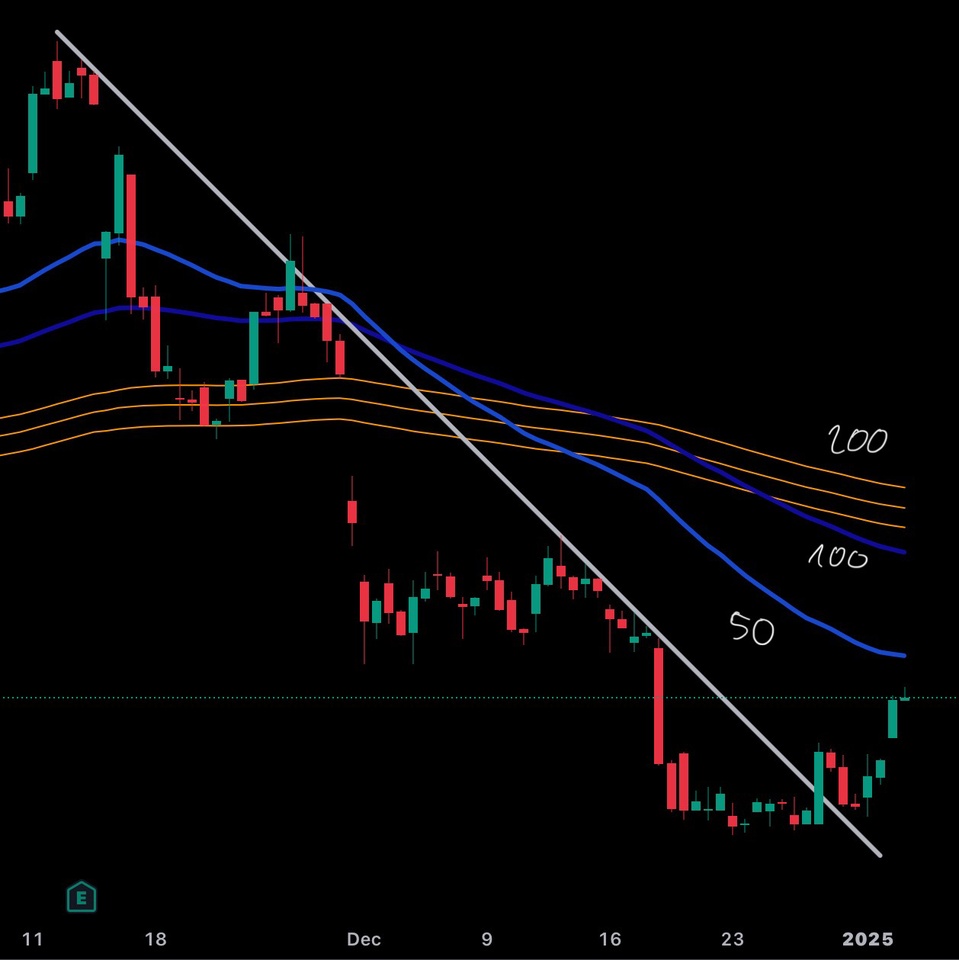
  • Even after the last rise, the price is still below below most of the moving averages. In addition, the 50-EMA is below the 100-EMAwhich is considered a downtrend. However, these intersections are often strongly delayed. (In the picture: 50-EMA light blue, 100-EMA dark blue and 200-EMA band in gold).
  • The Stochastic Oscillator was at 90.30 at the close of the last 4H-candle and could therefore (at least in the very short term) already be considered overbought already overbought.


attachment
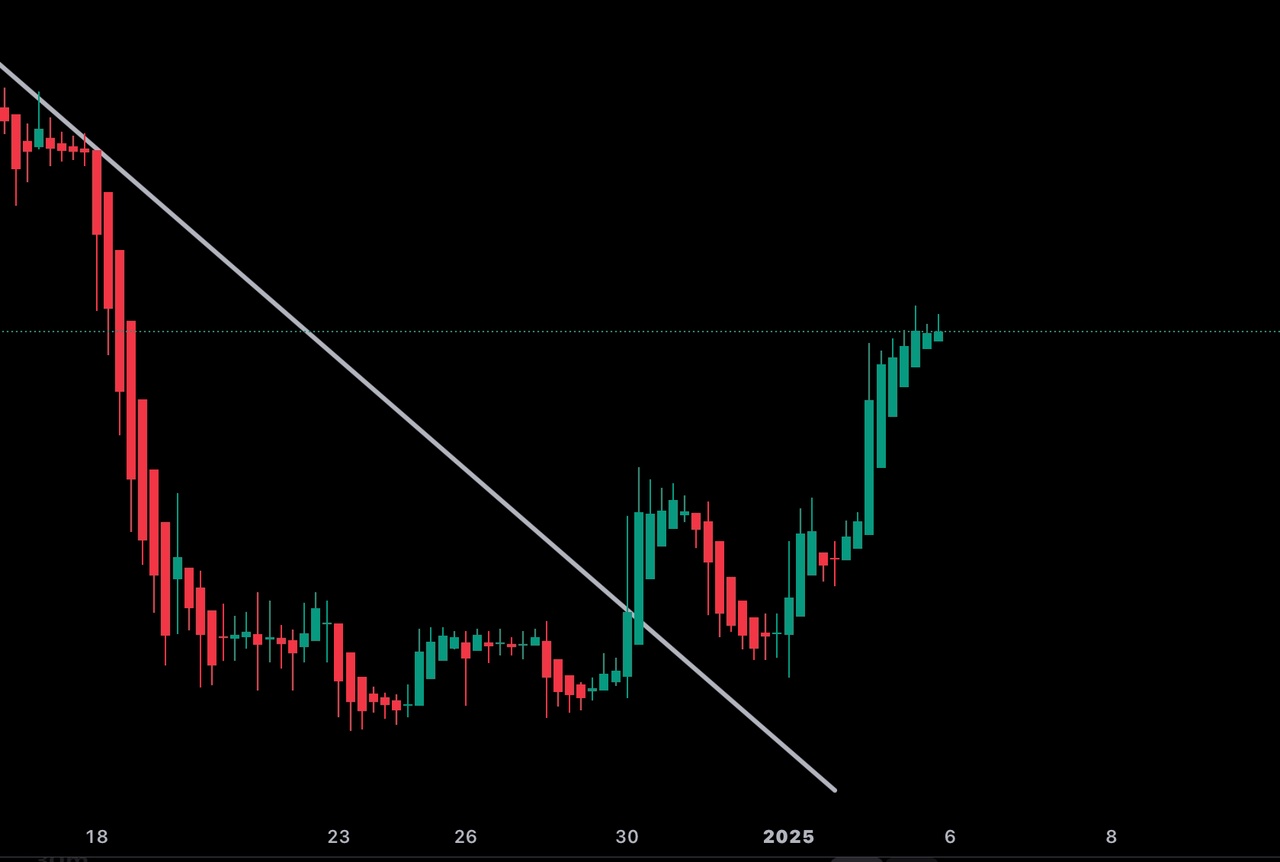
  • The recent bullish momentum has weakened in the last few trading hours, but this and the previous feature are more interesting in the short term. (In the picture: 1H Heikin Ashi candles)

After a possible rise, further solid support and resistance levels with high volumes await the price. In order to reach the ATH of ~€15, the price would have to rise by around 42%.


I hope this article was helpful. If you find any errors or contradictions, please let me know.


All presented are merely my interpretation of the data.

Technical analysis involves risks and is no guarantee of future performance.

For information purposes only, own research is recommended.


Pictures from TradingView

29
24 Comentários

imagem de perfil
So almost 30% down was probably also completely exaggerated. The company is growing and the fundamental figures are good.
Investors should probably realize that now.
It's not like LVMH here
4
imagem de perfil
@Tenbagger2024 Absolutely. I strongly believe that the ATH will be reached again this year 🙏 time will tell
1
imagem de perfil
@Tenbagger2024 The weak real was also a nasty problem. It's just an investment without a currency hedge, but I fully agree with you that the figures absolutely speak for the company.
2
imagem de perfil
Very nicely prepared 👍
2
imagem de perfil
@BamBamInvest Thank you - is it just me with a formatting error in the
first part? 😅
imagem de perfil
@Simon_n does not appear from the cell phone 😄
imagem de perfil
@BamBamInvest Well then 👍
imagem de perfil
@Simon_n but I also have to admit that I haven't looked at it that closely 😂
imagem de perfil
the downward trend was also tested again from above after the breakout
1
imagem de perfil
Thank you 👍🏻
Can you recommend any literature or other media to get started in technical analysis?
1
imagem de perfil
@Anderle Honestly, most of what I've learned has come from YouTube. However, there are also a lot of scammers there, or simply some who have no idea. WyseTrade or rather TradePrime are probably the best. You definitely don't need a €500 course, which is sold everywhere 😄
2
imagem de perfil
@Simon_n Thank you, I'll have a look.
imagem de perfil
Check out the videos from 10xtrading. The man is absolutely amazing. He comments on the charts with the enthusiasm and excitement of a football commentator. In my opinion, the market assessment is also the best there is on YouTube.
1
imagem de perfil
@toscho Great, thank you for the great tip ✌🏻
1
imagem de perfil
Follow this for a year now. An extreme Mehrwert❗️
imagem de perfil
I also bought more... and will do so again next week.
1
imagem de perfil
Dankeschön
1
imagem de perfil
@Semos25 Thank you! 🙏
imagem de perfil
1
imagem de perfil
@christian Thank you! 😊
imagem de perfil
so if I interpret your MACD chart correctly, the green candles are expensive / overbought (3rd picture). I would rather buy the red ones. Well, you guys go ahead... I'm not there, but Uwe certainly is.
imagem de perfil
@PalmPirateTechnocrate The MACD tends to indicate momentum, so if there are green bars, it means that there is bullish momentum. It can certainly also be interpreted as overbought, because sooner or later it will go down again. In any case, Uwe will definitely be there too 👍
1
imagem de perfil
So somehow in the end it's the same as always. Can rise, can fall, can go sideways.
Good luck with your investments 💪
imagem de perfil
@DerMartin well, I just wanted to shed light on both sides. If you ask me, the bullish side prevails, that's why I got in 😄 thank you
1
Participar na conversa