Hello my dears,
as I was shocked to discover while watching today's "Presseclub". The EU, and Germany in particular, is very poorly positioned when it comes to critical infrastructure, cyber attacks and drone defense. The plan here is to improve security at all costs.
Dear all, which companies do you think should benefit from this?
@EpsEra
@Multibagger
$DRO (-4,09 %)
$AVAV (-6,09 %)
$ESLT (-1,31 %)
$EOS (-4,01 %)
$YSN (-2,29 %)
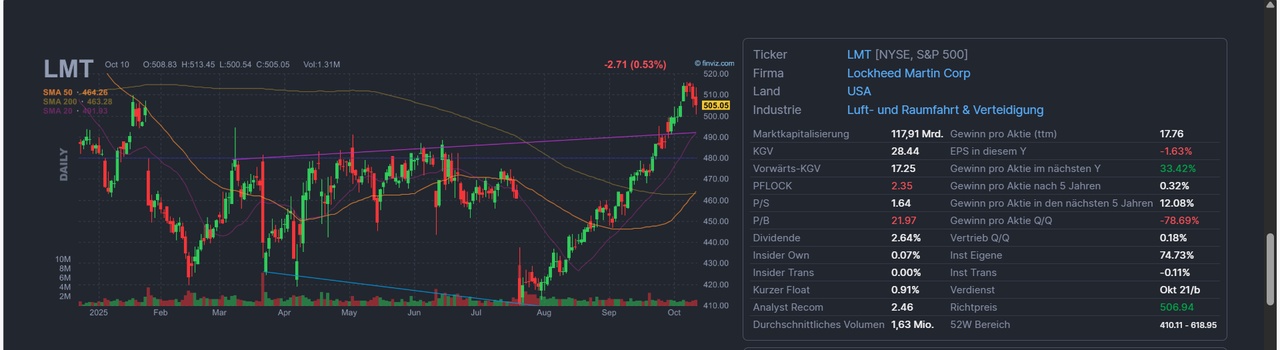
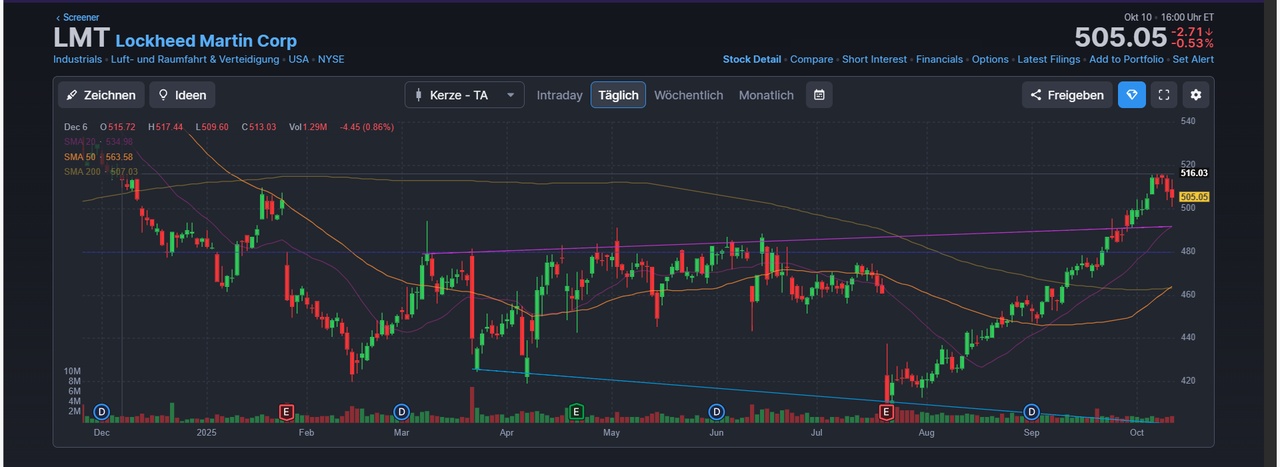
$LMT (-0,89 %)
$RTX (+2,29 %)
$HAG (-1,36 %)
$AXON (-0,12 %)
$FLT (-2,11 %)
$FQT (-4,29 %)
$RHM (+0,18 %)
Following airspace violations in Denmark and Eastern Europe, the European Union is pushing ahead with the construction of a "drone wall". What is known about the project so far.
Following several mysterious drone overflights in Denmark and repeated airspace violations by Russian drones in Eastern European countries, the EU wants to better protect its eastern flank. At the heart of the plans is a so-called "drone wall" - a defense system designed to detect, track and intercept unmanned aerial vehicles. What exactly the EU is planning, who is involved and how quickly the wall could be built: the most important questions and answers.
Who is building the drone wall?
The plans for the drone wall were presented at a video conference of EU defense ministers. The conference was mainly attended by Eastern European EU states, Bulgaria, Estonia, Latvia, Lithuania, Poland and Romania, as well as Finland. EU High Representative for Foreign Affairs Kaja Kallas, several representatives of the NATO defense alliance and the current Danish EU Council Presidency also took part. Conspicuously absent from the meeting was Germany - although security experts in this country have long warned of serious gaps in drone defense.
The EU wants to use its own financing instruments to fund this. EU Defense Industry Commissioner Kubilius spoke of a "protective shield for the eastern flank that will benefit the whole of Europe". At the same time, national defence budgets and the European defence industry are to be mobilized.
When will the drone wall be in place?
EU Defense Industry Commissioner Kubilius said in an interview with the news website Euractiv that the drone wall could be built within a year. However, EU officials do not expect the development of a comprehensive sensor network to improve airspace surveillance to be completed until the end of 2026. The development of an interception system is likely to take even longer. In the short term, additional sensors are to be installed first.
With material from the news agencies dpa and AFP
https://www.zeit.de/politik/2025-09/drohnenwall-eu-russland-drohnen-abwehrsystem-ostgrenze#wer-baut-den-drohnenwall
Dobrindt announces drone defense center
Following numerous drone sightings in Europe, the German government wants to introduce countermeasures. Interior Minister Dobrindt classifies the threat as "high" and is planning a drone defense center.
The German government wants to set up a drone defense center. This is Interior Minister Alexander Dobrindt's response to the numerous sightings of missiles of unknown origin. The CSU politician said that there was a threat that could definitely be classified as "high".
Detecting, intercepting and shooting down drones are the basis for drone defense. Repositioning is an urgent project, explained Dobrindt.
Pooling expertise
According to him, the drone defense center should bundle the competencies of the federal police, the Federal Criminal Police Office and the police authorities of the federal states. Dobrindt said he wanted to bring together expertise and initiate new research projects.
New technology for fighting drone against drone
Fighting drones with nets or by so-called "jamming" (interrupting radio signals) has limited effect, according to Dobrindt. The Minister of the Interior is focusing on developing new technologies for drone-on-drone combat: "We can't wait for others to make this available".
According to the Interior Minister, the new drone defense center is the first part of a two-pillar strategy. As the second pillar, Dobrindt announced a new version of the Aviation Security Act in order to regulate the legal basis for defense measures.
DroneVation in Vienna - Austria discusses drones & drone defense. $RHM (+0,18 %)
Appropriate systems are needed for defense. The Austrian head of armaments was accordingly proud to announce that he was the first customer for Rheinmetall's Skyranger system. He was in Zurich just last week and was able to see the progress of the procurement. "I can tell you that the 3.5 cm cannon systems will arrive on time and on schedule."
Painful for the German Bundeswehr - it will have to wait longer than planned for its new Skyrangers. Austria will receive its 36 air defense turrets earlier. The German Armed Forces have selected the Pandur Evo from GDELS as the carrier platform, as the vehicle is also available in other functions in the troops.
https://defence-network.com/1-dronevation-oesterreich-diskutiert-drohnen/
$AVAV (-6,09 %)
AeroVironment: Step by step towards becoming a defense tech group
One of the biggest beneficiaries of the drone trend has traditionally been the US company AeroVironment from Arlington in the US state of Virginia. Founded in 1971, the company once made a name for itself with aircraft innovations and has been taking off as a drone supplier since the 2000s. AeroVironment primarily manufactures small and medium-sized reconnaissance drones and unmanned ground vehicles. Until 2025, AeroVironment was mainly known as a drone specialist, but in May the company bought defense technology provider BlueHalo for USD 4.1 billion as part of a share swap. Thanks to this acquisition, the company is now a diversified defense company with capabilities in space, drone defense, cyber, laser weapons and satellite technology. At the end of the third quarter of the 2025 financial year, the order backlog reached a record high of USD 764 million.
https://www.n-tv.de/wirtschaft/der_boersen_tag/Milliardendeal-Kampfdrohnen-Konzern-uebernimmt-Produzenten-von-Drohnenabwehr-article25372828.html
$FLT (-2,11 %)
While AeroVironment is valued at around USD 10 billion on the stock exchange, the Canadian drone specialist Volatus Aerospace, which has also been active for many years, only has a valuation of around EUR 200 million. Despite the significant difference in valuation, Volatus has also already proven that it is compatible with NATO standards. In 2025, Volatus landed NATO contracts in the areas of education and training as well as for the delivery of reconnaissance drones. Analyst Rob Goff from Ventum Capital sees these successes as indications of further potential for NATO contracts. Media reports repeatedly refer to Volatus' bulging order pipeline.
In addition to the military sector, Volatus also offers civilian solutions, for example for monitoring infrastructure such as bridges or pipelines, through to the Condor XL transport drone, with which the company intends to carry out test flights from the end of the year to test its use in the areas of logistics and forestry. Military use of such transport drones is also conceivable in principle.
$ESLT (-1,31 %)
Airborne lasers - the next generation of drone defense
While the ground-based laser weapon developed in Israel has already proven its effectiveness against drones, efforts to develop an airborne system have been intensified. The airborne laser program is being led by the Israeli company Elbit Systems. Meanwhile, the lasers developed as a defensive weapon are also being considered for offensive use.
https://defence-network.com/luftgestuetzte-laser-drohnenabwehr/
Israeli drone defense for German warships?
https://marineforum.online/israelische-drohnenabwehr-fuer-deutsche-kriegsschiffe/
Drone defense: Bundeswehr receives first interceptor drones from Argus Interception
https://www.hartpunkt.de/drohnenabwehr-bundeswehr-erhaelt-erste-fangdrohnen-von-argus-interception/
https://argus-interception.com/de/
$FQT (-4,29 %) Frequentis
https://getqu.in/j9ucf2/
$AXON (-0,12 %) (my dears, perhaps the Kassel-based company has a good chance)
US group Axon buys Kassel-based company Dedrone
The company Dedrone discovered a gap in the market for itself with the defense against approaching drones. With great success. Now it is being taken over by an American security company. The company site in Kassel is also set to benefit from this.
https://de.dedrone.com/
https://www.hessenschau.de/wirtschaft/us-konzern-axon-kauft-kasseler-unternehmen-dedrone-v1,dedrone-verkauft-100.html
$EOS (-4,01 %)
https://esut.de/2025/08/meldungen/62305/eos-liefert-100-kw-laser-drohnenabwehr/
https://getqu.in/dd0DoN/
Echodyne launches the EchoShield Rapid Deployment Kit on the market
With the proliferation of drones in the airspace, the need to quickly deploy situational awareness zones that detect, track, identify and contain threats is increasing. The RDK is designed for quick and easy deployment of four radars for robust, high-precision hemispheric coverage. The addition of the RDK to the EchoShield portfolio creates leading positions in all areas - from fixed sites to mobile deployments (OTM) to rapidly deployable temporary missions.
About Echodyne. $NOC (-0,62 %)
Echodyne, the radar platform company, is a U.S. designer and manufacturer of advanced commercial radar systems for defense, government and commercial market applications. The company combines the patented Metamaterials Electronically Scanned Array (MESA®) architecture with powerful software and machine learning to deliver highly accurate situational awareness data that locates airborne and ground-based activity with unmatched speed, accuracy and precision. Echodyne's products are proven and trusted by military, government, integrators and critical infrastructure around the world. They set a new standard for radar quality. The privately held company is headquartered in Kirkland (WA, USA) and is backed by Bill Gates, NEA, Madrona Venture Group, Baillie Gifford, Northrop Grumman and Supernal, among others. See Radar in action at Echodyne.com.
Rohde & Schwarz presents new multi-band jammer for drone defense.
(Rohde & Schwarz GmbH & Co. KG is a privately held company and therefore has no shares,)
https://www.hartpunkt.de/ardronis-effect-rohde-schwarz-praesentiert-neuen-multiband-stoersender-fuer-die-drohnenabwehr/