
Now that $BTC (-0,37 %) and altcoins have been bullish about the conflict in the Middle East and are now showing a breakout from the downtrend, one should zoom out and visualize the structure of the trend.
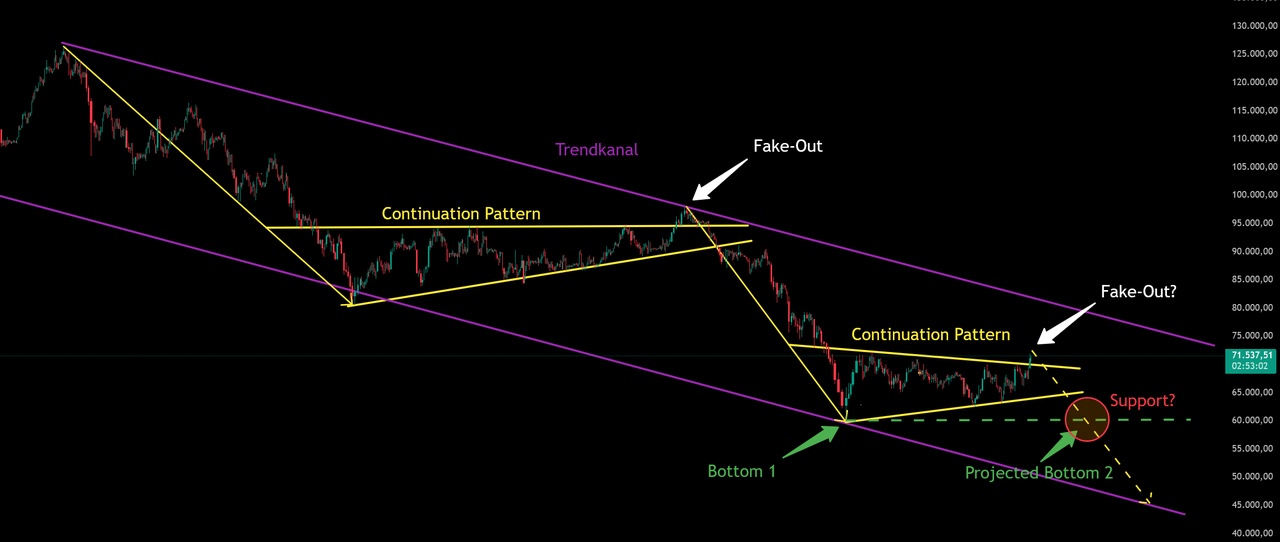
LILA - The price is still in a falling trend channel
YELLOW - Continuation pattern (bearish wedge)
WHITE - The most recent price movement suggests a fake-out like in mid-January
GREEN - The first bottom was formed at $60K
RED - A crucial area that could provide support and will be reached before the end of the downtrend
Projection
A V-shaped recovery, which is currently being hinted at, is extremely rare to see at the end of a bear market.
It is likely that the $60K mark will be broken and the bottom will be found in the $50K area - this would correspond to a classic 5-stage downtrend.
However, if another continuation pattern becomes visible in this area, it would go to the $38K area...
What is your strategy? Buy the dip, blunt savings plan or wait for a bottom?


