3D·

Performance in April

It was a friendly month. BUT: The better optics don't change the rules.
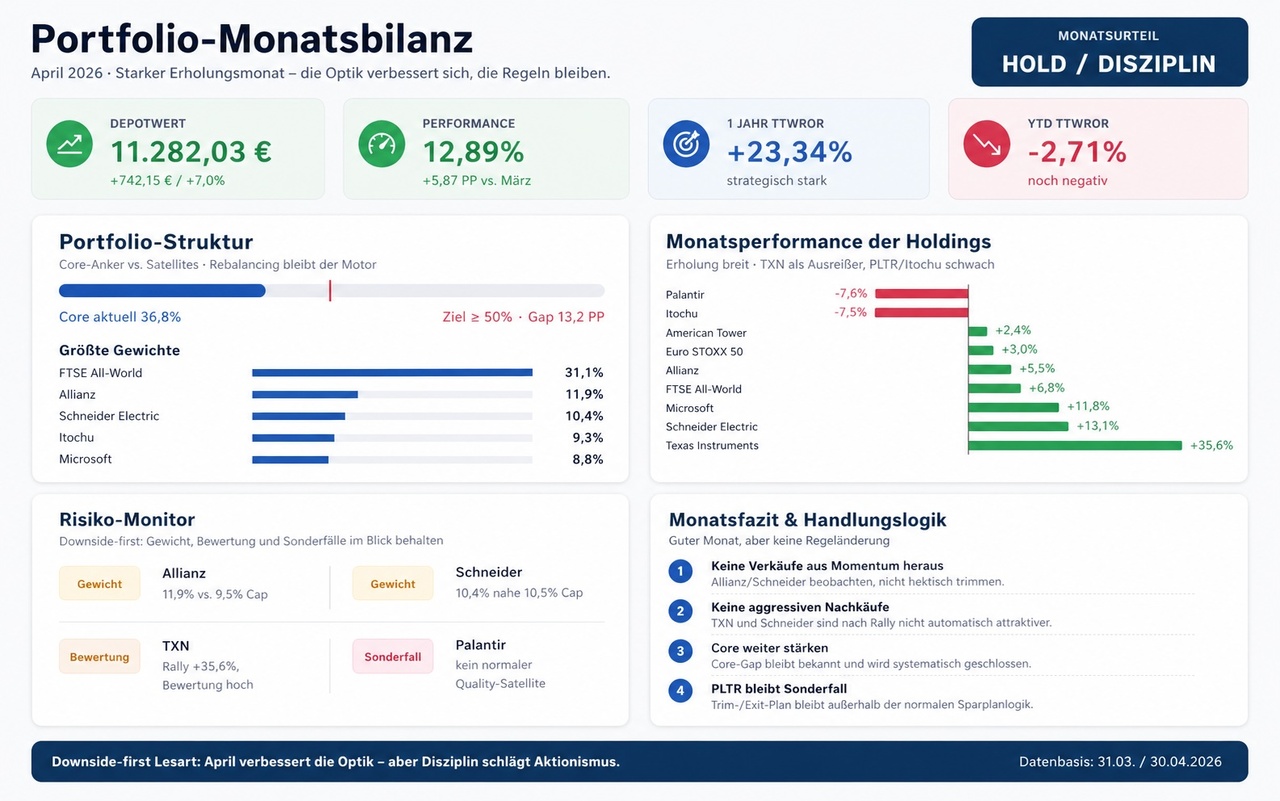
attachment

Allianz $ALV (+1,12 %) and Schneider $SU (-0,06 %) remain in view because of their weights, Texas Instruments $TXN (+4,71 %) is not a buy candidate after the rally, and Palantir $PLTR (+2,45 %) remains a special case with existing trim/exit logic (next trigger 150€).

9Puestos
11.318,23 €
13,25 %
7
10 Comentarios

interesting evaluation - where does it come from?
3
Imagen de perfil
I've been working with an assistant for a few months now. Chat GpTitty 😏 Is my sparring partner and creates reports for me. I'm still working on the content and structure of the infographics. It's the first draft from today.
1
Imagen de perfil
By the way, the data is based on my own performance sheet, which I created in Sheets and which I then use to feed the AI.
1
Imagen de perfil
@Stilgar It can't be worse than the tracker here. 👍🏼
4
Imagen de perfil
@Ash right. It's better for me personally. I prefer to do the evaluations myself. With 9 positions, it's also a manageable amount of work and a bit of fun.
1
@Stilgar I would be interested in the prompt for this
Imagen de perfil
@value_crafter_931 That's easy. But it's the input on the outside that does the work. I'm not taking it off your hands 😉 Once you have all the data and sources, the basic content prompt is this (I first have it clearly displayed as text and then ask you to create an infographic - and then you have to adjust it until it fits):

Create my portfolio monthly report April 2026 in the defined format of this project.

I will deliver:
1. current portfolio screenshot
2. portfolio screenshot of the previous month
3. current savings plan scoring screenshot
4. current return/TTWROR screenshot YTD and 1 year

Please create the complete monthly report with these sections:
1. executive summary
2. portfolio overview
3. benchmark comparison
4. market overview
5. monitoring of the holdings with key figures
6. outlook: known catalysts next month
7. thesis check / change in investment thesis
8. risk monitor

Important rules:
- Work portfolio-centered, not as a general market commentary
- Strictly separate signal from noise
- No assumptions without data
- Benchmark comparison with FTSE All-World (Dist.) as main benchmark, S&P 500 (Dist.) as performance stress test and Berkshire Hathaway as quality reference
- Benchmark time frame: month, 12 months / 1 year and YTD
- 12 months / 1 year is the most important period for strategic judgment, YTD remains complementary
- for YTD and 12 months / 1 year use the TTWROR/return data from my screenshot, not just the change in portfolio size
- only derive actions if they are really justified
- calm, professional, downside-first"
2
Imagen de perfil
@NotBubble I also wrote something about my own tracking once. It has also developed a bit since then. https://getqu.in/jy4dt5/ https://getqu.in/jy4dt5/
Imagen de perfil
@NotBubble Can it analyze screenshots?
Or do you mean diagrams from Excel?
Imagen de perfil
@Smudeo yes, I can now read text from screenshots very well.
Únase a la conversación