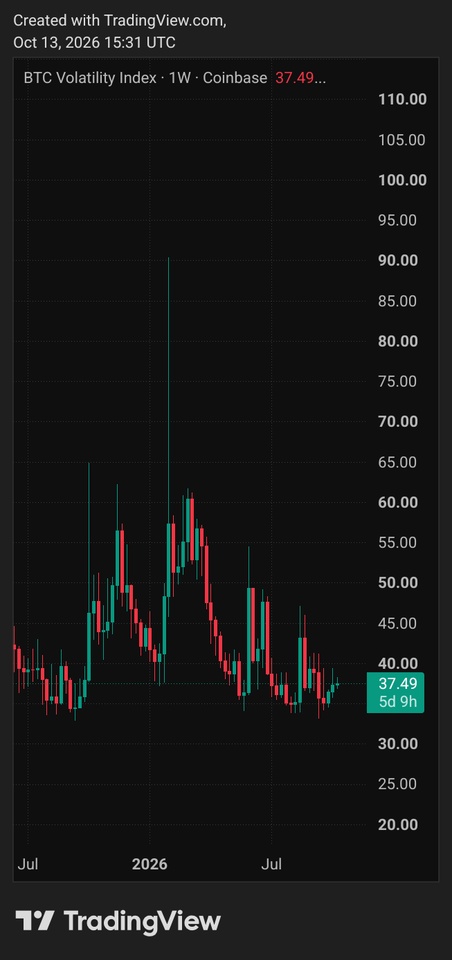
Long trends in high level position with US dollar index and Oil price in lines position its still have momentum from market trend and time laps from market index-stock market get return performance this years.
•Market Index | Volatility Index | Commodities
•Stock Market | ETF | Bitcoin
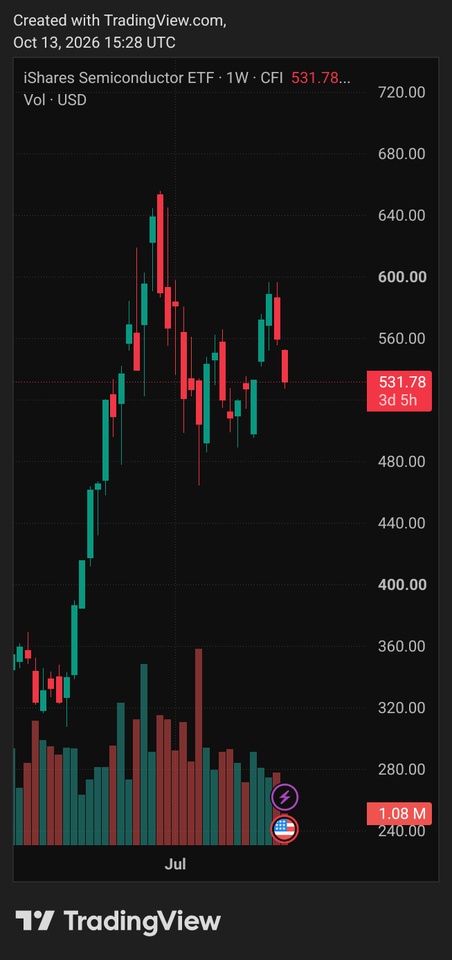
》$SOXX (-2,71 %) , $VGT (-1,73 %) , $ITA (+0,15 %) there is from semiconductor, information tech, aerospace & defence get performance to market after april in lower spot market position still have high attention until this month. What next ? If we have candle bars in chart, when get back in top parabolic cycle time ? ✅️⌛️
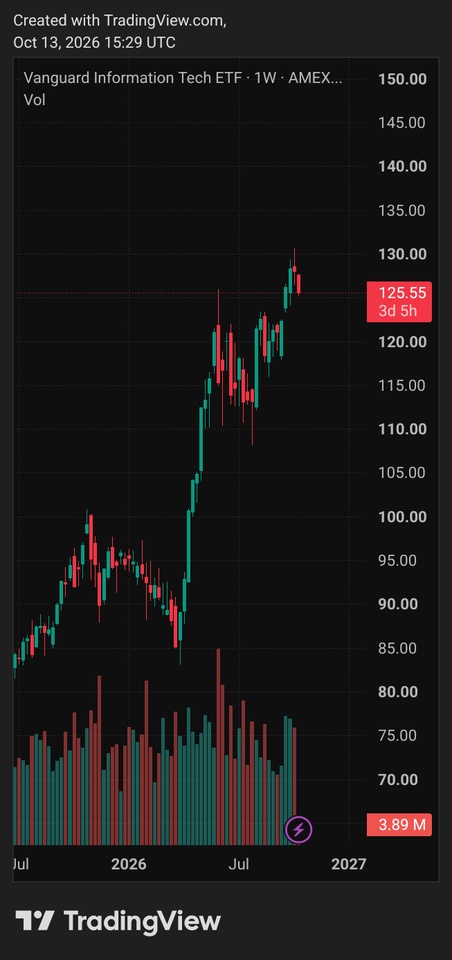
•After split stock get run to fast and movement high lines position. ETF and stock market have a reason for that and reasonable this years from split stock could makes support in stock market get more high price.
•Market need parabolic cycle its same at the time with split stock. Value in lines | Prices in share unit.
• November on best time to buy ✅️⌛️
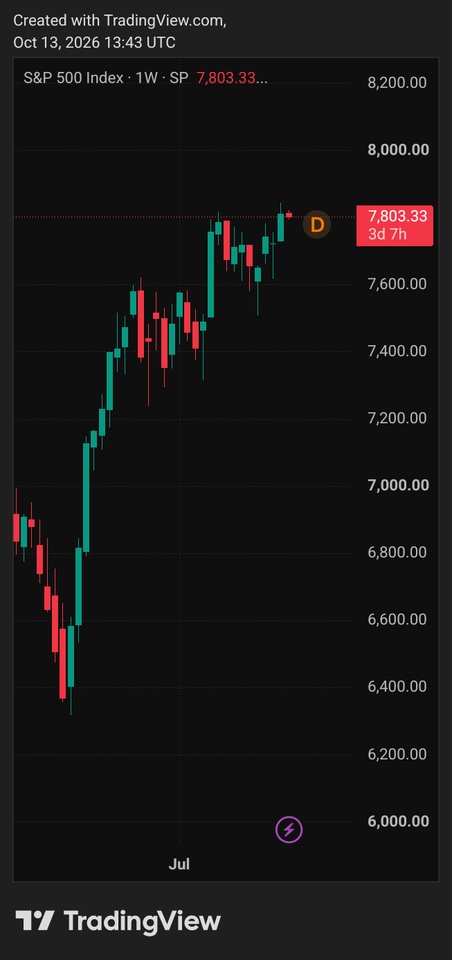
• Bitcoin Halving in traditional event, remember lines position 60K and peak top 126K, $BTC (-0,01 %) can do its get performance with counter point in bullish 100%-150% and bearish 50%-70%.
• Every 4 years in cycle frame time, $BTC (-0,01 %) keep its and show up performance for market trends and more powerfull give altcoins get "to the moon" like zcash and another altcoins have story this time.