

Currently fairly valued, savings plan can run.
Debate sobre MSCI
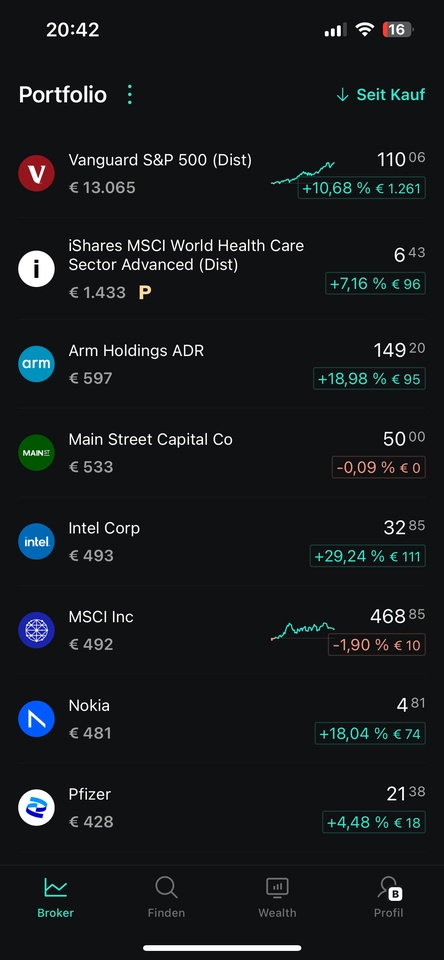
Puestos
55


6D·
Oct 16 / MSCI & S&P Global — Safe Havens or Just Fancy Savings Accounts?
When Boring Becomes Beautiful
Every investor has those names they look at during chaotic weeks — the ones you could own, forget, and come back years later to find them quietly compounding like nothing ever happened. For me (and probably for many others), two of those names are MSCI and S&P Global. The giants behind the numbers, the indexes, and the ratings. The invisible backbone of the market that doesn’t just move with it, it fuels it. MSCI and S&P Global have practically insurmountable moats, deeply embedded across markets and protected by laws and regulations. Hands down (quote me on that in 50 years), nobody is replacing those two as long as the U.S. remains capitalist.
I currently hold both, but honestly, you could sleep well with either. They don’t give each other much. S&P Global has slightly more diversity, MSCI a bit more growth. I own both because they build an anchor for my portfolio, together with other anti-cyclical, defensive names like UnitedHealth or Equifax. All those companies are still growing organically, which is why I bought into them, but what really differentiates them is their competitive position. MSCI and S&P Global aren’t necessarily about excitement or daily headlines; they’re about consistency, scale, and one of the strongest moats you’ll ever find. You can think of them as the paid infrastructure on Wall Street: every trade, every fund benchmark, every ETF launch pays them something. That’s a business model nobody can deny.
Still, the question stands: are they safe havens with upside, or just glorified savings accounts?
If you haven’t got the impression yet, I believe they are the former. Yes, they provide unparalleled safety compared to other stocks, but upside potential is real. Let’s start with what they share. Both have margins most CEOs can only dream about (operating in the 50–60% range) and recurring revenues that barely flinch even when markets crash. Both benefit from the same structural tailwinds: the unstoppable rise of passive investing, global standardization of data, and the growing demand for transparent ESG frameworks. In short, they profit from the existence of investing itself. As long as people buy stocks, these two get paid. Even in bad times, when people opt for index funds over stock-picking, there are no bigger winners than these two silent compounders.
Let’s get on with the differences. S&P Global is broader, spanning data, analytics, indices, and the all-important credit ratings business that has been printing cash for decades. It’s the more diversified of the two — a little less volatile, a little slower, but also a little less cyclical given its exposure to so many areas. MSCI, on the other hand, is the purer “index and data” play. It rides the ETF and passive investing wave directly. If you believe that trend is still intact (and I do), MSCI is arguably the more direct winner. But it’s also more concentrated on one trend, even though it’s a big one.
In the current environment, with the Fear & Greed Index below 25, valuations painfully stretched, and Trump’s brain farts moving markets by the minute, I find myself gravitating toward companies where I can actually sleep. The “all-time high” market levels make adding risk feel wrong, but MSCI and S&P Global aren’t exactly risky plays. They’re the definition of resilient — companies that don’t just survive downturns but sometimes even benefit from them, as volatility spikes demand for data, research, and analytics. If markets crash, they might lose 10%, but honestly, who cares? Just buy more, and once you are confident enough in the future, rotate into more aggressive stocks. But let me stress again: both these names are likely to outperform the market anyway. Maybe not hyper-growth AI start-ups, but as quiet compounders capitalizing on secular trends, I wouldn’t count them out, even in a perma-bull market.
So, am I adding? Yes. I’m considering making both of them my absolute core — the kind of anchor you can build around when everything else starts wobbling. S&P Global is already my largest position, with a weighting around 7%, MSCI roughly half that. But as times become more uncertain, and markets continue to run as if nothing ever happened, I seriously consider rotating further into these fortresses.
88
2 Comentarios
2Semana·
From a deposit of 100,000 euros, it practically works by itself... Is that right? 🤔
I bet you've heard this rule many times before. In any case, I don't know any "finance influencer" who doesn't pray this rule up and down and it goes down well with their audience... why? Because it seems achievable. 100k in the portfolio is within the imagination, while portfolio sizes beyond millions seem too far-fetched for many!
👉🏻 In order to convince people of the importance of the rule, all kinds of statistics are brought out. First and foremost, the time until the "next 100k" as proof of the compound interest effect, which makes the work from then on virtually by itself.
And for those who are still not completely convinced, the quote from Charlie Munger (Warren Buffett's No. 2) is thrown around: "Accumulating the first 100,000 is the most difficult and the most important part!". And who wants to contradict one of the most successful investors of all time? 😅
But let's take a closer look at the details:
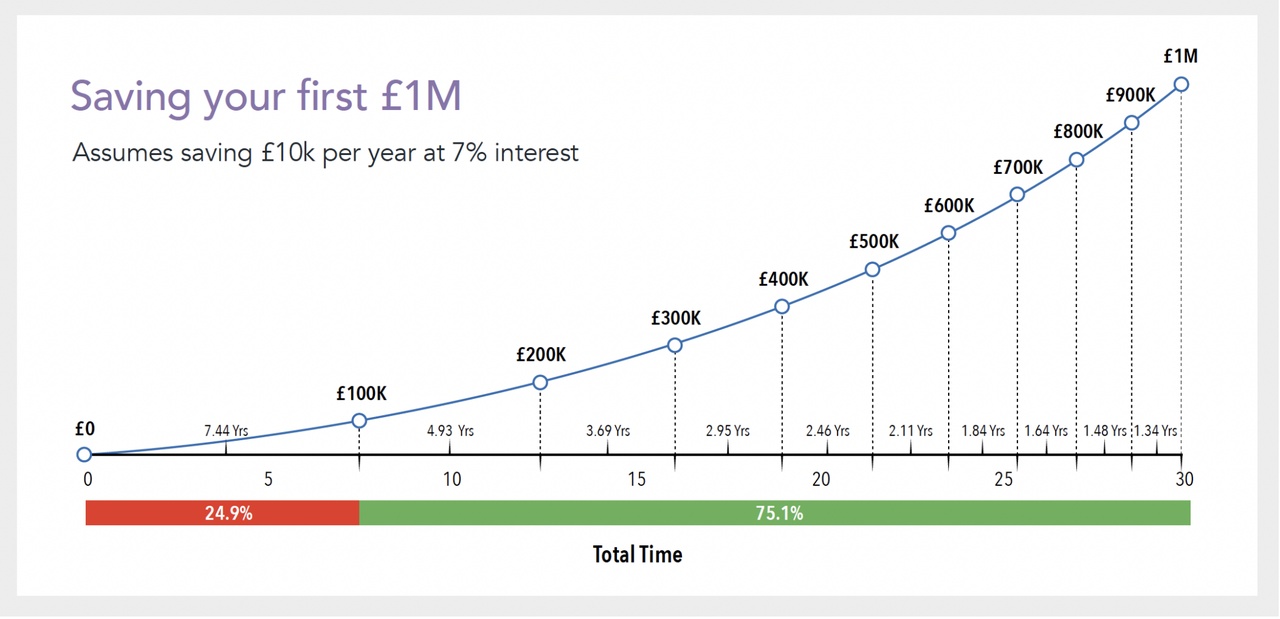
Let's assume we are able to save 10,000 euros per year...
Deposit value start: -> end -> of which saved: -> in years
0 -> 100k -> approx. 70k saved -> 7.44 years
100k -> 200k -> approx. 120k saved -> 12.37 (+4.93) years
200k -> 300k -> approx. 160k saved -> 16.06 (+3.69) years
300k -> 400k -> approx. 190k saved -> 19.01 (+2.95) years
400k -> 500k -> approx. 215k saved -> 21.47 (+2.47) years
...
It's true, after the first 100k, the investment income just exceeds the deposits under the given assumptions.
But there are two things to consider...
➡️ 0 taxes: Here it is assumed that you will never receive dividends and / or realize capital gains and therefore have to pay tax. All profits are reinvested. In reality, this will apply to very few people.
➡️ Real return: In addition, 100k in 7 years is not worth 100k today. The real return (adjusted for inflation by approx. 3% p.a.) on the MSCI World is closer to 5%, at least since 1970. This chart assumes a very optimistic case. If we take the 5% as a basis, we will only reach the first 100k after well over 8 years.
In addition to the obvious shortcomings of this glorified rule, there are also very practical disadvantages over such a long period of time:
If you start at 30, in theory you reach your first half million at around early 50-55. For most people, there is a gap in between:
👉🏻 Starting a family
👉🏻 Buying / financing a property
👉🏻 Strokes of fate, caring for parents in old age, etc.
This means that very few people will be able to keep up this kind of saving and will have to start saving earlier. This means that all the magic is gone.
And what about Charlie Munger's statement? Well, he made the statement in the 1960s. 100k back then is equivalent to around 1 million euros today. 💵
And that's exactly the point. The 100k shouldn't be an end in itself, it should have a noticeable positive effect on your everyday life. That's what they had in the 1960s ... Today, you need at least 1 million euros, if not more.
However, this message is no longer so sexy, because for many people this is unattainable, especially in their early years (Buffett had his first million dollars at around 30!!!). -> that corresponds to at least 4-5 million euros today). But this message doesn't generate likes and clicks... 😉
What is your opinion on this?
7878
33 Comentarios
2Semana
100k or not, but don't forget to live a little too
•
3535
•


1Lun·
📈 August 2025 Portfolio Recap – First Month in Review
Introduction
It has now been a little bit over a month since I published my first portfolio review. I started this portfolio on July 23 and will continue to share monthly recaps from now to, hopefully, a very long time. My goal with these updates is simple: transparency. They are to document performance regularly, explain my investment process, and create a track record of decisions that I can learn from and reflect on over time. I will focus on what worked and what did not, while keeping the macro picture and long-term perspective over short-term volatility in mind. As I pointed out in my last review, I strive to become a hedge fund manager, and while there is still a long way to go, and many lessons to be learned, this portfolio will be my primary credential for the future.
Unlike a traditional investor letter, this recap is designed to be professional yet approachable, so it can serve as a portfolio log and as a resource or inspiration for anyone interested in equity investing. Yes, I am doing this primarily because I love investing and diving into company reports and stock market news, but I also want to share my journey and hopefully be able to use my passion in a professional setting. Every month, I will share performance vs. benchmark indices, most suitable to asset allocation, highlights of the strongest and weakest performance, and any changes I have made to my portfolio. This is not about sugarcoating results. Since I genuinely want to improve, there is no point in trying to sweet talk mistakes and slip-ups. Over time, this series should build a narrative of my investing journey, through wins, theses, and most importantly long-term performance and improvement. My daily commentary usually serves as an opinion piece on companies on my watchlist or the most recent macro news, while these monthly recaps are intended to provide a comprehensive guide on my investing principles and execution.
Portfolio Performance
For the month of August, my portfolio delivered a strong +5.25% total return. Not a bad start for month one, but it is always important to remember that short-term gains are not the most meaningful metric. Consistency is key. Nevertheless, to put this month’s return in perspective, here are important benchmarks:
- S&P 500: +3.33%
- Nasdaq 100: +2.42%
- MSCI ACWI: +3.84%
This means the portfolio outperformed both global and U.S. benchmarks in its first full month, which is encouraging.
However, the performance was not linear. The first few days were negative, but as the month progressed, companies reported earnings and news surfaced, several key holdings – particularly those in healthcare and fintech – drove strong upward momentum. This led to an intersection between my portfolio performance and benchmarks around the middle of the month. Since then, the portfolio has outpaced the market’s broader rally.
The outperformance cannot be attributed to one single stock, but rather a combination of multiple holdings reacting strongly. This is exactly how I want my portfolio to behave: diversified enough to avoid cluster risk, but concentrated enough to benefit meaningfully from each of my highest-conviction ideas. It is crucial to strike the balance between diversification and conviction, without sacrificing returns or risk management.
Allocation Snapshot
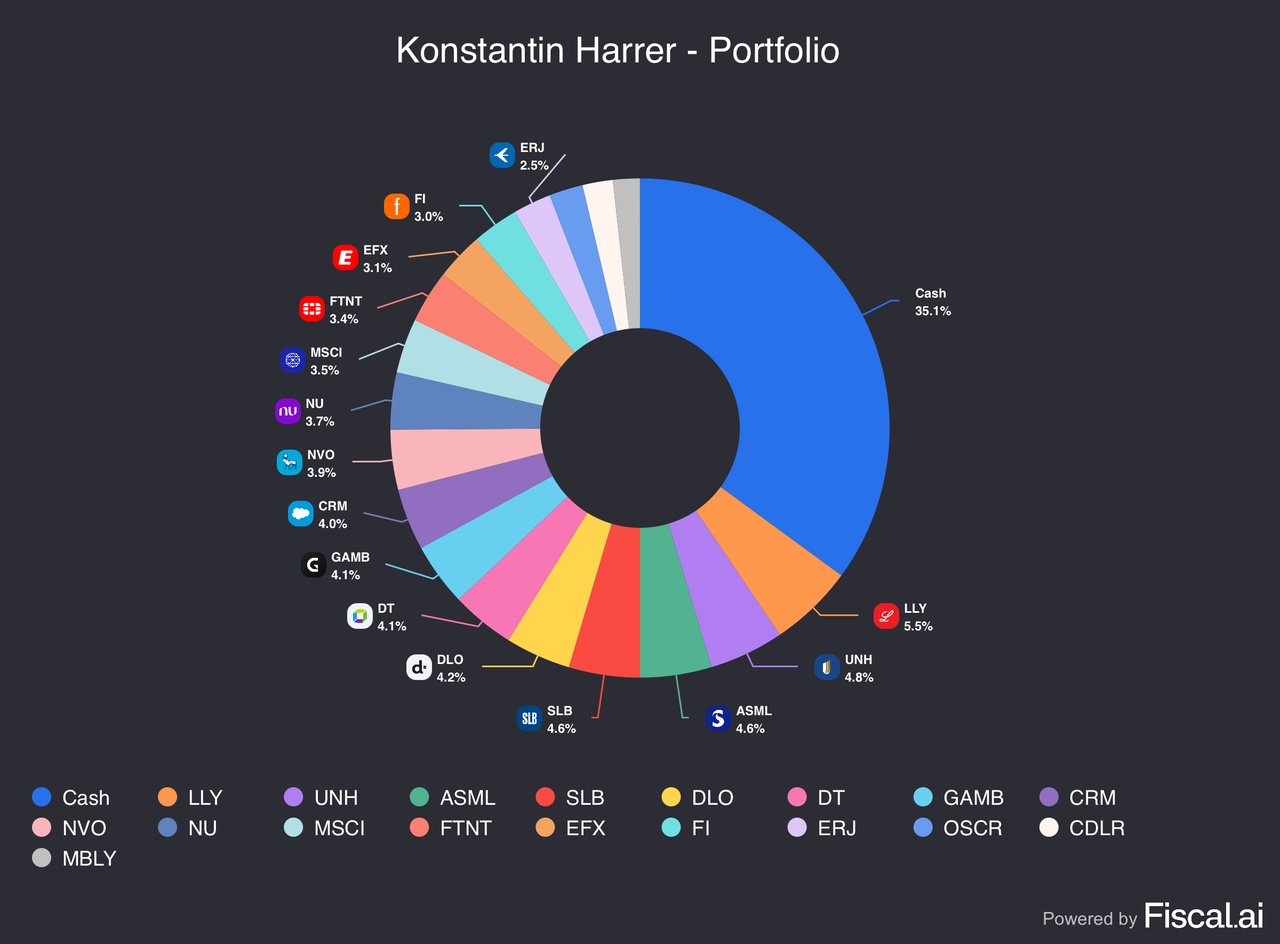
The portfolio currently consists of 18 equity holdings plus cash, with cash representing the single largest allocation at 35.1%.
This is a short breakdown of my portfolio:
- Cash: 35.1%
- Largest equity holding: Eli Lilly (LLY) at 5.5%
- Other top allocations include: UNH (4.8%), ASML (4.6%), SLB (4.6%), DLocal (4.2%), Dynatrace (4.1%), Gambling.com (4.1%), Salesforce (4.0%), Novo Nordisk (3.9%), and Nu (3.7%).
The high cash balance is intentional. As this is the first month of the portfolio, it is important not to rush into not-well-enough researched positions only to reduce the cash quota. Even for my highest-conviction positions, like LLY or ASML, I want to remain disciplined with entry prices and only buy on pullbacks, after I initiate my first tranche. As I emphasized in my last report, I aim to invest opportunistically in great companies at discounts, and reduce my cash balance to below 10% by the end of the year. In fact, over the course of August I already reduced my cash position from 56% to 35%, by adding to and opening new positions, especially during the first half of the month.
However, I am not in a rush to close my cash holding right now, since I am convinced that this rally off the April lows is highly unsustainable, considering the economic tensions and tariff regime in place. AI hype is driving this rally, and if the enthusiasm cools down, some interesting opportunities could present.
Since I aim for high returns with acceptable risk management, the exposure to fast-growing industries like fintech and software comes naturally. However, I also own more defensive players in the energy and healthcare spaces that, in my opinion, offer a healthy risk/reward ratio not recognized enough by the market. Indeed, some of the companies I hold fall on the more expensive spectrum, but they also boast immense growth and potential for the future. My focus does not lie on momentum or trends, but rather fundamentals and underlying prospects.
Strongest & Weakest Performers
Strongest performers:
- DLocal posted strong earnings in a volatile market environment, which led to a jump in the stock of more than 40% the day after. I remain extremely bullish on the company, with a forward P/E ratio of 23, reflecting a more than fair valuation even after the recent rally. The fintech disruptor is revolutionizing payment solutions across emerging markets, with still a massive TAM left.
- UnitedHealth recovered more than 30% from the lows hit at the beginning of the month, due to improving sentiment and the news of several super-investors, most notably Buffett’s Berkshire Hathaway, opening a position in the healthcare giant. The company has a very healthy balance sheet and a strong moat as the largest health insurer worldwide, and that is not even taking into account all its other ventures.
- Nubank outperformed on strong user growth (over 127 million customers across Latin America) and rising profitability. As the leading neobank in Latin America, Nu delivers >25% annual growth and holds a stellar position. The TAM is hard to overlook, as the neobank operates in one of the most underbanked regions worldwide.
Weakest performers:
- Salesforce slightly recovered from recently hit lows, while still underperforming the broader tech sector due to a perceived lack of AI implementation. However, Salesforce is the largest provider of CRM services worldwide and in a very good position for a recovery if any good news hits. The company has not taken part in the recent rally and could be in for a rebound.
- Gambling.com sold off after solid earnings due to a cautious outlook. Online betting is inherently cyclical, and the current economic situation does not look great. However, Gambling.com is already trading at an extremely cheap valuation. Somehow, the market still finds a way to send the stock further down.
In both cases, I view the weakness as sentiment-driven rather than structural. Investors’ confidence is shattered at the moment. However, my theses on these companies have not changed. I think both of them are misunderstood and victims of short-term focus, rather than the broader picture.
Portfolio Activity
Because this was the first month, most activity was centered around building initial positions. I deliberately capped position sizes at ~3–5% each, which allows me to add more over time if conviction grows or valuations improve.
- New Buys: SLB, FTNT, DT, CDLR
- Adds: CRM, GAMB, LLY, UNH
- Sells: M12
- Cash: Meaningfully reduced from >55% to ~35%
My portfolio is still “under construction.” While I reduced my cash position and invested aggressively, especially after earnings hit, I still hold a significant chunk of my portfolio in cash, which I plan to reduce by the end of the year. When I decide to buy into a company, I always do it in tranches and build a position over time, rather than buying all at once. Take Lilly for example: I opened an initial position in July and then bought multiple times this month after the earnings-related dip, and now I am almost 10% in the green with the position.
Market & Macro Context
Markets in August were shaped mainly by speculation around interest rate cuts and the earnings season, both of which contributed positively to my return. Several of my holdings jumped after stellar earnings, while others fell and therefore created opportunities to add, increasing long-term upside. Economic data was two-edged: while unemployment continued to increase, so did GDP, and tariff impacts were largely absorbed by corporations. My portfolio specifically profited from improving sentiment around some beaten-up healthcare names and increasing momentum for fintech and Latin American stocks. August has also been a good month for many tech investors due to continued growth and AI momentum.
Outlook
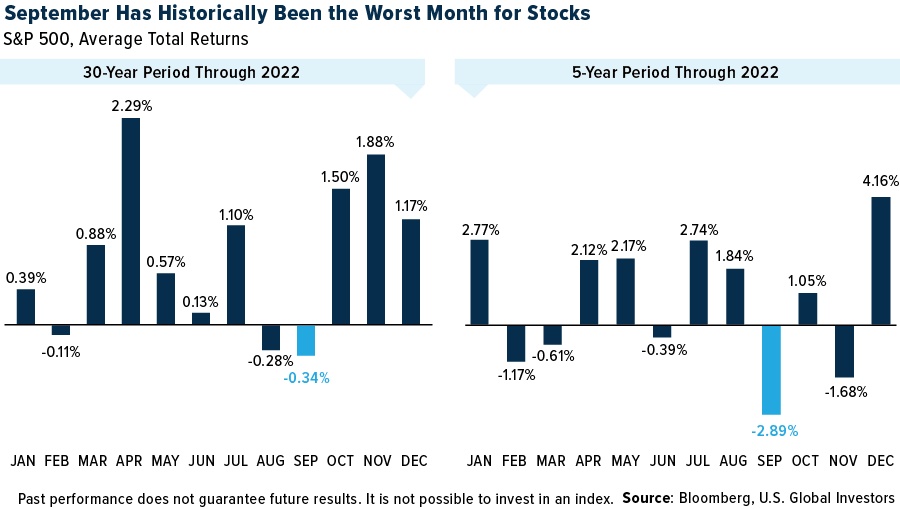
September historically is a very difficult month for markets. These are the key catalysts I will be looking at over the next month:
Jerome Powell has hinted at a possible rate cut at the next meeting, which the market has now priced in. It seems likely, at this point, that interest rates will be falling. However, if the Fed has a sudden change of heart, it could mean a cold awakening for stocks across the board.
On the other hand, if the most likely scenario – a rate cut – comes in, the already started shift from tech stocks to more cyclical industries profiting from lower interest rates could get a boost in September.
Apart from that, I still wholeheartedly believe that the current recovery rally from April lows is highly unsustainable and will eventually cool down, which could create buying opportunities. Whether that will be in September or a later month, I cannot determine. However, it seems strange to have such bullish sentiment ruling the markets, considering the tariff-inflicted strain on the economy. If signs of a cooling cycle thicken, markets could tumble very quickly.
Nevertheless, I am not worried about a broader pullback, since conviction is unwavering for the holdings in my portfolio. If anything, selloffs create possibilities to add to existing holdings or initiate new positions at attractive entry prices.
Closing Thoughts
This first month has been a promising start, with outperformance vs. benchmarks, and multiple adds to my highest-conviction positions. My strategy of investing opportunistically has proven correct so far. However, it has only been one month and I understand that markets fluctuate, which means that patience is key. While it is tempting to deploy cash all at once in order to ride the rally, that is not how I play the game.
In my daily comments I talked about many companies on my watchlist, some of which I will probably never own, because they do not reach my entry prices. That is not important. I have my eyes on countless stocks and continue to research new companies every day. There are always opportunities in the market, and often they are the ones most under fire.
Furthermore, I look forward to continuing this series monthly. Transparency, accountability, and consistency are the main goals. I strive to be the best investor I can possibly be, and this is my log. The target is as clear as ever: beating the market consistently and transforming that experience into the real world.
$ACWU (+0,53 %)
$LYPS (+0,67 %)
$CSNDX (+0,82 %)
$LLY (+0,54 %)
$UNH (+1,21 %)
$ASML (-0,02 %)
$ASML (-0,45 %)
$SLB (-0,56 %)
$DT (+0,7 %)
$DLO
$CRM (-0,22 %)
$GAMB (-1,89 %)
$NOVO B (+0,13 %)
$NVO (-0,44 %)
$NU (+0,33 %)
$NU
$MSCI (+0,6 %)
$FTNT (+0,84 %)
$EFX (+1,01 %)
$FI (+1,1 %)
$ERJ (+0 %)
$OSCR (+7,64 %)
$CDLR (-1,82 %)
$CADLR (-2,03 %)
$MBLY
+ 5
19Puestos
155.179,63 US$
4,21 %

2Lun·
Megatrend robotics, freshly updated, added value guaranteed!
After my first post on humanoid robots received a lot of positive feedback, I went into more detail. I have subsequently added my favorites in each sector.
Extended analysis of the value chain including shovel manufacturers and potential hidden champions
New categorySecondary key sectors (sales, marketing, financing)
In additionTop 25 companies worldwide, as well as Top 10 Europe and Top 10 Asia
I have also added a video link for beginners. This will give you an idea of how far the development of humanoid robotics has already progressed.
Thank you for your attention and your support 🙏
🌐 1. value chain of humanoid robots (with hidden champions)
1. research & chip design
$ARM (+1,87 %) ARM (UK) - CPU-IP, energy-efficient processors
$SNPS (+2,1 %) Synopsys (US) - EDA software, chip design
$CDNS (+2,6 %) Cadence (US) - EDA & Simulation
$PTC PTC (US) - Engineering Software, CAD/PLM
$DSY (-3,76 %) Dassault Systèmes (FR) - 3D Design & Digital Twin
$SIE (+1,06 %) Siemens (DE) - Industrial Software & Lifecycle Mgmt
$ADBE (-0,07 %) Adobe (US) - Design, AR/UX
ANSYS (US) - multiphysical simulation - acquisition by Synopsis
Altair (US) - CAE, simulation, digital twin - acquisition by Siemens
$HXGBY (+6,28 %)
Hexagon (SE) - Metrology & Simulation
$AWE (-0,24 %) Alphawave IP Group (UK) - High-speed chip IP for AI/robotics
1.Synopsis, 2.Siemens and 3.Adobe are my top 3 in this sector
2. manufacturing technology & equipment
$ASML (-0,02 %) ASML (NL) - Lithography (EUV)
$AMAT (+1,63 %) Applied Materials (US) - Semiconductor equipment
$8035 (+0,69 %) Tokyo Electron (JP) - wafer fabrication
$KEYS (+1,6 %) Keysight Technologies (US) - Metrology
$6857 (+2,14 %) Advantest (JP) - Chip test systems
$TER (-0,28 %) Teradyne (US) - test systems + cobots
$6954 (+1,06 %) Fanuc (JP) - Industrial robots, CNC
$CAT (+0,5 %) Caterpillar (US) - autonomous machines
$KU2G KUKA (DE) - industrial robots
Comau (IT) - automation - not listed on the stock exchange
$ROK Rockwell Automation (US) - industrial automation
$JBL (+1,76 %) Jabil (US) - contract manufacturing (EMS/ODM)
$KIT (+2,74 %) Kitron (NO) - European EMS/ODM manufacturer
$AIXA (+1,18 %) Aixtron (DE) - deposition equipment for compound semiconductors
$LRCX (+2,75 %)
Lam Research (US) - Etch/deposition systems
$MKSI (+1,53 %)
MKS Instruments (US) - Plasma/vacuum technology
$ASM (+1,76 %)
ASM International (NL) - Deposition systems
1.ASML, 2.Keysight Technologies, 3.Fanuc are my top 3 in this sector
3. chip manufacturing (foundries)
$TSM (+1,4 %) TSMC (TW) - leading foundry
$SMSN Samsung Electronics (KR) - foundry + memory
$GFS (+1,19 %) GlobalFoundries (US) - specialty chips
$INTC (-7,3 %)
Intel Foundry Services (US) - new western foundry player
$981
SMIC (CN) - largest Chinese foundry
$UMC
UMC (TW) - Power/RF/Embedded chips
1.TSMC, 2.Intel, 3.Samsung Electronics are my top 3 in this sector
4. computing & control unit ("brain")
$NVDA (+2,31 %) Nvidia (US) - GPUs, AI chips
$INTC (-7,3 %) Intel (US) - CPUs, FPGAs
$AMD (+6,32 %) AMD (US) - CPUs, GPUs
$MRVL (+4,17 %) Marvell (US) - Network Chips
$MU (+5,61 %) Micron (US) - Memory
$DELL (+2,26 %) Dell Technologies (US) - Edge & Infrastructure
Graphcore (UK) - AI chips (IPU) - not a listed company
Cerebras (US) - Wafer-scale engine - not a listed company
SiPearl (FR) - European HPC chip - not a listed company
1.Nvidia, 2.Marvell, 3.Micron are my top 3 in this sector
5. sensors ("senses")
$6758 (-1,01 %) Sony (JP) - image sensors
$6861 (+0,72 %) Keyence (JP) - Industrial sensors
$STM (-2,28 %) STMicroelectronics (FR/IT) - Sensors, MCUs
$TDY Teledyne (US) - optical/infrared sensors
$CGNX (+0,65 %) Cognex (US) - Machine Vision
$HON (-2,23 %) Honeywell (US) - sensor technology, security
ANYbotics (CH) - autonomous sensor fusion - not a listed company
$AMBA (+2,55 %) Ambarella (US) - video & computer vision SoCs for real-time image recognition
$OUST
Velodyne Lidar (US) - Lidar sensors - acquisition by Ouster
$AMS (+0,24 %)
OSRAM (AT/DE) - optical sensors
1.Teledyne, 2.Keyence, 3.Ouster are my top 3 in this sector
6. actuators & power electronics ("muscles")
$IFX (-0,02 %) Infineon (DE) - Power Electronics
$ON (-2,29 %) onsemi (US) - Power & Sensors
$TXN (-1,56 %) Texas Instruments (US) - Mixed-Signal Chips
$ADI (-1,19 %) Analog Devices (US) - Signal Processing
$PH Parker-Hannifin (US) - Hydraulics/Pneumatics
$MP (+3,04 %) MP Materials (US) - Magnets
$APH (-0,89 %) Amphenol (US) - Connectors
$6481 (+1,64 %) THK (JP) - Linear guides & actuators
$6324 (+3,78 %)
Harmonic Drive (JP) - Precision gears & servo drives for robotics
$6594 (+3,38 %)
Nidec (JP) - Electric motors
$6506 (+1,66 %)
Yaskawa (JP) - Drives & Robotics
$SU (+1,65 %)
Schneider Electric (FR) - Energy & control solutions
$ZIL2 (-1,56 %)
ElringKlinger (DE) - Battery & fuel cell technology, lightweight construction
1.Parker-Hannifin, 2.MP Materials, 3.Infinion are my top 3 in this sector
7. communication & networking ("nerves")
$QCOM (-0,49 %) Qualcomm (US) - mobile communications, edge AI
$ANET (-0,02 %) Arista Networks (US) - Networks
$CSCO (+0,2 %) Cisco (US) - Networks, Security
$EQIX (+0,56 %) Equinix (US) - Data centers
NTT Docomo (JP) - 5G/6G carrier - not a listed company
$VZ Verizon (US) - Telecommunications
$SFTBY SoftBank (JP) - Carrier + Robotics
$ERIC B (-0,5 %)
Ericsson (SE) - 5G/IoT infrastructure
$NOKIA (+1,13 %)
Nokia (FI) - 5G/6G for industry
$HPE (+0,85 %)
Juniper Networks (US) - Network technology - acquisition by HP
1.Arista Networks, 2.SoftBank, 3.Cisco are my top 3 in this sector
8. energy supply
$3750 (+2,68 %) CATL (CN) - Batteries
$6752 (+1,71 %) Panasonic (JP) - Batteries
$373220 LG Energy (KR) - Batteries
$ALB (+8,64 %) Albemarle (US) - Lithium
$LYC (+0,33 %) Lynas (AU) - Rare earths
$UMICY (-1,44 %) Umicore (BE) - recycling
WiTricity (US) - inductive charging - not a listed company
$ABBN (+0,44 %) Charging (CH) - charging infrastructure
$SLDP
Solid Power (US) - Solid state batteries
Northvolt (SE) - European batteries - not a listed company
$PLUG
Plug Power (US) - fuel cells
$KULR (+2,82 %)
KULR Technology (US) - Thermal management & battery safety for mobile systems
1.Albemarle, 2.CATL, 3.Panasonic are my top 3 in this sector
9. cloud & infrastructure
$AMZN (+1,56 %) Amazon AWS (US) - Cloud, AI
$MSFT (+0,63 %) Microsoft Azure (US) - Cloud, AI
$GOOG (+1,83 %) Alphabet Google Cloud (US) - Cloud, ML
$VRT
Vertiv Holdings (US) - Data center infrastructure (UPS, cooling, edge)
$ORCL (+1,12 %)
Oracle Cloud (US) - ERP + Cloud
$IBM (+8,06 %)
IBM Cloud (US) - Hybrid cloud + AI
$OVH (+0,92 %)
OVHcloud (FR) - European cloud
1.Alphabet, 2.Microsoft, 3.Oracle are my top 3 in this sector
10. software & data platforms
$PLTR (+2,29 %) Palantir (US) - Data integration
$DDOG (-0,63 %) Datadog (US) - Monitoring
$SNOW (+2,02 %) Snowflake (US) - Data Cloud
$ORCL (+1,12 %) Oracle (US) - Databases, ERP
$SAP (-3,22 %) SAP (DE) - ERP systems
$SPGI (+1,54 %) S&P Global (US) - financial/market data
ROS2 Foundation - robotics middleware - not listed on the stock exchange
$NVDA (+2,31 %) NVIDIA Isaac (US) - robotics development - part of Nvidia
$INOD (+2,8 %) Innodata (US) - data annotation & AI training data
$PATH (+6,86 %)
UiPath (RO/US) - Robotic process automation
$AI (-0,32 %)
C3.ai (US) - AI platform
$ESTC (+0,93 %)
(NL/US) - Search & data analysis
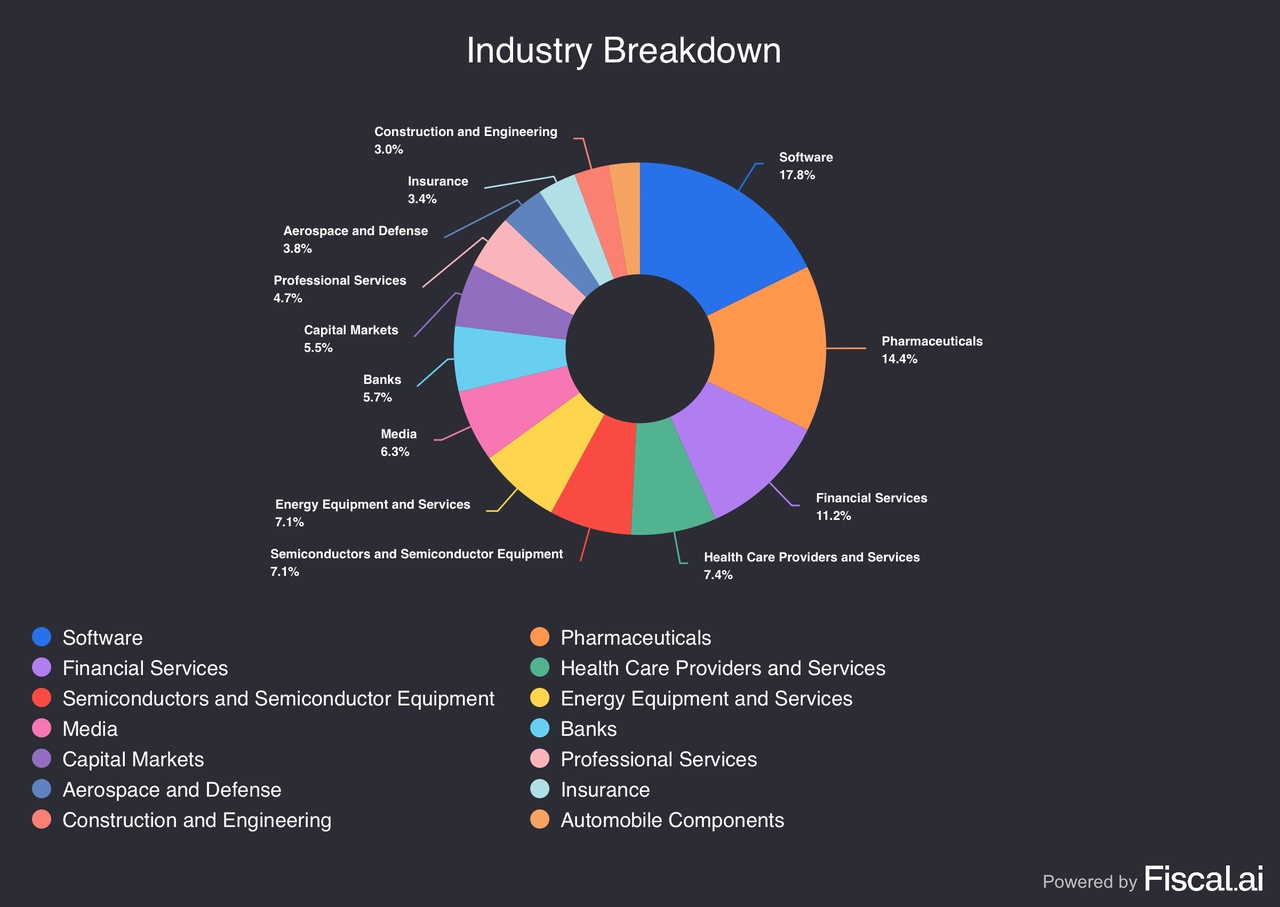
1.S&P Global, 2.Palantir, 3.Datadog are my top 3 in this sector
11. end applications / robots
$ABBN (+0,44 %) ABB (CH/SE) - Industrial Robots
$6954 (+1,06 %) Fanuc (JP) - Industrial robots
$TSLA (-3,07 %) Tesla Optimus (US) - humanoid robot
$9618 (-0,02 %) JD.com (CN) - logistics robot
$AAPL (+1,23 %) Apple (US) - Platform & UX
$700 (+0,67 %) Tencent (CN) - Platform & AI
$9988 (+1,45 %) Alibaba (CN) - logistics & platform
PAL Robotics (ES) - humanoid robots - not a listed company
Neura Robotics (DE) - cognitive humanoid robots - not a listed company
$TER (-0,28 %) Universal Robots (DK) - cobots - belongs to the Teradyne Corporation
Engineered Arts (UK) - humanoid robots - not a listed company
$ISRG (-1,06 %) Intuitive Surgical (US) - surgical robotics
$GMED (-0,93 %)
Globus Medical (US) - surgical robotics (ExcelsiusGPS platform)
$7012 (+4,77 %) Kawasaki Heavy Industries (JP) - industrial robots, automation
$CPNG (+0,21 %) Coupang (KR) - Logistics end user
$IRBT (+16,58 %)
iRobot (US) - consumer robotics (e.g. Roomba), non-humanoid, but navigation/sensor fusion
Boston Dynamics (US) - humanoid & mobile robots-no listed company
Hanson Robotics (HK) - humanoid robots (Sophia) - not a listed company
Agility Robotics (US) - humanoid robot "Digit" - not a listed company
1.Apple, 2.Tencent, 3.Alibaba are my top 3 in this sector
🛠 2. cross enablers (shovel manufacturers) - with hidden champions
Raw materials & battery materials
Albemarle - Lynas - Umicore
$SQM
SQM (CL) - Lithium
$ILU (-1,21 %)
Iluka Resources (AU) - Rare earths
$ARR (-6,93 %)
American Rare Earths (US/AU) - New supply chains
my number 1 in the sector is Albemarle
manufacturing technology
ASML - Applied Materials - Tokyo Electron
$LRCX (+2,75 %)
Lam Research (US) - Plasma/etching processes
$ASM (+1,76 %)
ASM International (NL) - ALD equipment
$MKSI (+1,53 %)
MKS Instruments (US) - Plasma/vacuum technology
my number 1 in the sector is ASML
Quality assurance
Keysight - Advantest - Teradyne
$EMR (-0,44 %)
National Instruments (US) - Measurement technology - from Emerson Electric adopted
$300567
ATE Test Systems (CN) - test systems
$FORM (+1,63 %)
FormFactor (US) - Wafer probing
my number 1 in the sector is Keysight
Motion & Drive
Parker-Hannifin
Festo (DE) - Pneumatics, Soft Robotics - not a listed company
Bosch Rexroth (DE) - Drives, Controls - not a listed company
$6481 (+1,64 %)
THK (JP) - Linear guides
my number 1 in the sector is Parker-Hannifin
Sensors/Imaging
$TDY Teledyne
$BSL (-0,6 %) Basler (DE) - Industrial cameras
FLIR (US) - Thermal imaging sensors - acquisition by Teledyne
ISRA Vision (DE) - Machine Vision - not a listed company
my number 1 in the sector is Teledyne
Magnets & Materials
MP Materials
$6501 (-0,16 %)
Hitachi Metals (JP) - Magnetic materials
VacuumSchmelze (DE) - Magnetic materials - not a listed company
$4063 (-0,86 %)
Shin-Etsu Chemical (JP) - Specialty materials
my number 1 in the sector is MP Materials
Chip Design & Simulation
Synopsys - Cadence - ARM
$SIE (+1,06 %)
Siemens EDA (DE/US)-Mentor Graphics-strategic business unit of Siemens AG
Imagination Tech (UK) - GPU-IP - not a listed company
$CEVA (+2,97 %)
CEVA (IL) - Signal Processor IP
my number 1 in the sector is Synopsys
Engineering & Lifecycle
PTC - Dassault - Siemens
Altair (US) - Simulation - no longer a listed company
$HXGBY (+6,28 %)
Hexagon (SE) - Metrology
$SNPS (+2,1 %)
ANSYS (US) - Simulation - takeover by Synopsys
my number 1 in the sector is Siemens
Networks & Data Centers
Arista - Cisco - Equinix
$HPE (+0,85 %)
Juniper (US) - Networks - Acquisition of HPE
$DTE (-1,36 %)
T-Systems (DE) - Industry cloud
$OVH (+0,92 %)
OVHcloud (FR) - European cloud
my number 1 in the sector is Arista
Cloud infrastructure
AWS - Azure - Google Cloud
$ORCL (+1,12 %)
Oracle Cloud (US) - ERP & databases
$IBM (+8,06 %)
IBM Cloud (US) - Hybrid Cloud
$9988 (+1,45 %)
Alibaba Cloud (CN) - Asian Cloud
$VRT
Vertiv Holdings (US) - Cloud/Infra
my number 1 in the sector is Alphabet (Google)
finance/information infra
S&P Global
$MCO (+2,02 %)
Moody's (US) - Ratings
$MSCI (+0,6 %)
MSCI (US) - Indices
$MORN
Morningstar (US) - Investment Research
my number 1 in the sector is S&P Global
Creative/Experience Infra
Adobe
$ADSK (+0,82 %)
Autodesk (US) - CAD & Design
$U
Unity (US) - 3D/AR simulation
Epic Games (US) - Unreal Engine - not a listed company
my number 1 in the sector is Adobe
Platform & Ecosystem
Apple - Tencent - Alibaba
$META (+0,46 %)
Meta (US) - AR/VR, Social Robotics
ByteDance (CN) - AI & platforms - not a listed company
$9888 (+1,67 %)
Baidu (CN) - AI & Cloud
my number 1 in the sector is Tencent
Infrastructure/Edge
Dell
$HPE (+0,85 %)
HPE (US) - Edge Computing
$SMCI
Supermicro (US) - AI servers
$6702 (+0,18 %)
Fujitsu (JP) - Edge & HPC
my number 1 in the sector is Dell
storage solutions
Micron
$HY9H
SK Hynix (KR) - Memory
$285A (+24,71 %)
Kioxia (JP) - NAND
$WDC
Western Digital (US) - Storage solutions
my number 1 in the sector is Micron
🏛 3. secondary key sectors with hidden champions
Financing & Capital
$GS (+4,07 %) Goldman Sachs (US) - investment bank; ECM/DCM, M&A, growth financing
$MS Morgan Stanley (US) - investment bank; tech banking, capital markets
$BLK (+0,33 %) BlackRock (US) - asset manager; capital allocation, ETFs/index funds
$9984 (+4,85 %) SoftBank Vision Fund (JP) - mega VC; growth equity in robotics/AI
Sequoia Capital (US) - venture capital; early/growth in AI/robotics - this is a classic venture capital fund
DARPA (US) - government R&D funding (robotics/defense) - independent research and development agency
EU Horizon (EU) - research funding/grants for DeepTech - Innovative Europe pillar
China State Funds (CN) - state industry/technology fund
Lux Capital (US) - VC for DeepTech - Uptake (US) - AI-based predictive maintenance
DCVC (US) - Robotics & AI focus - investing exclusively via VC fund investments
Speedinvest (AT) - EU VC for robotics - access to investment only via fund investments
my number 1 in the sector is Softbank
Maintenance & Service
$SIE (+1,06 %) Siemens (DE) - Industrial Service, Lifecycle & Retrofit
$ABBN (+0,44 %) ABB (CH/SE) - Robotics Service, Spare Parts, Field Support
$GEHC (+1,55 %) GE Healthcare (US) - Medtech service incl. robotic systems
Uptake (US) - AI-based predictive maintenance - not a listed company
Augury (US/IL) - condition monitoring, condition diagnostics - not a listed company
$KU2 KUKA Service (DE) - Robotics maintenance
$6954 (+1,06 %) Fanuc Service (JP) - global service network
Boston Dynamics AI Institute (US) - Robotics longevity - funded by Hyundai Motor Group
my number 1 in the sector is Siemens
Marketing & Advertising
$WPP (+0,24 %) WPP (UK) - global advertising group; branding/communications
$OMC Omnicom (US) - marketing/PR network
$PUB (-1,75 %) Publicis (FR) - communications/advertising group
$META (+0,46 %) Meta (US) - Digital Ads (Facebook/Instagram)
$GOOG (+1,83 %) Google Ads (US) - search & display advertising
TikTok / ByteDance (CN) - social ads & distribution - not a listed company
$AAPL (+1,23 %) Apple (US) - Branding/UX; Acceptance & Platform Marketing
$WPP (+0,24 %)
AKQA (UK/US) - Tech branding - Since 2012 majority owned by the WPP Groupbut continues to operate as an autonomous operating unit
R/GA (US) - Innovation marketing - not a listed company
Serviceplan (DE) - largest independent EU agency - not a listed company
my number 1 in the sector is Meta
Law, Regulation & Ethics
ISO (CH) - international standards, robotics standards
TÜV (DE) - certification & safety tests
UL (US) - safety/conformity testing
EU AI Act (EU) - legal framework for AI & robotics
UNESCO AI Ethics (UN) - global ethics guidelines
Fraunhofer IPA (DE) - Robotics safety standards
ANSI (US) - standards
IEC (CH) - Electrical engineering standards
Training & Talent
MIT (US) - Robotics/AI Research & Education
ETH Zurich (CH) - autonomous systems & robotics
Stanford (US) - AI/Robotics labs & spin-offs
Tsinghua University (CN) - Robotics/AI in Asia
CMU (US) - Robotics Institute
EPFL (CH) - Robotics research
TU Munich (DE) - humanoid robot "Roboy"
🌍 Top 25 companies for humanoid robotics
These companies are central to the development & production of humanoid robotsbecause without them, crucial parts of the chain would be missing:
Chips & computing power (brain of the robots)
$NVDA (+2,31 %) Nvidia (US) - AI GPUs & Isaac platform, foundation for robotic AI
$2330 TSMC (TW) - world's most important foundry, produces the AI chips
$ASML (-0,02 %) ASML (NL) - EUV lithography, indispensable for chip production
$005930 Samsung Electronics (KR) - memory, logic, foundry
$HY9H SK Hynix (KR) - DRAM & NAND memory for AI
$MU (+5,61 %) Micron (US) - Memory solutions for AI workloads
my number 1 in the sector is ASML
Sensors & perception (senses of robots)
$SONY Sony (JP) - image sensors, market leader
$6861 (+0,72 %) Keyence (JP) - Industrial sensors & vision systems
$CGNX (+0,65 %) Cognex (US) - Machine Vision, precise image processing
my number 1 in the sector is Keyence
Actuators & motion (muscles of robots)
$IFX (-0,02 %) Infineon (DE) - power electronics, motor control
$6594 (+3,38 %) Nidec (JP) - World market leader for electric motors
$PH Parker-Hannifin (US) - hydraulics/pneumatics, motion technology
$6481 (+1,64 %) THK (JP) - Linear guides & actuators
my number 1 in the sector is Parker-Hannifin
Communication, cloud & infrastructure (nerves & data flow)
$QCOM (-0,49 %) Qualcomm (US) - Mobile & Edge Chips
$AMZN (+1,56 %) Amazon AWS (US) - Cloud & AI infrastructure
$MSFT (+0,63 %) Microsoft Azure (US) - Cloud, AI services
$CSCO (+0,2 %) Cisco (US) - Networks & Security
$VRT Vertiv Holdings (US) - Data Center Infrastructure
my number 1 in the sector is Microsoft
End Applications & Platforms (robots themselves)
$TSLA (-3,07 %) Tesla (US) - humanoid robot Optimus
$ABBN (+0,44 %) ABB (CH/SE) - Robotics & Automation
$6954 (+1,06 %) Fanuc (JP) - industrial robots & CNC systems
$7012 (+4,77 %) Kawasaki Heavy Industries (JP) - industrial robots
PAL Robotics (ES) - humanoid robots (TALOS, ARI, TIAGo) - not a listed company
Neura Robotics (DE) - cognitive humanoid robots - not a listed company
Universal Robots (DK) - cobots
my number 1 in the sector is Tesla
🇪🇺 Top 10 European key companies for humanoid robotics
$ASML (-0,02 %)
ASML (NL)
World market leader in EUV lithography - no modern chips for AI & robotics without ASML.
$IFX (-0,02 %) Infineon (DE)
Leading in power electronics & motor control - crucial for actuators of humanoid robots.
$STM (-2,28 %)
STMicroelectronics (FR/IT)
Sensors, microcontrollers & power chips - the basis for control & perception.
$SAP (-3,22 %)
SAP (DE)
ERP & data platforms, important for integrating humanoid robots into industrial processes.
$SIE (+1,06 %)
Siemens (DE)
Industrial software, automation, digital twin - key for engineering & lifecycle management.
$KU2 KUKA (EN)
Robotics pioneer, industrial robots & automation - know-how for humanoid motion mechanics.
PAL Robotics (ES) - not a listed company
Specialist for humanoid robots (TALOS, ARI, TIAGo), internationally used in research & service.
Neura Robotics (DE) - Not a listed company
Young high-tech company, develops cognitive humanoid robots with advanced AI (4NE-1).
Universal Robots (DK) - Not a listed company
Market leader for cobots - platform for safe human-robot collaboration.
Engineered Arts (UK) - not a listed company
Develops humanoid robots such as Amecaknown for realistic facial expressions & gestures - important for HRI (Human-Robot Interaction)
🌏 Top 10 Asian key companies for humanoid robotics
$2330
TSMC (Taiwan)
World's largest semiconductor foundry, produces high-end chips (e.g. Nvidia, AMD, Apple) - no AI hardware without TSMC.
$005930
Samsung Electronics (South Korea)
Foundry, memory, logic chips, image sensors - extremely broadly positioned in robotics components.
$HY9H
SK Hynix (KR) - Memory
$SONY
Sony (Japan)
Market leader in CMOS image sensors, essential for robotic vision & perception.
$6861 (+0,72 %)
Keyence (Japan)
Sensor technology & machine vision for industrial automation, widely used in robotics.
$6954 (+1,06 %)
Fanuc (Japan)
Industrial robots & CNC systems, one of the most important manufacturers of robotics hardware worldwide.
$6506 (+1,66 %)
Yaskawa Electric (Japan)
Drives, motion control & robot arms - relevant for humanoid motion control.
$6594 (+3,38 %)
Nidec (Japan)
World market leader for electric motors (from mini motors to high-performance drives).
$7012 (+4,77 %)
Kawasaki Heavy Industries (JP) - Industrial robots
$9618 (-0,02 %)
JD.com (China)
Driver for robotics in e-commerce & logistics, invests in humanoid robotics applications

2Lun·
Build robots, earn shovels
The hype is all about humanoid robots, but the constant winners are in the background.
I have divided the analysis into two perspectives. 1. the complete value chain of humanoid robots, which shows all the players from the chip to the finished robot, and 2. the blade manufacturers in the background, who always earn money as enablers, regardless of which manufacturer wins the race.
ASML, Applied Materials and Tokyo Electron dominate in manufacturing technology. Quality assurance comes from Keysight, Advantest and Teradyne. Chip design is supported by Synopsys, Cadence and ARM. Data streams are secured by Arista Networks, Cisco and Equinix. The computing basis is created in the cloud by Amazon, Microsoft and Alphabet. Albemarle, Lynas and Umicore play a central role in raw materials and battery materials. These companies monetize their customers' investment waves, have high barriers to entry, service revenues and pricing power, but remain cyclical with risks from export rules, capex cuts and currency movements.
🌐 Value chain of humanoid robots Sector overview
1. research & chip design (IP / EDA)
$ARM (+1,87 %)
ARM Holdings (ARM, UK/USA) - CPU architectures
$SNPS (+2,1 %)
Synopsys (SNPS, USA) - Chip design software
$CDNS (+2,6 %)
Cadence Design Systems (CDNS, USA) - EDA & Simulation
2. manufacturing technology & equipment
$ASML (-0,02 %)
ASML (ASML, NL) - EUV lithography, key monopoly
$AMAT (+1,63 %)
Applied Materials (AMAT, USA) - Process equipment
$8035 (+0,69 %)
Tokyo Electron (8035.T, JP) - Wafer equipment
$KEYS (+1,6 %)
Keysight Technologies (KEYS, USA) - Test & RF measurement technology
$6857 (+2,14 %)
Advantest (6857.T, JP) - Semiconductor test systems
$TER (-0,28 %)
Teradyne (TER, USA) - Test systems + robotics (Universal Robots)
3. chip production (Foundries)
$TSM (+1,4 %)
TSMC (TSM, TW) - Largest contract manufacturer
$005930
Samsung Electronics (005930.KQ, KR) - Memory + Foundry
$GFS (+1,19 %)
GlobalFoundries (GFS, USA) - Specialized production
4. computing & control unit ("brain")
$NVDA (+2,31 %)
Nvidia (NVDA, USA) - GPUs, AI accelerators
$INTC (-7,3 %)
Intel (INTC, USA) - CPUs, FPGAs
$AMD (+6,32 %)
AMD (AMD, USA) - CPUs/GPUs
$MRVL (+4,17 %)
Marvell Technology (MRVL, USA) - Network/data center chips
5. sensors ("senses")
$6758 (-1,01 %)
Sony (6758.T, JP) - CMOS image sensors
$6861 (+0,72 %)
Keyence (6861.T, JP) - Vision systems, sensors
$STM (-2,28 %)
STMicroelectronics (STM, CH/FR) - MEMS sensors
6. actuators & power electronics ("muscles")
$IFX (-0,02 %)
Infineon (IFX, DE) - Power semiconductors, SiC
$ON (-2,29 %)
N Semiconductor (ON, USA) - SiC/Power Chips
$STM (-2,28 %)
STMicroelectronics (STM, CH/FR) - Motor control & power
$TXN (-1,56 %)
Texas Instruments (TXN, USA) - Motor control, power ICs
$ADI (-1,19 %)
Analog Devices (ADI, USA) - Energy & BMS chips
7. communication & networking ("nerves")
$QCOM (-0,49 %)
Qualcomm (QCOM, USA) - 5G/SoCs
$AVGO (+1,78 %)
Broadcom (AVGO, USA) - Network & radio chips
$SWKS (-2,22 %)
Skyworks Solutions (SWKS, USA) - RF components
8. energy supply
$300750
CATL (300750.SZ, CN) - Batteries
$6752 (+1,71 %)
Panasonic (6752.T, JP) - Batteries for automotive/robotics
$373220
LG Energy Solution (373220.KQ, KR) - Batteries
9. cloud & infrastructure
$AMZN (+1,56 %)
Amazon (AMZN, USA) - AWS
$MSFT (+0,63 %)
Microsoft (MSFT, USA) - Azure
$GOOG (+1,83 %)
Alphabet (GOOGL, USA) - Google Cloud
$EQIX (+0,56 %)
Equinix (EQIX, USA) - Data center operator
$ANET (-0,02 %)
Arista Networks (ANET, USA) - Network infrastructure
$CSCO (+0,2 %)
Cisco Systems (CSCO, USA) - Edge & Data Center Networks
10. software & data platforms
$PLTR (+2,29 %)
Palantir (PLTR, USA) - Data integration, decision software
$DDOG (-0,63 %)
Datadog (DDOG, USA) - Cloud monitoring / observability
$SNOW (+2,02 %)
Snowflake (SNOW, USA) - Cloud-native data platform
$ORCL (+1,12 %)
Oracle (ORCL, USA) - Databases, ERP
$SAP (-3,22 %)
SAP (SAP, DE) - ERP/cloud systems
$PATH (+6,86 %)
UiPath (PATH, USA) - Automation software (RPA)
$AI (-0,32 %)
C3.ai (AI, USA) - Enterprise AI platform
11. end applications / robots
$ABB
ABB (ABB, CH) - Industrial robots
$6954 (+1,06 %)
Fanuc (6954.T, JP) - Industrial robots, CNC
$TSLA (-3,07 %)
Tesla (TSLA, USA) - Optimus" humanoid robot
$9618 (-0,02 %)
JD.com (JD, CN) - E-commerce & automated logistics
🛠️ Shovel manufacturer for humanoid robots
🔹 Hardtech (physical "shovels")
These companies provide the material basis: manufacturing machines, raw materials, semiconductor base.
Semiconductor Equipment & Manufacturing
$ASML (-0,02 %)
ASML (ASML, NL) - EUV lithography (monopoly).
$AMAT (+1,63 %)
Applied Materials (AMAT, USA) - Wafer equipment.
$8035 (+0,69 %)
Tokyo Electron (8035.T, JP) - Process equipment.
Test systems (hardware-side)
$6857 (+2,14 %)
Advantest (6857.T, JP) - Semiconductor test.
$TER (-0,28 %)
Teradyne (TER, USA) - Test systems + industrial robots.
Materials & raw materials
$ALB (+8,64 %)
Albemarle (ALB, USA) - Lithium (batteries).
$LYC (+0,33 %)
Lynas Rare Earths (LYC.AX, AUS) - Rare earths for magnets.
$UMICY (-1,44 %)
Umicore (UMI.BR, BE) - Cathode materials, recycling.
🔹 Soft/infra (digital "shovels")
These companies supply the infrastructure & toolswithout which development, training and operation would be impossible.
Design Software & IP
$SNPS (+2,1 %)
Synopsys (SNPS, USA) - EDA software.
$CDNS (+2,6 %)
Cadence Design Systems (CDNS, USA) - Chip design & simulation.
$ARM (+1,87 %)
ARM Holdings (ARM, UK/USA) - CPU architectures (license model).
Test & Measurement (software/signal level)
$KEYS (+1,6 %)
Keysight Technologies (KEYS, USA) - Electronics & RF test systems.
Network & data center backbone
$ANET (-0,02 %)
Arista Networks (ANET, USA) - High-speed networks.
$CSCO (+0,2 %)
Cisco Systems (CSCO, USA) - Data center/edge networks.
$EQIX (+0,56 %)
Equinix (EQIX, USA) - Data centers (colocation).
Cloud infrastructure
$AMZN (+1,56 %)
Amazon (AMZN, USA) - AWS (cloud, AI training).
$MSFT (+0,63 %)
Microsoft (MSFT, USA) - Azure.
$GOOG (+1,83 %)
Alphabet (GOOGL, USA) - Google Cloud.
Takeaway: Investing in the infrastructure stack allows you to participate in the robotics trend regardless of the subsequent product winner and reduces the individual product risk, but you have to live with cycles. In your opinion, which stage of the chain offers the best risk/return combination and fits into a disciplined portfolio?
Source: Own analysis based on publicly available company information and IR materials of the companies mentioned.
Image material: Techa Tungateja/iStockphoto
4848
34 Comentarios
•
55
•2Lun·
Black Swan: The day AI paralyzes the stock markets
AI-driven flash crash
An AI flash crash occurs when modern trading algorithms trigger massive waves of selling in a matter of seconds.
These systems are usually programmed to react to price changes or data signals, such as stop loss limits or short-term price drops.
If a share reaches a critical price, programmed algorithms automatically trigger sales.
These orders drive the price down further, causing other algorithms with similar mechanisms to also sell ("sell side momentum").
This so-called cascade effect can cause the price to plummet within minutes.
(Example: Cascade effect of critical infrastructure during heavy rainfall)
The trading speed of AI models today is so high that the smallest triggers (e.g. false signals) can result in a storm of trades in a flash.
Experts warn that many AI models are based on similar data, which can lead to "swarm thinking":
If several systems misinterpret the same signals at the same time, a small price slide can very quickly turn into a huge sell-off.
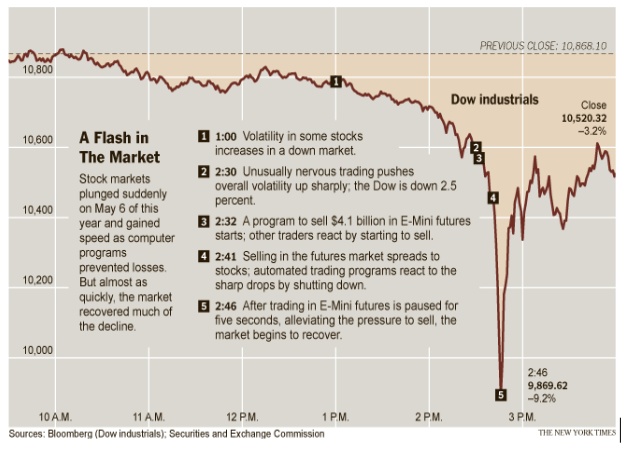
(Example: The flash crash of 6 May 2010 began with a large sell-off program being triggered for S&P 500 futures).
(https://www.advisorperspectives.com)
Although the markets recovered by the close of trading, this example shows how domino effects can be caused by automated orders.
AI can also have its own say:
Modern systems read news and social media in real time and react independently.
Bots can also incorporate completely new information (tweets or news) and generate buy or sell signals from this.
Incorrectly generated or misinterpreted messages can therefore immediately lead to sales.
1.
Possible triggers
Data error or manipulation:
Incorrect market data (prices, volumes) or cyber attacks on data can trigger false signals.
Algorithms that react blindly to data could falsely trigger sales or purchases.
The term:
"Simulation Deception"
(https://www.tencentcloud.com/techpedia/118834)
describes artificial patterns in the market that are created by manipulated data.
For example, an attacker could use fake buy/sell orders (spoofing) to artificially simulate liquidity, whereupon AI systems panic and trade in the opposite direction.
Fake news and deepfakes:
Artificial intelligence now allows deceptively real false reports (deepfake video, fake tweets, etc.).
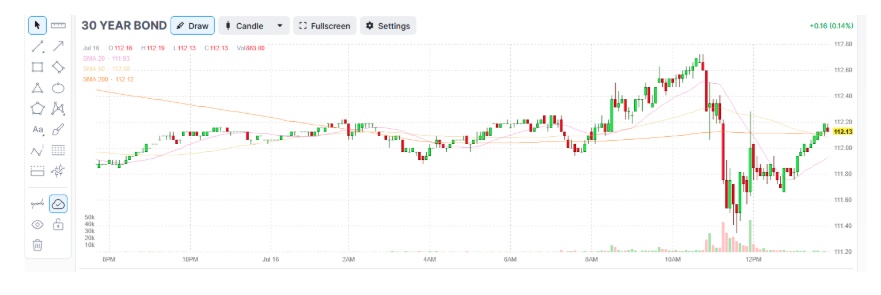
(Example: on July 16, 2025, Congress member Anna Paulina Luna from Florida wrote on X (Twitter) that she had heard from President Trump that Fed chief Powell would be fired immediately).
(https://www.advisorperspectives.com)
(https://www.advisorperspectives.com)
AI searched all social media posts specifically for tradable news. It found what it was looking for and a violent reaction in the bond and stock markets followed, as shown above.
In previous cases, the impact might have been weaker, as the president could have reacted more quickly and dismissed the statements before many market participants were even aware of the rumor.
Even little-known posts can lead to strong market movements within minutes thanks to AI attention.
World Economic Forum analyses explicitly warn:
Machine-generated fake news can act like a flash crash trigger.
More and more bots are able to spread such false information in order to deceive trading algorithms.
AI misinterpretation:
Even if the data is correct, AI models can misinterpret it.
Trading algorithms that process complex data (news, technical indicators) run the risk of interpreting irrelevant noise as a signal.
Lawfare cites as an example that AI-supported systems already "misread" the market in 2010 and 2016. "misread" the market and launched unfounded waves of selling.
"A few algorithms in use simply misread
the market. The unwarranted sell-off initiated by those mistaken models then caused other programs to respond in kind. The $1 trillion lost in that half hour period was eventually made up thanks to human intervention. "
In the future, such misinterpretations will be even more critical as AI models analyze huge amounts of data from social media and news.
Panic signals/cascades:
In a battered market, automated risk offs (stop sales after a fixed loss limit) can trigger a race.
If, for example, a key figure ($VIXindex level) reaches a critical value, many systems switch to safety at the same time - which can cause a variety of similar assets to fall as an artificial panic impulse.
2.
Affected asset classes
An AI Flash Crash affects various asset classes:
Equities:
This is often the first impetus of a crash.
Globally listed stocks (indices such as S&P 500, DAX, Nikkei) see massive price losses in a matter of seconds.
A shutdown of a large position, for example, can cause other algorithms to panic sell.
Historically, the stock market has experienced such sell-off waves several times.
2010 Dow $DJIA
2014 US bonds
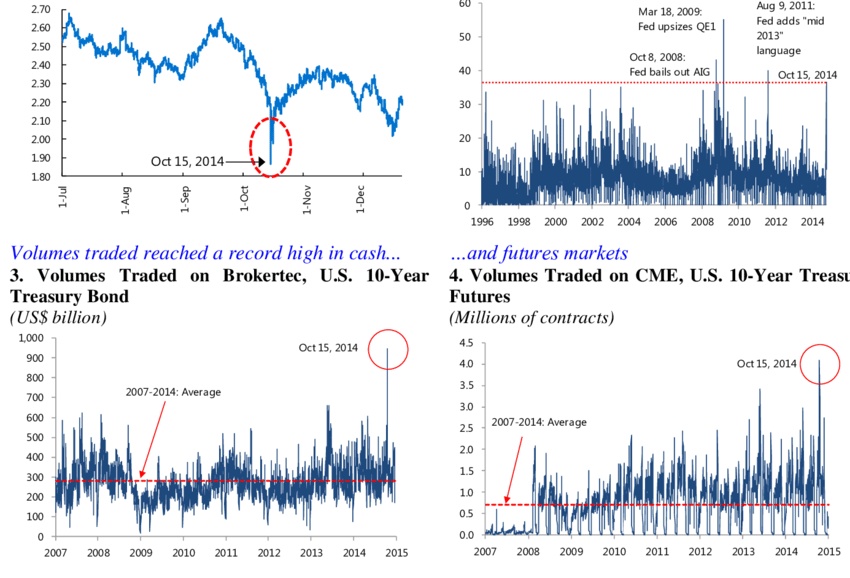
An AI-supported flash crash would accelerate this mechanism even further. A sharp slump is usually followed by a partial recovery within a few days or weeks.
Bonds:
Bond markets can also "flash".
In the famous Treasury Flash Crash of 2014, the yield on the US 10-year Treasury Yield plummeted by 1.6% in twelve minutes, followed by a recovery - triggered by algorithmic sell orders at record levels.
(https://www.researchgate.net)
(Theoretically, AI can act against this:
In a stock panic, investors often flee into bonds (price rises, yield falls).
But AI-controlled bond funds could simultaneously and automatically reach certain thresholds and trigger the sale of bonds or bond futures.
This could lead to sharp interest rate swings in the short term, even if the fundamentals do not justify this).
Commodities:
When uncertainty is high, commodity prices often tip.
Typically, oil ($IOIL00 (+0,01 %) ), gas ($NGS ) and industrial metal prices ($COPA (+1,56 %) , $ALUM (-0,19 %) , $ZINC (+0,28 %) ) in a crash phase due to expected weaker demand.
AI programs on the commodities market (e.g. in oil or gold futures trading) could intensify this crash or even trigger a "mini flash crash" in individual commodities.
(Example: the slump in silver futures in July 2017:
Price plunge of over 11% during Asia close when thin trading was blamed on algorithm shifts).
AI in commodity markets can therefore both trigger selling spikes and initiate a rapid countermovement through post-buy programs.
Cryptocurrencies:
These are considered particularly volatile.
AI trading bots are everywhere, so cryptocurrencies are in free fall when many bots recognize "fear" signals at the same time.
(Example: In May 2021 $BTC (+0,44 %)
plummeted by around 30% within hours, partly because many algorithms sold en masse after signals about China's Bitcoin ban).
$ETH (-0,02 %) experienced a flash crash on one platform in 2017 because a huge sell order triggered many automated trades.
Crypto markets run 24/7, are unregulated and therefore more susceptible to algorithmic chain reactions.
3.
Risk matrix by region
The probability of occurrence and the extent of damage caused by a crash differ from region to region:
USA:
- Very high trading volume and dominant use of AI algorithms in New York and Chicago.
- Large index futures can act as initiators.
- Probability of a crash is considered moderate to high as there is a lot of automated trading here.
- Damage would be extremely highas the US markets are of global systemic importance.
- Trading halts mitigate the impact on the trading day, but the crash effect on global investor sentiment would be enormous.
Europe:
- Heavy reliance on passive funds and ETFs (e.g. from $BLK (+0,33 %) iShares).
- Algorithms are widespread, but somewhat less so than in the USA.
- Probability rather mediumdamage high.
- ETF crashes show that sudden panic can also lead to chain reactions in equities.
- European banking crisis could arise if credit markets are burdened by US shocks.
Asia:
- Regulation and trading times differ.
- Flash crashes can have a rapid impact on Asia (Nikkei, SSE), especially if they start at night when trading is thin.
Medium probability and medium damage - because Asian markets close faster and usually react later.- Crashes in Asia could affect yen or euro performance, for example.
Crypto:
- Market open around the clock, little regulation, high leverage.
- The probability of a major crash in crypto is very highas price falls are more frequent and driven by AI bots.
- Damage is often limited to crypto investors, but can also affect traditional markets via linked financial assets (Bitcoin ETFs, leveraged crypto products).
The matrix overview could therefore show
- Short term (minutes to days):
A sudden flash crash would last seconds to minutes.
Prices plummet, many stop loss orders are triggered.
Stock exchanges switch on automatic trading pauses to stop algorithm spirals.
Investors lose billions in a very short space of time, many markets are temporarily illiquid.
Confidence collapses, many investors panic and are uninformed.
- Medium-term (weeks to months):
Markets should stabilize again in the following days to weeks as counter-cyclical AI and manual orders intervene.
In the medium term, economic data could be affected if a crash impacts financing conditions.
Media and public will question confidence in digital markets for months.
Investors report consequences such as increased demand for safe assets (gold, government bonds).
- Long term (years):
Regulation and market mechanisms would adapt.
We could expect a regulatory boost:
- Stricter rules for AI in trading
- Transparency obligations for algorithm models
- Supervision of financial AI by regulators (SEC, BaFin, ESMA etc.).
Already in the past, the 2010 flash crash led to new trading interruptions and considerations regarding trading system requirements.
An AI crash would likely have a disciplining effect:
Providers need to develop more robust AI models, and contingency plans (kill switches) could become mandatory.
In the long term, confidence could be slow to recover:
Institutional investors would only have limited confidence in AI systems, and many private investors might temporarily hold back or prefer alternative strategies.
4.
Specific players and technologies
BlackRock Aladdin:
BlackRock's Aladdin AI system currently manages more than 30,000 portfolios and permanently rebalances enormous amounts of capital.
If Aladdin is routinely programmed to sell too much for ETFs or funds, this can trigger billions of orders.
Nvidia & AI chips:
$NVDA (+2,31 %) Supplies the hardware for many AI models and is itself a market star.
High expectations for AI have fueled Nvidia's share price for years.
Algorithms are strongly fixated on such shares.
If, for example, Nvidia's share price falls abruptly, many strategies trigger sell programs.
Such a domino effect
$NVDA (+2,31 %) -> $SEMI (+1,65 %) -> $CSNDX (+0,82 %)
could fuel a crash.
In practice, it has been shown that Nvidia reacts very volatile to macroeconomic and geopolitical news, so the next AI turbulence could drag down the entire tech sector.
AI bots on Binance (Crypto):
On crypto exchanges like Binance, many users trade with automated bots.
A large part of the crypto trading volume comes from AI-supported systems.
These bots can generate simultaneous sell or buy waves.
AI-driven ETF rebalancing:
Large index ETFs and passive funds (BlackRock iShares, Vanguard etc.) use automated systems to implement index changes.
If indices rise or fall quickly, many ETFs start rebalancing at the same time.
If the AI signal is negative, all AI-based funds could sell at the same time.
This creates massive sell orders in a short space of time.
Because the volumes involved are in the billions, rebalancing alone can drive a crash further.
Other players:
News agencies, index operators (eg. $MSCI (+0,6 %) ), hedge funds with AI strategies and social trading platforms also contribute.
Any sudden outage (e.g. power failure at NYSE) or hacker attack on stock exchange systems could further irritate the AI systems on the stock market.
"When algorithms collide and markets tremble in fractions of a second, the new power of AI is revealed: speed without mercy, precision without emotion. One spark is enough - and the domino effect races through indices, derivatives and crypto-spheres. The AI-driven flash crash is no longer a distant shadow, but the echo of a future in which machines set the pace of the financial world."
Feel free to write your feedback on this post in the comments and tell me if you're interested in something like this.
My plan this morning was actually just to write a short post about this topic, but it turned out to be a bit longer. It's so easy to sit and write all day.
@Kundenservice Please increase the maximum number of pictures for a post, unfortunately I didn't get all the pictures in that I had picked out.
Sources:
- https://www.ig.com/en/trading-strategies/flash-crashes-explained-190503#:~:text=speeds%20based%20on%20pre,as%20the%20prices%20go%20down
- https://www.advisorperspectives.com/articles/2025/07/28/ai-transforming-markets#:~:text=I%20started%20this%20article%20by,a%20flash%20crash%20or%20surge
- https://www.lawfaremedia.org/article/selling-spirals--avoiding-an-ai-flash-crash#:~:text=an%20otherwise%20normal%20trading%20day,up%20thanks%20to%20human%20intervention
- https://www.ig.com/en/trading-strategies/flash-crashes-explained-190503#:~:text=2010%20flash%20crash%3A%20Dow%20Jones
- https://www.advisorperspectives.com/articles/2025/07/28/ai-transforming-markets#:~:text=For%20example%2C%20on%20July%2016%2C,last%20week%20was%20lightning%20fast
- https://www.binance.com/en/square/post/22230680857314
- https://www.tencentcloud.com/techpedia/118834
- https://www.weforum.org/stories/2023/04/technology-vulnerabilities-financial-system/#:~:text=However%2C%20IoT%20botnets%2C%20which%20tamper,grid%20and%20influence%20market%20prices
- https://www.lawfaremedia.org/article/selling-spirals--avoiding-an-ai-flash-crash#:~:text=But%20this%20was%20not%20a,speed%20selling%20spirals.”
- https://corporatefinanceinstitute.com/resources/career-map/sell-side/capital-markets/flash-crashes/#:~:text=Using%20algorithms%20to%20trade%20has,plunge%20in%20the%20market%20occurs
- https://www.ig.com/en/trading-strategies/flash-crashes-explained-190503#:~:text=The%20flash%20crash%20of%20the,impact%20these%20events%20can%20have
- https://www.tastyfx.com/news/flash-crashes-explained-190503/#:~:text=The%20DJIA%20suffered%20yet%20another,NYSE
- https://www.occ.gov/news-issuances/speeches/2024/pub-speech-2024-61.pdf#:~:text=flash%20crashes%2C%20which%20have%20been,4
- https://www.zerodaylaw.com/blog/ai-compliance-safeguarding-financial-markets#:~:text=The%20reliance%20on%20AI%20for,reaching%20consequences
- https://www.nasdaq.com
- https://medium.com
- https://corporatefinanceinstitute.com
- https://www.tastyfx.com
- https://www.binance.com/en
- https://www.lawfaremedia.org
- https://www.weforum.org
- https://www.ig.com/de
- https://www.tencentcloud.com
- https://www.occ.gov
- https://www.ssrn.com/index.cfm/en
- https://www.advisorperspectives.com
- https://www.zerodaylaw.com
- https://www.curiousmonky.com

+ 6
7373
19 Comentarios
2Lun
Exciting topic, thoroughly researched! Thank you for this valuable content! 🙏
Incidentally, the most famous algo crash was on October 19, 1987, when the Dow Jones fell by 22% within hours. That caused a few suicides! 🥶
Incidentally, the most famous algo crash was on October 19, 1987, when the Dow Jones fell by 22% within hours. That caused a few suicides! 🥶
•
88
•
2Lun·
So it happend…
I have been a Starbucks investor for almost three years. I’ve loved the growth, and especially the dividend growth (5-year CAGR of 8.58%). As many know, Starbucks is currently in a rebuild stage, and like many other investors, I’m concerned about the current dividend payout ratio of 120.88%. With a number this high, there’s a possibility of no upcoming dividend hike — and, in the worst case, a dividend cut.
I hope I’m wrong, but for now, I’m out. Instead, I’ve opened a position in $MSCI (+0,6 %)
What do you guys think about $SBUX (+0,83 %) ?

77
2 Comentarios
I agree on that, just waiting for a good moment to sell.
•
11
•2Lun·
Msci purchase
I bought more during the setback.
It is now my third-largest position and I am convinced of this company.
Thought I'd post something about another share in view of the whole Novo Nordisk and to some extent UnitedHealth drama.
What is your watchlist at the moment?
99
11 Comentarios
Good buy! I have Copart on the WL
•
33
•Valores en tendencia
Principales creadores de la semana
<contenedor>Datos LSX</contenedor> · Datos financieros de FactSet