Second tranche added $DECK (-4,39 %) .
Top value. Let's see what effect the tariffs will have in the medium term.
Puestos
13Second tranche added $DECK (-4,39 %) .
Top value. Let's see what effect the tariffs will have in the medium term.

🔹 Net Sales: $964.5 M (Est. $900.31 M) 🟢; UP +16.9% YoY
🔹 EPS: $0.93 (Est. $0.68) 🟢; UP +24% YoY
🔹 Net Income: $139.2 M; —
🔹 Gross Profit: $537.9 M; Gross Margin: 55.8% (vs. 56.9% YoY)
Q2’26 Guidance
🔹 Net Sales: $1.38 B – $1.42 B (Est. $1.51 B) 😐
🔹 EPS: $1.50 – $1.55 (Est. $1.40) 🟢
Q1 Segment / Brand Results
🔹 HOKA® Net Sales: $653.1 M; UP +19.8% YoY
🔹 UGG® Net Sales: $265.1 M; UP +18.9% YoY
🔹 Other Brands Net Sales: $46.3 M; DOWN –19.0% YoY
Channel Performance
🔹 Wholesale Net Sales: $652.4 M; UP +26.7% YoY
🔹 DTC Net Sales: $312.2 M; UP +0.5% YoY (Comp. Sales DOWN –2.2% YoY)
Geographic Performance
🔹 Domestic Net Sales: $501.3 M; DOWN –2.8% YoY
🔹 International Net Sales: $463.3 M; UP +49.7% YoY
Other Metrics
🔹 Operating Income: $165.3 M; UP +24.5% YoY
🔹 Pre‑Tax Profit: $183.1 M
🔹 SG&A Expenses: $372.6 M; UP +10.5% YoY
CEO Commentary
🔸 “HOKA and UGG outperformed our first quarter expectations, with robust growth delivering solid results to begin fiscal year 2026.”
🔸 “Though uncertainty remains elevated in the global trade environment, our confidence in our brands has not changed, and the long‑term opportunities ahead are significant. We will lean on the fundamental strengths of our powerful operating model as we continue executing our strategy.”

The position in $DECK (-4,39 %) is now full
👇👇👇👇
DECK Raymond James analyst Rick Patel lowered the price target on Deckers Outdoor from $140 to $123 and maintains a Strong Buy rating on the stock. Deckers' Q1 results are expected to be similar to its "lackluster" Q4 results, but the underlying strengths of HOKA and UGG remain intact, the analyst said in a research note. The firm expects HOKA to pick up momentum from Q2, which should drive estimates higher and improve visibility.
Deckers Brands share: Chart from 23.05.2025, price: USD 126.09 - symbol: DECK | source: TWS
If the share price falls below USD 108 in regular trading, a renewed setback towards USD 100 or USD 94 must be expected.
Below this level there would be a Verkaufssignalwith possible price targets at USD 82 and USD 75.
If, on the other hand, the share price returns above USD 108, the situation will ease immediately.
Deckers goes on the offensive
However, earnings of only USD 0.62 - 0.67 per share are forecast for the first quarter, disappointing expectations of USD 0.79 per share.
Deckers therefore assumes that the waters will become rougher for the time being.
But instead of going on the defensive, the company is going on the offensive and buying back its own shares on a large scale. Aktien back.
In the last 12 months, 3.80 million treasury shares have been retired, 1.8 million of them in the final quarter - i.e. in the period from January to the end of March. In the first weeks of the current quarter, a further 765,000 treasury shares were purchased.
In total, this corresponds to around 3% of the outstanding shares, but this is not the end of the story.
Yesterday, Deckers decided on further buybacks with a volume of USD 2.25 billion. This would currently be enough to cancel almost one in seven shares.
Furthermore, the balance sheet is squeaky clean. The company has no debt and USD 1.89 billion in cash. Deckers should therefore be well equipped for a possible crisis.
The only question that remains is how long and how deep the crisis will be. Perhaps the time is not yet right to make a large-scale investment in Deckers.
However, it seems to be mainly a question of timing.
🔹 Revenue: $1.02B (Est. $1.006B) 🟢; +6.5% YoY
🔹 Adj EPS: $1.00 (Est. $0.59) 🟢
🔹 OI: $173.9M (Est. $107.1M) 🟢
🔹 Net Income: $151.4M (Est. $89.5M) 🟢
FY Outlook Withdrawn:
🔸 Deckers withdrew full-year FY26 guidance due to macroeconomic uncertainty and evolving global trade policies.
Q1 Guidance:
🔹 Revenue: $890M–$910M (Est. $925.3M) 🔴
🔹 EPS: $0.62–$0.67 (Est. $0.79) 🔴
Segment Revenue (Q4 YoY):
🔹 HOKA®: $586.1M; +10.0% YoY
🔹 UGG®: $374.3M; +3.6% YoY
🔹 Other Brands: $61.3M; -6.3% YoY
Channel Performance (Q4 YoY):
🔹 Wholesale: $611.6M; +12.3% YoY
🔹 DTC: $410.2M; -1.2% YoY
↳ DTC Comparable Sales: -1.6% YoY
Geographic Performance (Q4 YoY):
🔹 Domestic Sales: $647.7M; Flat YoY
🔹 International Sales: $374.1M; +19.9% YoY
💰 Capital Allocation:
🔹 Q4 Buyback: 1.78M shares for $266M
🔹 FY25 Buyback: 3.8M shares for $567M
🔹 FY26 Q1 Buyback (as of May 9): 765K shares for $84M
🔹 Total Buyback Authorization Increased to $2.5B
CEO Stefano Caroti:
🔸 “Despite global trade uncertainty, HOKA and UGG remain strong category leaders with long-term growth potential.”
CFO Steve Fasching:
🔸 “FY25 marks our 5th consecutive year of double-digit growth in revenue and EPS. With $1.9B in cash, strong cash flow, and a $2.5B buyback authorization, we’re well-positioned for strategic investment and shareholder return.”
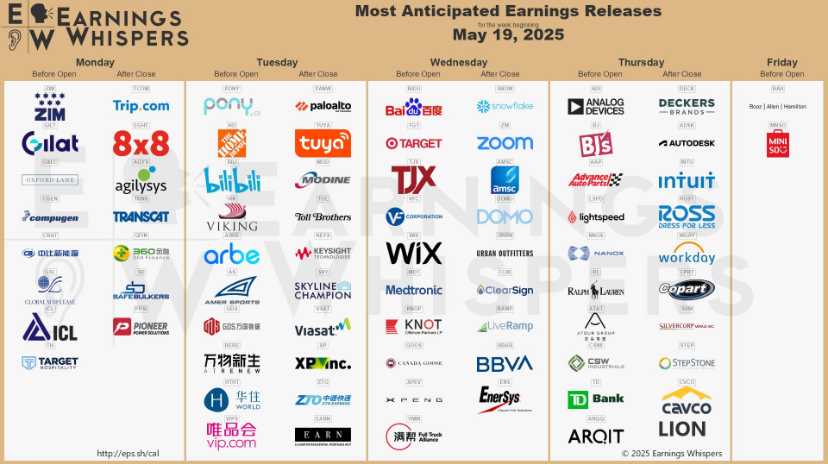
Numerous exciting quarterly figures are due this week. Particularly in focus: Palo Alto Networks ($PANW (-4,92 %)), Snowflake ($SNOW (-4,44 %)), Target ($TGT (-4,66 %)), Intuit ($INTU (-2 %)), Workday ($WDAY (-3,86 %)), Deckers Outdoor ($DECK (-4,39 %)) and BJ's Wholesale ($BJ (+0,65 %)).
⸻
📅 Monday (19.05.)
- Trip.com ($TCOM)
- ZIM Integrated Shipping ($ZIM)
- 8x8 ($EGHT)
- Gilat Satellite ($GILT)
- Agilysys ($AGYS)
- Compugen ($CGEN)
- Transcat ($TRNS)
📅 Tuesday (20.05.)
- Palo Alto Networks ($PANW)
- Bilibili ($BILI)
- Tuya ($TUYA)
- Modine ($MOD)
- Toll Brothers ($TOL)
- Viking Holdings ($VIK)
- Amer Sports ($AS)
- Arbe Robotics ($ARBE)
- XPeng ($XPEV)
- Full Truck Alliance ($YMM)
- XP Inc ($XP)
📅 Wednesday (21.05.)
- Target ($TGT)
- TJX Companies ($TJX)
- Baidu ($BIDU)
- Medtronic ($MDT)
- Wix.com ($WIX)
- Urban Outfitters ($URBN)
- Domo ($DOMO)
- American Superconductor ($AMSC)
- Qifu Technology ($QFIN)
📅 Thursday (22.05.)
- Analog Devices ($ADI)
- BJ's Wholesale ($BJ)
- Deckers Outdoor ($DECK)
- Autodesk ($ADSK)
- Intuit ($INTU)
- Workday ($WDAY)
- Ross Stores ($ROST)
- Advance Auto Parts ($AAP)
- Lightspeed Commerce ($LSPD)
- TD Bank ($TD)
- Keysight Technologies ($KEYS)
📅 Friday (23.05.)
- Booz Allen Hamilton ($BAH)
🔗 Full overview: earningswhispers.com/calendar
In the S&P 500, 224 out of 500 shares are in the red this year. "Welt" has analyzed which stocks have the potential to catch up.
The criteria:
The stocks must have lost at least 20 percent in price since the beginning of the year, have at least double-digit price potential according to analysts' estimates and also be recommended as a buy by at least 50 percent of augurs.
The candidates (selection):
$UNH (-5,78 %) - United Health
$DECK (-4,39 %) - Deckers Outdoor
$UPS (-3,46 %) - UPS
$HAL (-7,26 %) - Halliburton
$MRK (-1,61 %) - Merck
$NCLH (-4,12 %) - Norwegian Cruise Line
$IQV (-2,83 %) - IQVIA Holdings
Source: Welt, 14.05.25 (excerpt) | Image: ChatGPT


Sales of selected competitors of Nike $NKE (-4,98 %) :
Nike(USA): $49.0 billion, -8% in the last quarter compared to the previous year, $NKE (-4,98 %)
Adidas*(Germany): $24.6 billion, +7%, $ADS (-2,82 %)
Lululemon**(USA): $10.2 billion, +9%, $LULU (-4,88 %)
VF Corporation**(USA): $9.9 billion, +2%, $VFC (-6,23 %)
Anta Sports*(China): $9.7 billion, +14%, $2020 (-5,64 %)
Puma*(Germany): $9.3 billion, +0%, $PUM (-4,9 %)
Skechers**(USA): $8.7 billion, +13%, $SKX
New Balance*(USA): $7.8 bn, unlisted
Under Armour*(USA): $5.4 billion, -6%, $UAA (-1,68 %)
Deckers Brands**(USA): $4.6 billion, +17%, $DECK (-4,39 %)
ASICS*(Japan): $4.1 billion , +16%, $7936 (-3,34 %)
Li Ning*(China): $3.9 bn, +2%, $2331 (-1,74 %)
On Holding**(Switzerland): $2.5 billion, +32%, $ONON (-3,87 %)
Despite all its problems, Nike is still twice as big as Adidas and somewhat as big as its four main competitors (Adidas, Anta Sports, Puma, New Balance) combined. together.
The Nike share is currently in a 60% drawdown (the worst in 25 years) and is roughly at the level of the COVID-19 low in March 2020.
Attractive risk-reward ratio?
Is Nike a buy, hold or sell for you?
*Main competitor
**Competitor in certain segments

🔹 Revenue: $1.83B (Est. $1.72B) 🟢; UP +17.1% YoY
🔹 EPS: $3.00 (Est. $2.51) 🟢; UP +19% YoY
🔹 Gross Margin: 60.3% (Est. 56.37%) 🟢
🔹 Operating Income: $567.3M (Est. $480.23M) 🟢
FY25 Guidance:
🔹 EPS: $5.75 - $5.80 (Prev: $5.50 - $5.65) 🟢
🔹 Revenue Growth: ~15% YoY, raising forecast to $4.9B
🔹 Gross Margin: ~57% (or slightly higher)
🔹 Operating Margin: ~22%
Segment Performance:
🔹 UGG Brand Revenue: $1.24B (Est. $1.14B) 🟢; UP +16.1% YoY
🔹 HOKA Brand Revenue: $530.9M (Est. $520.41M) 🟢; UP +23.7% YoY
🔹 Teva Brand Revenue: $24.1M (Est. $25.05M) 🔴; DOWN -6% YoY
🔹 Other Brands Revenue: $28.0M (Est. $30.03M) 🔴; DOWN -16.6% YoY
Geographic Performance:
🔹 Domestic Revenue: $1.17B; UP +11.5% YoY
🔹 International Revenue: $657.9M; UP +28.5% YoY
Cash Flow & Financial Position:
🔹 Cash & Cash Equivalents: $2.24B (UP from $1.65B YoY)
🔹 Inventories: $576.7M (UP from $539.0M YoY)
🔹 No outstanding borrowings
🔹 Stock Buyback: Repurchased 275K shares for $44.7M at an avg. price of $162.85/share
CEO & Leadership Commentary:
🔸 CEO Stefano Caroti: "Deckers delivered exceptional Q3 results, setting new records for revenue, gross margin, and earnings. UGG’s global momentum and HOKA’s continued growth reflect strong consumer demand. Our increased full-year outlook reflects our strategic execution, consistent mid-teens growth, and commitment to best-in-class margins."
Strategic & Business Highlights:
🔸 Strong growth in UGG and HOKA brands driving record revenue
🔸 Maintaining top-tier operating margin levels despite macroeconomic uncertainties
🔸 Continued focus on innovation in performance footwear & global brand expansion
🔸 Growing direct-to-consumer (DTC) business, which now represents over $1B in sales
Principales creadores de la semana


