Chart technology from the picture book IV
+ fairy tale
Starbucks
It's not just coffee. It's Starbucks.
---------------------------------------------------------------------------------------------------------
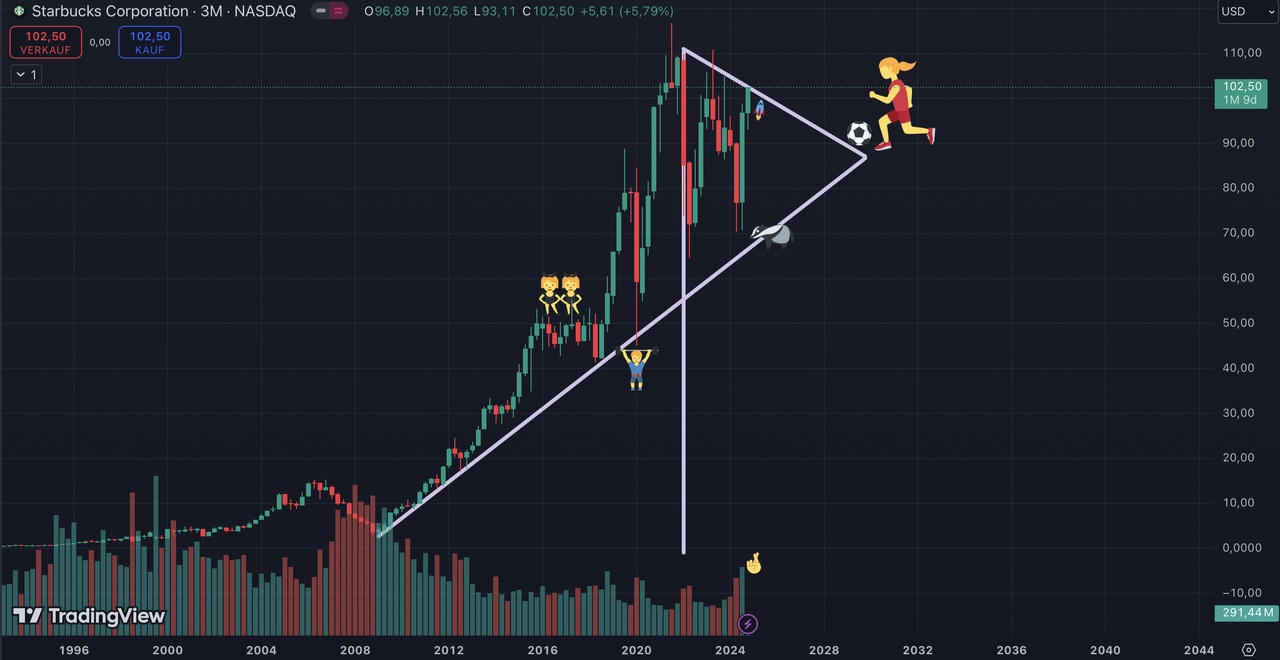
The technical chart of Starbucks shows mixed signals depending on the time perspective.
The short-term and medium-term indicators and oscillators are currently pointing to a buying trend. There was also a golden cross at the end of September 24, for example.
The support levels seem to be holding well.
Over the last 2 years or so, Starbucks has tended to move sideways with ups and downs. (Beta 0.90)
I have not researched the reasons, but I can think of a few points off the top of my head that could have been partly responsible for the poor performance.
- The raccoon year of 2022 🦡
- The exorbitant rise in the commodity price of coffee
- In my opinion, the poor management of Mr. Laxman, who has since been replaced by Mr. Niccol (ex $CMG (-0.08%) CEO) in the meantime 🥳.
---------------------------------------------------------------------------------------------------------
A look at the annual candles shows a bullish candle with a long shadow for 2024. This could be a bullish reversal signal. The CEO change was received very positively by the market and has also led to increased buying volume again.
---------------------------------------------------------------------------------------------------------
If you look at the chat with monthly candles, on the other hand, you can see a bullish flag in my opinion, but it could still turn bearish.
---------------------------------------------------------------------------------------------------------
Conclusion:
In my opinion, Starbucks is currently not an attractive investment in view of the market uncertainty that can be seen in the chart, the negative equity and the high level of debt. Starbucks could be more interesting for a trader. As always, just my opinion and a lot of gut feeling 🤓

