On the occasion of new record highs for many stocks, here is an article I published in Dec-24 - always good to remember this insight.
I hope you enjoy reading it.
---
Why you should hold winning companies for the long term
One of the biggest challenges in the stock market, apart from picking winning companies, is trying to time the market, i.e. finding the perfect moment to buy or sell a stock.
Looking back, it seems child's play: Buy at the low, sell at the high - and you've made a good profit. But the reality is trickier. No one can predict when these crucial moments of lows and highs will come and when the best trading days of the year will occur. Most investors who try this timing end up missing the best trading days. Über 20 Jahre sollen es lediglich 6% Prozent der professionellen Fondsmanager geschafft haben, den S&P 500, der die Aktien der 500 größten börsennotierten US-Unternehmen abbildet, zu schlagen.
Example
I recently came across an interesting analysis of the performance of Tesla shares on YouTube $TSLA (-1%) since the IPO. Hier you can find the video in full length (credits to Cern Basher and Herbert Ong).
A $100 investment in Tesla on the day of the IPO (June 29, 2010) would have grown to an impressive $27,386 today - assuming you had held the stock for the entire 14+ year period (3,643 trading days). But if you had held the 41 best trading days of the share over these 14 years, your investment would hardly have grown: 100 US dollars would have become just over 100 US dollars.
In other words: If you had bought Tesla shares $TSLA (-1%)
only on the 41 best trading days since the IPO, you would have achieved the same performance as an investor who had been invested on all possible 3,643 trading days.
I doubt that there is even one person in the world who can perfectly anticipate exactly these 41 days over a period of more than 14 years. My point is this: if you want to experience the sunniest days of the year in Mallorca, you have to spend the entire 365 days there because you don't know when it will be the sunniest. The same applies to investing in individual shares. You can only enjoy the best trading days if you stay invested for the long term.
Below in the chart you will find an overview of how the daily returns of the Tesla share $TSLA (-1%) over the 3,643 trading days since the IPO (see chart below).
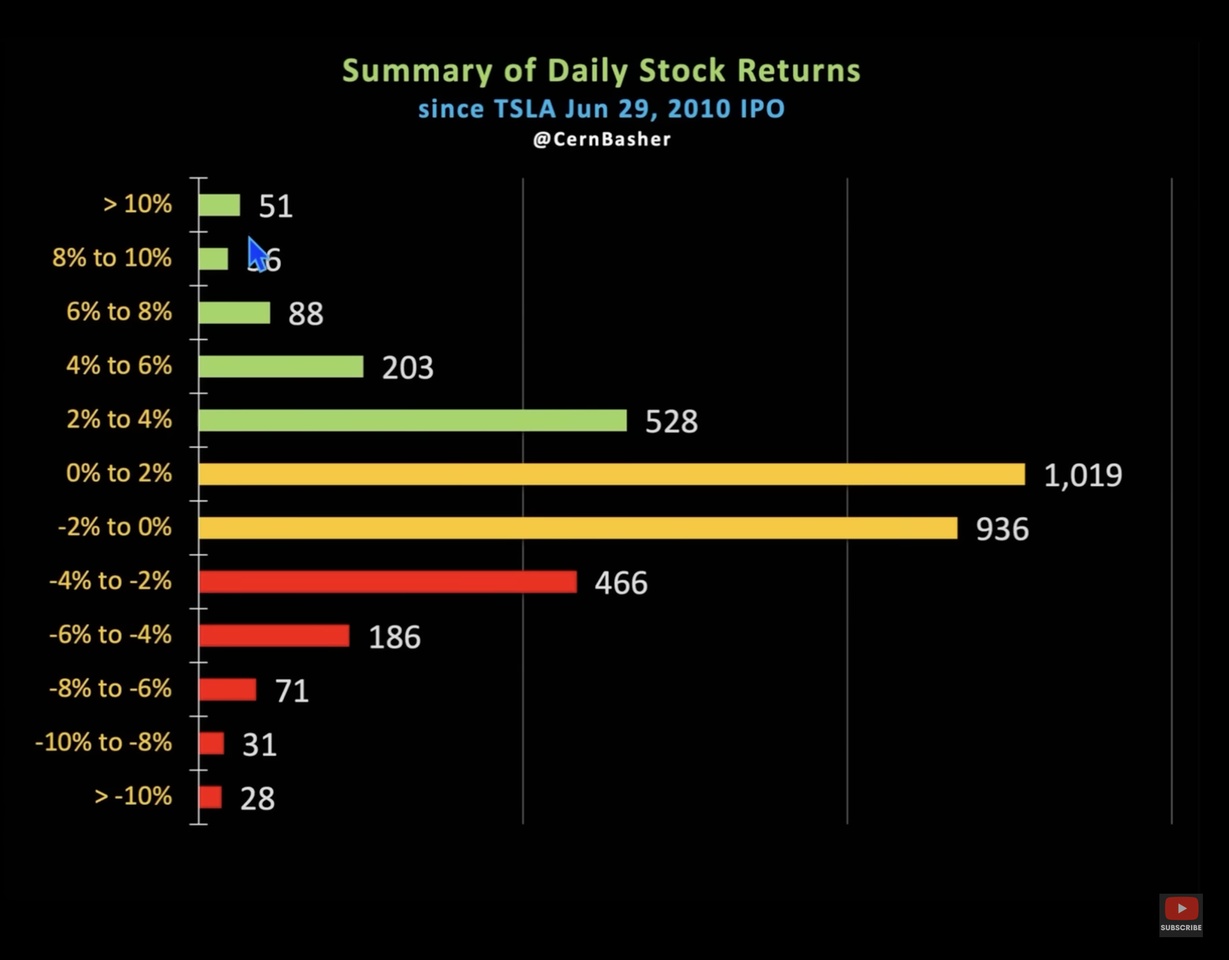
For example, there were 51 trading days on which the share was up by more than 10% and 28 days on which it was down by more than 10%. On 1,019 trading days, the share gained between 0% and 2%.
In general, it can be said that the Tesla share $TSLA (-1%) performed positively on 1,925 out of 3,643 trading days (i.e. 52.8% of the time), whereas the share performed negatively on 1,718 out of 3,643 trading days (i.e. 47.2% of the time). At first glance, this sounds like surprisingly few positive trading days. Nevertheless, this small majority is enough to turn 100 US dollars into over 27,000 US dollars in 14 years.
Incidentally, this close ratio between good and bad trading days is not a Tesla-specific peculiaritybut a general characteristic of winning shares. This can be seen, for example, in the following chart, which shows the trading days of Tesla $TSLA (-1%) , Nvidia $NVDA (-1.03%) and the S&P 500 $CSPX (-0.8%) since June 29, 2010:
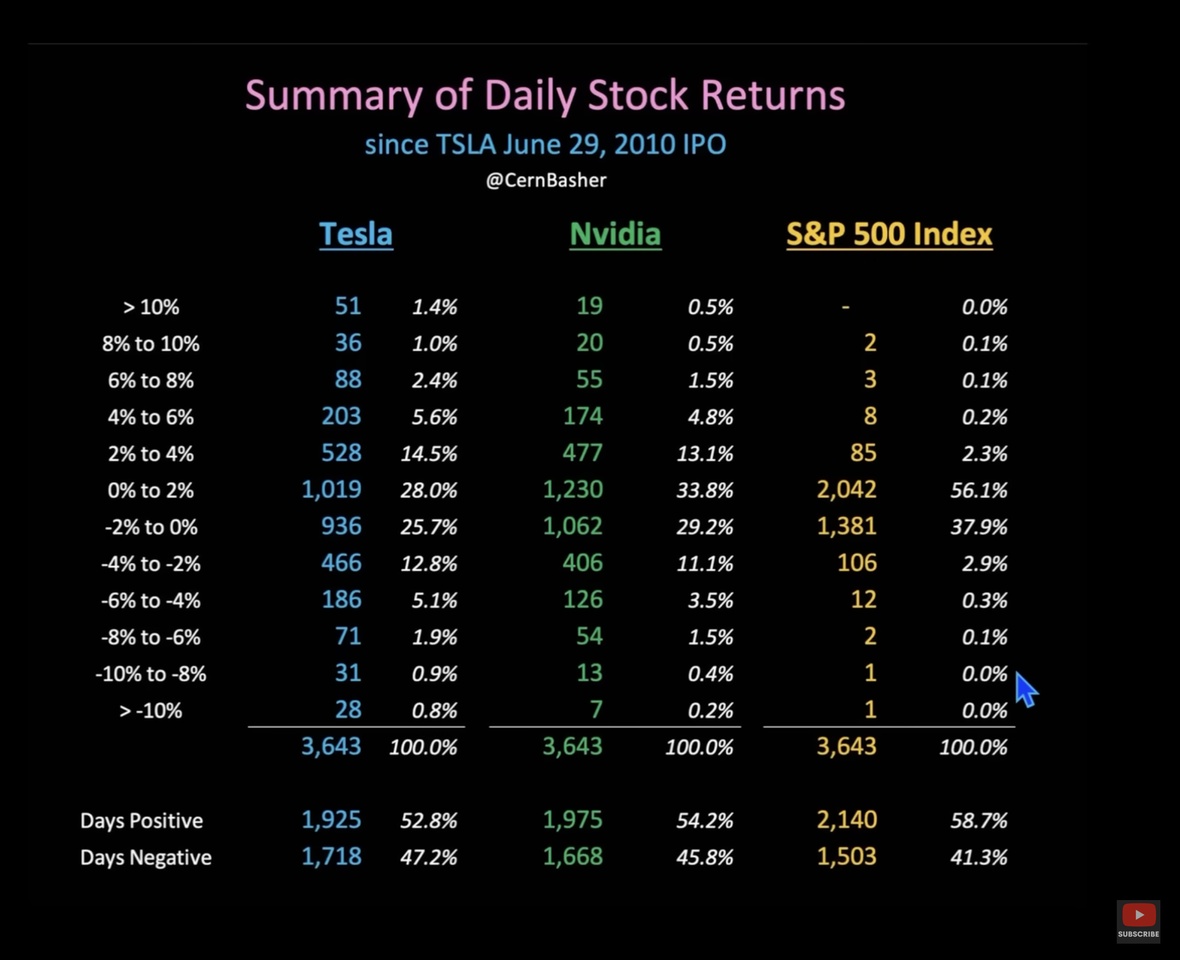
Nvidia $NVDA (-1.03%) - also one of the best stocks of recent years - the proportion of positive trading days is 54.2% and for the S&P 500 $CSPX (-0.8%) at 58.7%. So as a long-term investor in individual stocks and ETFs, you should get used to the fact that your investments will be in the red in the red every other day a profound realization in my opinion.
The key to success lies in patience and consistency: stay invested for the long term once you have identified a rare winning company. The best days on the market often come unexpectedly - only those who stay can experience them. The time you spend in the market is more important than trying to find the perfect entry and exit points. You should always remember that.
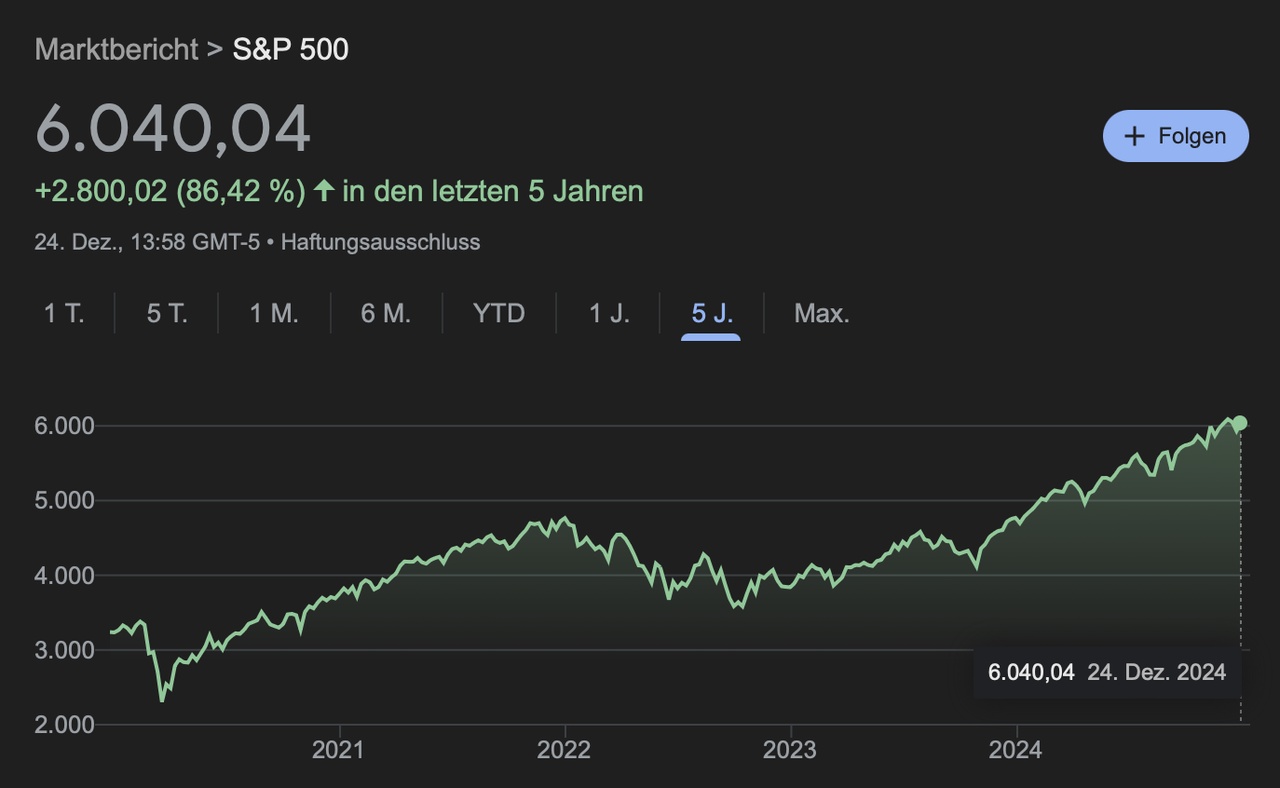
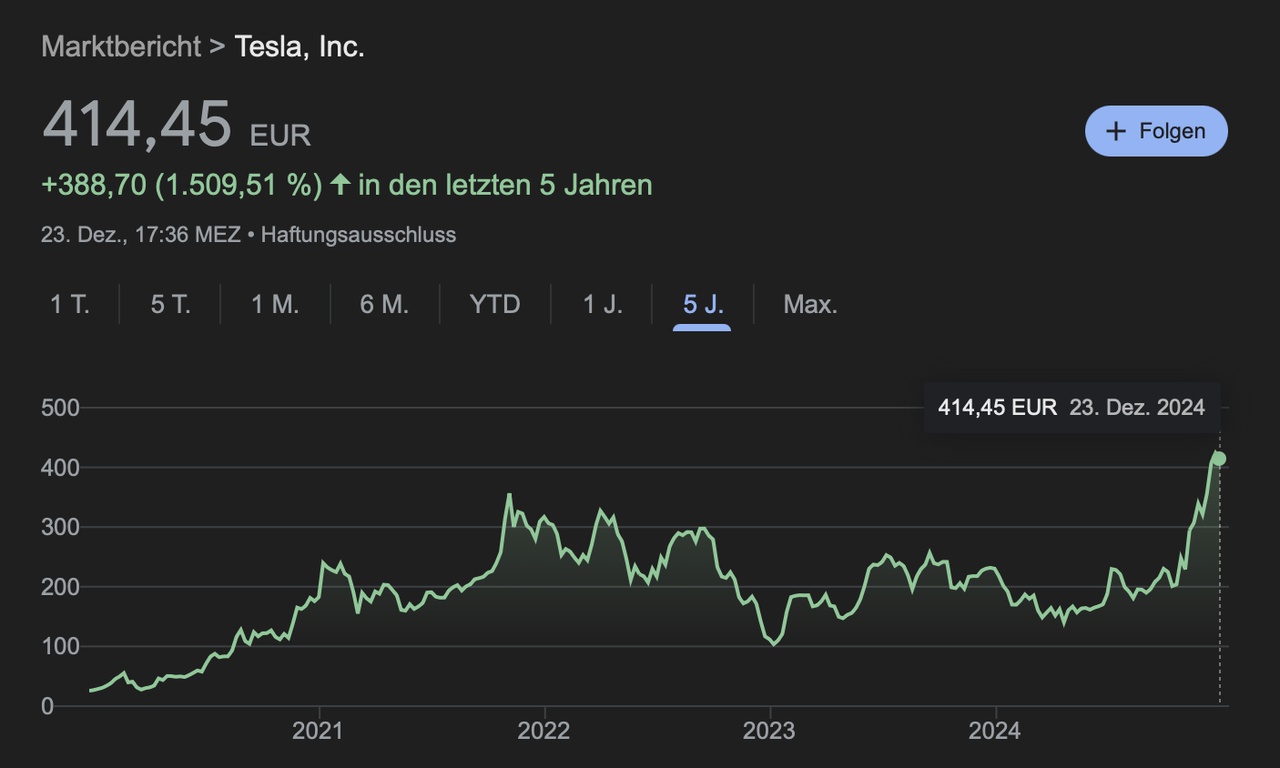
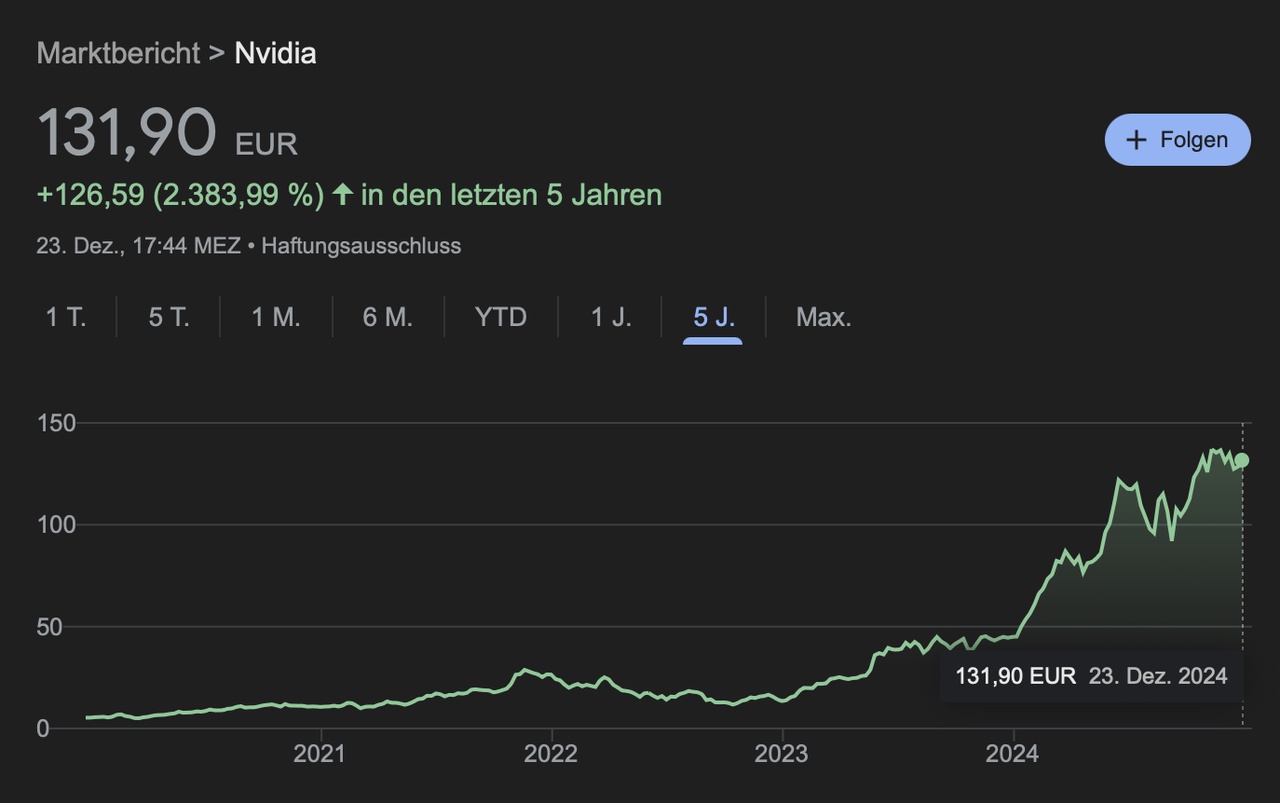
Finally, by way of illustration, the price trends of long-term winning stocks such as Tesla $TSLA (-1%) , Nvidia $NVDA (-1.03%) and the S&P 500 $CSPX (-0.8%) over the last 5 years:
Tesla: +1,510% (€10,000 became €161,000)
Tesla $TSLA (-1%) has taken the decisive step into the mass market for electric vehicles since 2020 with the Model Y and established itself as the only profitable Western mass manufacturer. After a three-year sideways movement since 2021, which was characterized by price cuts to stimulate the interest rate-related subdued demand for cars, among other things, the share price has recorded significant gains and a new all-time high since autumn 2024. The driving factors are improved quarterly figures, the prospect of more affordable vehicle models, the rapid scaling of the business to include electricity storage solutions, progress in autonomous driving and robotics and the recent election victory of Donald Trump.
Nvidia: +2,384% (€10,000 became €248,400)
Nvidia $NVDA (-1.03%) has successfully made the leap from the gaming market to the data center sector. The company's graphics processing units (GPUs) are indispensable for applications in artificial intelligence and machine learning, which has led to explosive sales growth in this segment. This focus on pioneering technologies has been a key driver of Nvidia's meteoric rise $NVDA (-1.03%) since 2023.
S&P 500: +86% (€10,000 became €18,462)
Despite the challenges posed by the COVID-19 crisis and a weak 2022, characterized by high inflation, aggressive interest rate hikes by central banks, fears of recession and geopolitical uncertainties, the S&P 500 $CSPX (-0.8%) achieved a remarkable return of 86% - almost doubling your invested capital in 5 years.