Depot review March 2024 - And on, and on, and on,...
March picks up where February left off. And before that, January, December, November,...

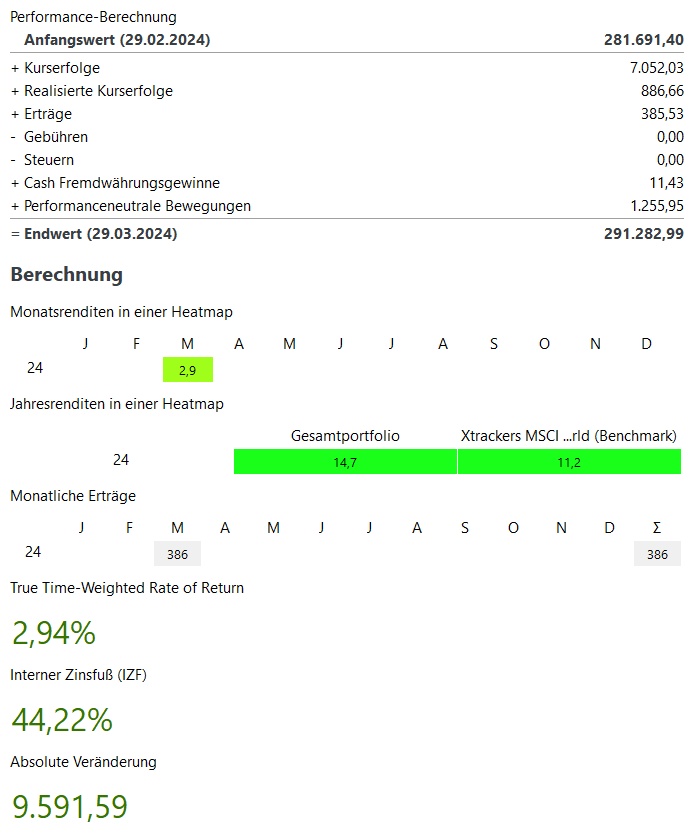
In total, March was +2,9%! This was less than in January and February and was mainly driven by the first half of March. In total, this corresponded to price gains of ~8.000€.
Winners & losers:
On the winners' side is getting really boring. In 1st place, of course: NVIDIA
$NVDA (-2.35%) with share price gains of ~€2,100. 2nd place goes to Alphabet
$GOOG (+2.56%) with €1,000. But also Bitcoin $BTC (-0.02%) also showed a strong performance with price gains of €800. The top 5 is then rounded off by two securities that I would rarely expect to see in the top 5: The MSCI World ETF $XDWD (+1.15%) and the German Bank $DBK (+1.51%)
On the losers' side there is a lot of tech. With Palo Alto Networks $PANW (-0.07%) and MercadoLibre $MELI (+0.5%)
two high growth tech stocks that were already at the bottom in February.
In addition Apple $AAPL (+4.42%)
Nike $NKE (+1.29%)
and Starbucks $SBUX (+0.14%) were weaker.
The performance-neutral movements in March amounted to € 1,300. As in January and February, a larger proportion is currently being spent on private expenses. Nevertheless, I was able to invest significantly more net in March than in January and February. I bought just over €2,000 in March. However, the net figure for the pure securities portfolio is a minus, as I sold my Encavis
$ECV shares after the takeover offer from KKR. As a result, ~€2,600 flowed out of my securities account, which is now in the clearing account for 4%.

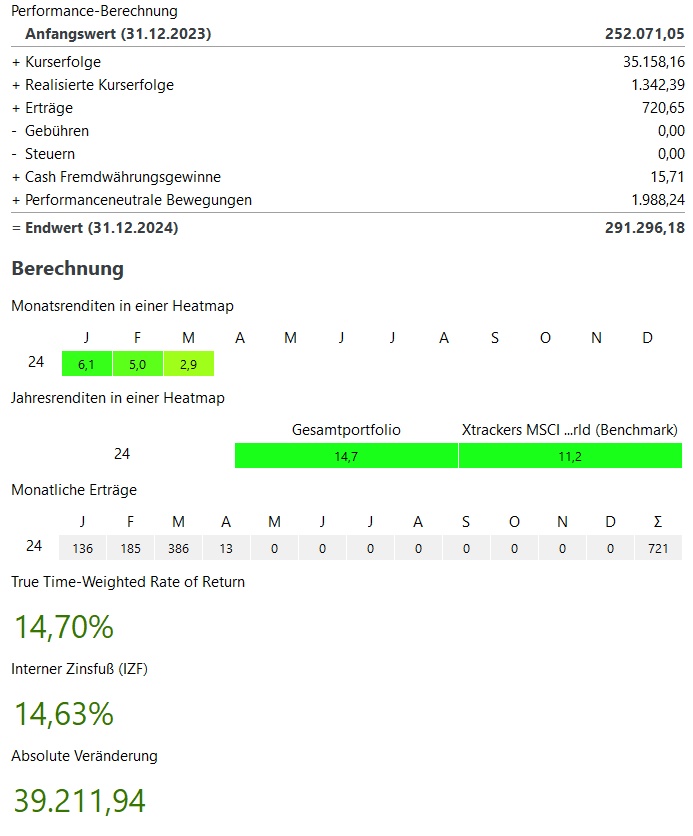
My performance for the current year is +14,7% and thus well above my benchmark, the MSCI World with 11.2%.
In total, my portfolio currently stands at ~291.000€. This corresponds to an absolute growth of ~€39,000 in the current year 2023. ~36.000€ of this comes from price gains, ~720€ from dividends / interest and ~2.000€ from additional investments.
Dividend:

- Dividends in March were +30% above the previous year at ~€350
- In the current year, the dividends after 3 months are also +30% over the first three months of 2023 at ~630€.
- In March, there was also a dividend for the first time from Meta $META (-0.93%)
Buys & Sells:
- I bought in March for approx. 2.000€
- Of which 500€ each in Hermes $RMS (+0.71%) and Constellation Software $CSU (-1.67%) as a first purchase
- In addition, the first few euros saveback from the Trade Republic card were also invested
- As always, my savings plans were executed:
- Blue ChipsNorthrop Grumman $NOC (+0.43%) MasterCard $MA (+3.81%) Salesforce $CRM (+0.21%) Deere $DE (+1.57%) Lockheed Martin $LMT (+0.94%) ASML $ASML (+1.34%) Thermo Fisher $TMO (+1.04%) Itochu $8001 (+2.04%) Republic Services $RSG (+0.39%) Hermes $RMS (+0.71%) Constellation Software $CSU (-1.67%)
- Growth: -
- ETFsMSCI World $XDWD Nikkei 225 $XDJP and the WisdomTree Global Quality Dividend Growth $GGRP
- CryptoBitcoin $BTC and Ethereum $ETH
- Sales there was the (involuntary) sale of Encavis in March $ECV
Even though I was only able to add €2,000 net to my portfolio in the first quarter, the snowball had a very clear effect. Nevertheless, I will of course be investing more again in the medium term.
Target 2024:
My goal for this year is to reach 300.000€ in the portfolio. Now that my portfolio is already at €291,000, I have almost reached my target as of March.
However, I am still of the opinion that the markets will soon enter a sideways trend. In my opinion, this was already slightly indicated in the second half of March.


