Hello everyone,
today there is an analysis of Realty Income $O (+0.04%) . I wanted to take a look at the share because I was interested in it as a dividend add-on. As always, the conclusion is at the end.
As always, it's nicely presented on my site in article format with pictures for each section and an interactive live chart: Realty Income Dividende
Realty Income (WKN: 899744)
Realty Income (WKN: 899744) is a leading real estate investment trust (REIT) and a very popular stock. Especially the high monthly distribution makes it attractive to many investors.
The regular payments provide a stable monthly cash flowwhich comes closest to a real rented property. This makes Realty Income attractive not only for dividend hunters but also for investors who want to participate in the real estate market without having to deal with the challenges and risks of direct real estate investment and rental.
Realty Income describes itself as "The Monthly Dividend Company" and proudly displays this slogan on its own website and in the company logo.
Founded in 1969 by William E. Clark and headquartered in San Diego, California, USA, the company has a rich history and a good reputation. In the meantime, Realty Income has become one of the best-known and most reliable REITs specializing in the ownership and management specializing in the ownership and management of commercial real estate. Under the leadership of CEO Sumit Roy, the company has established a strong presence in the triple-net lease real estate market with a focus on long-term leases that provide tenants with operational stability.
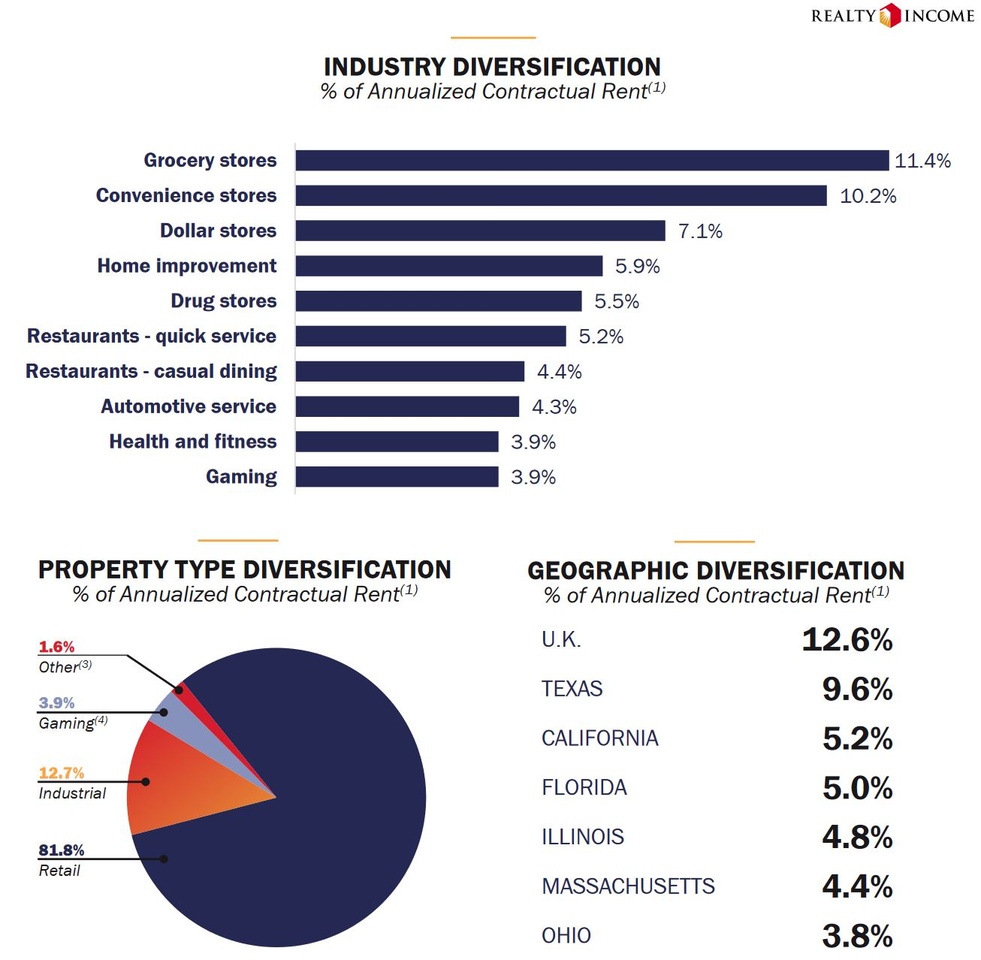
Business model and portfolio
The business model of Realty Income is based on the acquisitionthe leasing and the management of commercial real estate via long-term triple-net leases. With triple-net leases (NNN), tenants are responsible for paying property taxes, insurance and maintenance costs in addition to the rent, which means that Realty Income generates a stable cash flow as the operating costs are transferred to the tenants. operating costs are transferred to the tenants. to the tenants. The company manages a diversified portfolio of properties covering various industries and geographic regions in order to spread risk widely. broadly spread risk and and promote long-term growth.
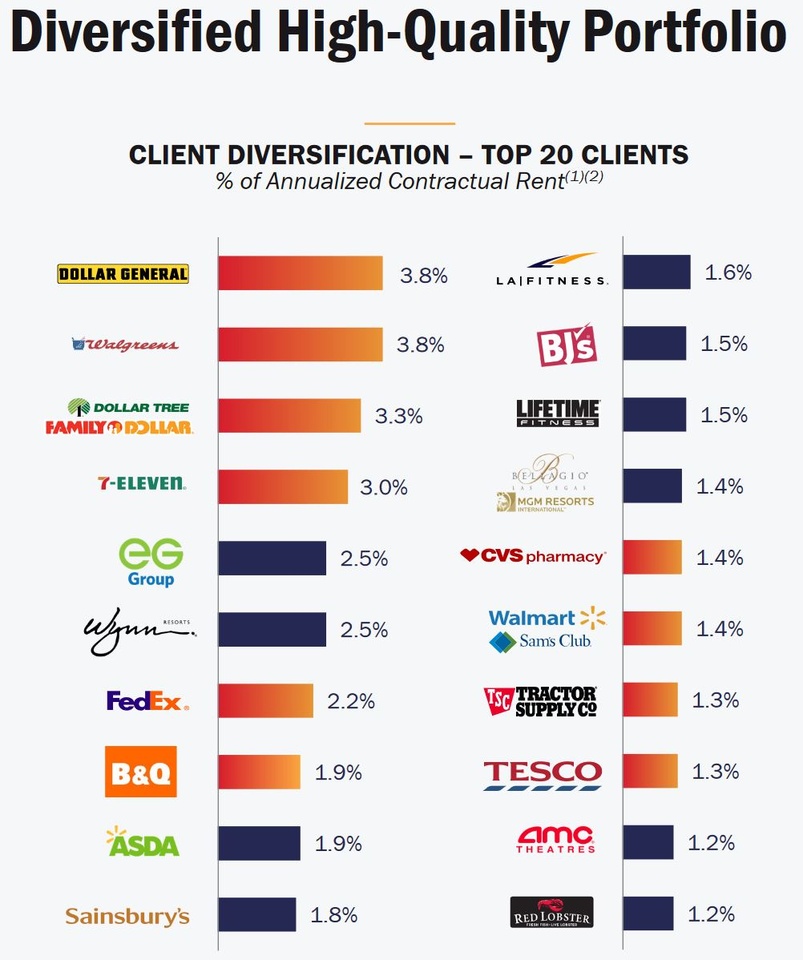
Realty Income Top 20 clients
Realty Income's most important market is the USA, where it has a diversified portfolio of properties covering a wide range of sectors and tenant profiles.
The most important clients currently include various well-known American companies and large retail chains. retail chains such as:
- Dollar General
- Walgreens,
- Family Dollar
- 7-Eleven
- FedEx
- Walmart
This broadly diversified portfolio in various sectors forms a solid basis for Realty Income to generate income, minimize risks and promote growth.
The top 20 clients can be found in the current quarterly report on page 29.
Facts, figures and data
Environment and news
Inflation and the current high interest rate environment are putting pressure on the entire real estate sector, including REITs. Expensive loans are reducing profit margins and increasing default risks for customers with a high debt ratio. But the REITs themselves are also struggling with falling profit margins due to high interest rates. This makes it increasingly difficult to increase or maintain stable dividends.
A particularly painful example from the industry was the REIT Medical Properties Trust in 2023. In my Medical Properties Trust Analyse of 05.03.2023, I warned of the worst-case scenario of the imminent default of a major customer. Rapidly falling share prices led to a calculated dividend yield of well over 10%. Some investors were deceived by the high calculated dividend. The worst-case scenario actually occurred and the share price fell by over 70% after the analysis was published.
Realty Income is much better positioned thanks to its is much better positioned thanks to its excellent diversification and is not dependent on a single sector or client. The risk of $MPW (-1.95%) is not a threat here.
In addition, with rising yields on fixed-interest bonds investors' willingness to invest in riskier securities. The combination of rising risks and falling demand leads to falling or stagnating REIT prices.
The trend towards mobile working and home office is also exerting pressure on office buildings and commercial real estate, as office rental space has become less necessary and in demand in recent years, thereby also squeezing landlords' profit margins. Even if this is not the decisive factor, it is exacerbating the already difficult environment in the real estate sector.
Quarterly figures Q4FY2023 Report
On 21.02.2024 presents Realty Income Investor Relations presented its quarterly figures for the fourth quarter and the full year 2023.
In the fourth quarter of 2023 turnover compared to the previous year by 21.1 percent to 1.08 billion dollars. Analysts were expecting 1.02 billion, which means the sales target was exceeded.
The earnings per share were 30 cents per share and therefore 20 percent below the previous year's figure 36 cents per share. The market expectation was 33 cents and was clearly missed.
The reported Realty Income dividend for 29.02.2024 amounts to 26 cents or 3.06 dollars annual dividend.
The current dividend yield is dividend yield with a share price of 52,63 dollars 5.81 percent.
Realty Income Dividend Calendar
Here you can find all Realty Income dividend ex-dates, the payment dates and the expected monthly dividend amounts for 2024. A dividend of 3.06 dollars has been announced for 2024.
The next dividend cut is due in a few days on 29.02.2024 and the payout will follow on 15.03.2024.
Realty Income Dividendenkalender
17 analyst opinions on the Realty Income share
The current sentiment of analysts as of February 25, 2024 on Consorsbank / FactSets is as follows. Out of a total of 17 analysts rate:
- 8 buy
- 0 overweight
- 9 hold
- 0 underweight
- 0 sell
The price potential for the year is currently estimated at 60 dollars at 14,43 % seen. This is a good yield for a defensive dividend share with an annual dividend of currently 5.81%.
Realty Income chart analysis
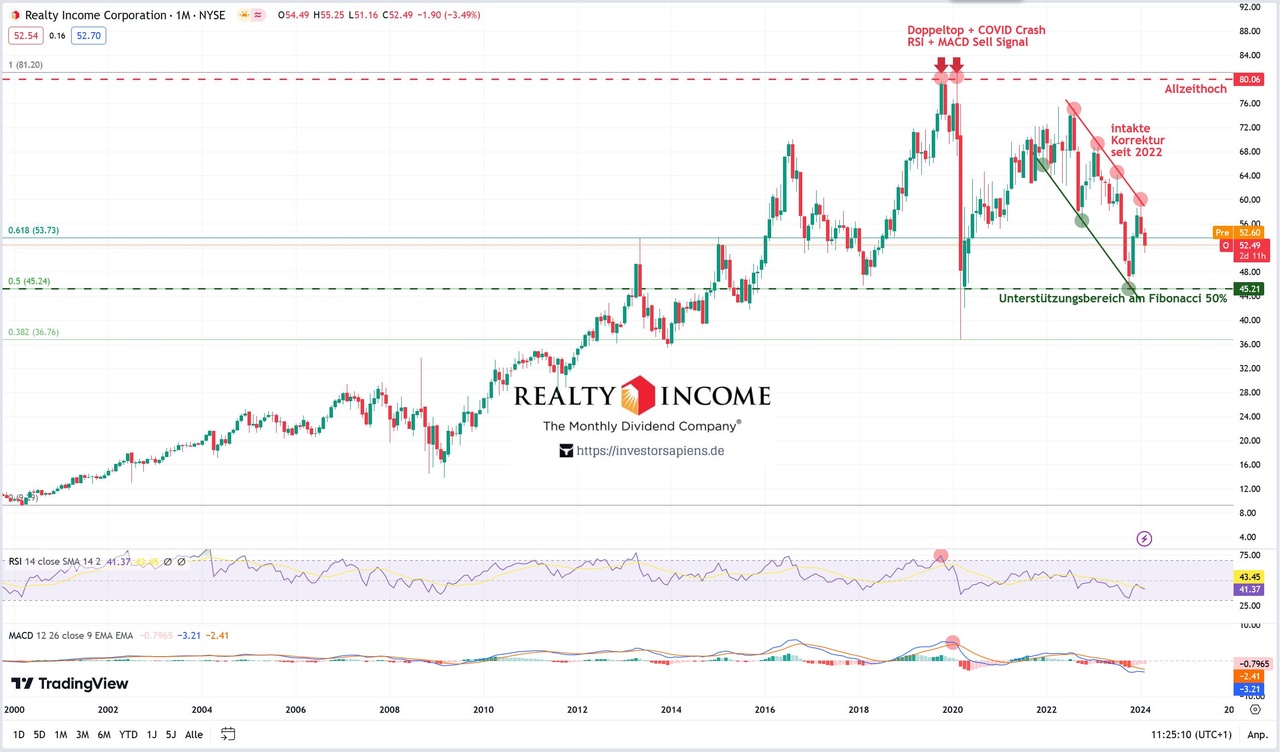
Big Picture (25 years)
In the big picture (25-year view, 1 candle = 1 month), Realty Income is in a 5-year correction that has not yet ended. The COVID crash from February 2020 to March 2020 led to a lightning correction in Realty Income of around -55%. However, this was not a realty income-specific phenomenon, but affected the entire global economy and affected all REITs (e.g. W.P. Carey, Medical Properties Trust, Prologis and others) to the same extent.
During the lockdown, the risk of a total loss of rental customers was incalculable. Whether gastronomy, entertainment or retail, all were initially equally at risk. However, the situation eased relatively quickly and the markets and REITs have partially recovered. However, the correction is still not over. The ongoing phase of high interest rates and the high prime rate are weighing on customers as well as REITs and Realty Income itself.
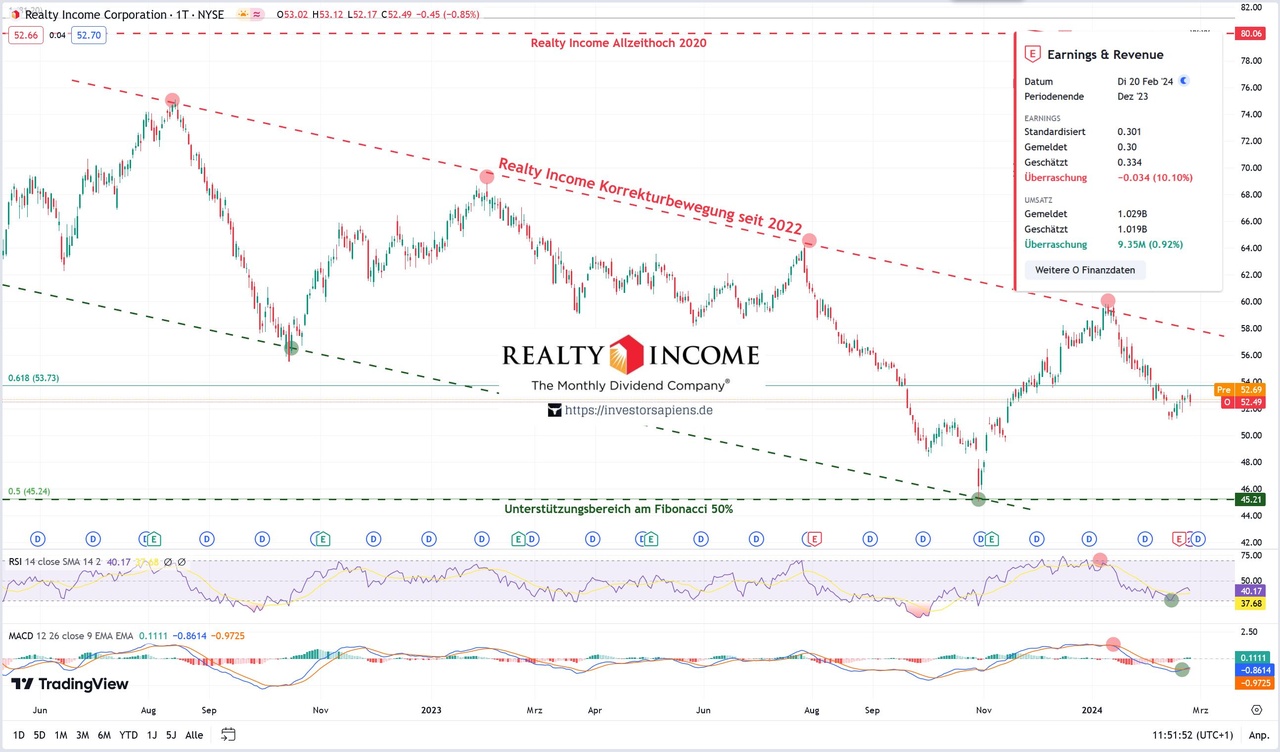
Realty Income correction
The 2-year correction since around mid-2022 is still active. Ongoing interest rate pressure is causing problems for the real estate sector and REITs. Currently, the area at the Fibonacci 50 % level at around 45 dollars as support. So far, there are no signs of a trend reversal or the end of a correction. In the short-term picture, Realty Income is oversold in the short term, so there may be a countermovement over the next few days. However, as long as the price does not move above the upper limit of the trend channel, which has been tested many times, there will be no change from a technical point of view.
On the downside, a retest of the support level would be interesting. Should the share reach the USD 45 area and then turn upwards again, a bottom formation and an end to the correction would be possible. This scenario is also supported by the long-term chart with monthly candles. Both indicators there are still negative, but could form a positive signal in the coming months.
Indicators (RSI, MACD)
The MACD and RSI indicators are positive in the daily chart and may lead to a countermovement a countermovement within the downward trendtrend, but Realty Income remains in remains in correction mode.
In the long-term chart (monthly candles), the RSI and MACD are negative, but are close to the oversold area.
Within the downtrend, the share is pretty much in the middle of the downtrend. in the middle of the downtrendThere is enough scope for movement both upwards to around USD 60 and downwards to USD 45 without changing the chart picture. From a technical point of view, a sustained movement could only be expected outside these two limits.
Realty Income conclusion of the stock analysis February 2024
Environment and news
The environment remains difficult for REITs as a whole and for Realty Income for the time being. difficult. High key interest rate weighs on results. Competitive pressure of safer high-yield bonds is reducing demand, which is lacking on the buyer side. Even if the company is well positioned, the high-interest phase is weighing on the entire sector and therefore also on Realty Income. On the other hand, the prospect of interest rate cuts coming sooner or later interest rate cuts an opportunity. If sales increase and margins pick up in a positive environment, this will be reflected in the share price and the dividend.
Analysts' sentiment
The analysts are unanimous. There are no sell recommendationsand no underweight recommendation. Out of a total of 17 analysts, 8 analysts see the share as a buying opportunity8 other analysts would hold the share hold. The price target is currently at 60 dollars with a potential upside of 14.43 % over the year.
Realty Income chart analysis
The chart analysis for Realty Income currently provides no new signals. The price has been in a downward trend for 2 years downward trend and at the time of writing is pretty much in the middle of the trend channel. The upper limit is around 60 dollars and the lower limit is around 45 dollars. Only outside this price range would the chart picture change significantly and generate a signal.
Outlook
Realty Income is a well-positioned companywhich is trading just under 35% below its 2020 all-time high in a negative high-yield environment. The negative environment is dragging down all REITs and weighing on margins. Despite the industry crisis, Realty Income continues to expand its own portfolio, increase sales and grow.
In the short and medium term, the company is in a correction. Neither the chart analysis nor the central banks currently provide reasons for an immediate end to the correction. We must therefore continue to expect moderately falling prices be expected.
In the long term the prospect of interest rate cuts with rising margins and the stable dividend payment offer opportunities for new all-time highs.
In my view, there is currently no urgent need for action on Realty Income. Wait and seehow the correction develops over the next few weeks/months would probably be the most rational option.
Those who are already invested will probably remain so despite the ongoing correction. Those who believe in the company and hold the share via savings plan are probably not doing anything wrong in the long term, as long as the general conditions do not change fundamentally and the ongoing correction is not perceived as a burden.
As always: No investment advice and no recommendation to act. Purely an informative article.
I appreciate every follow ❤️