
Gas prices have risen sharply at the moment. One of the price drivers is the Alaska Ridge. This is a strong area of high pressure over Alaska that steers the jet stream in such a way that cold air flows deep into the densely populated regions of the USA. Both the European ECMWF model and its AI-based counterpart (AIFS) show a consistent and intensifying formation of this pattern for mid-December.
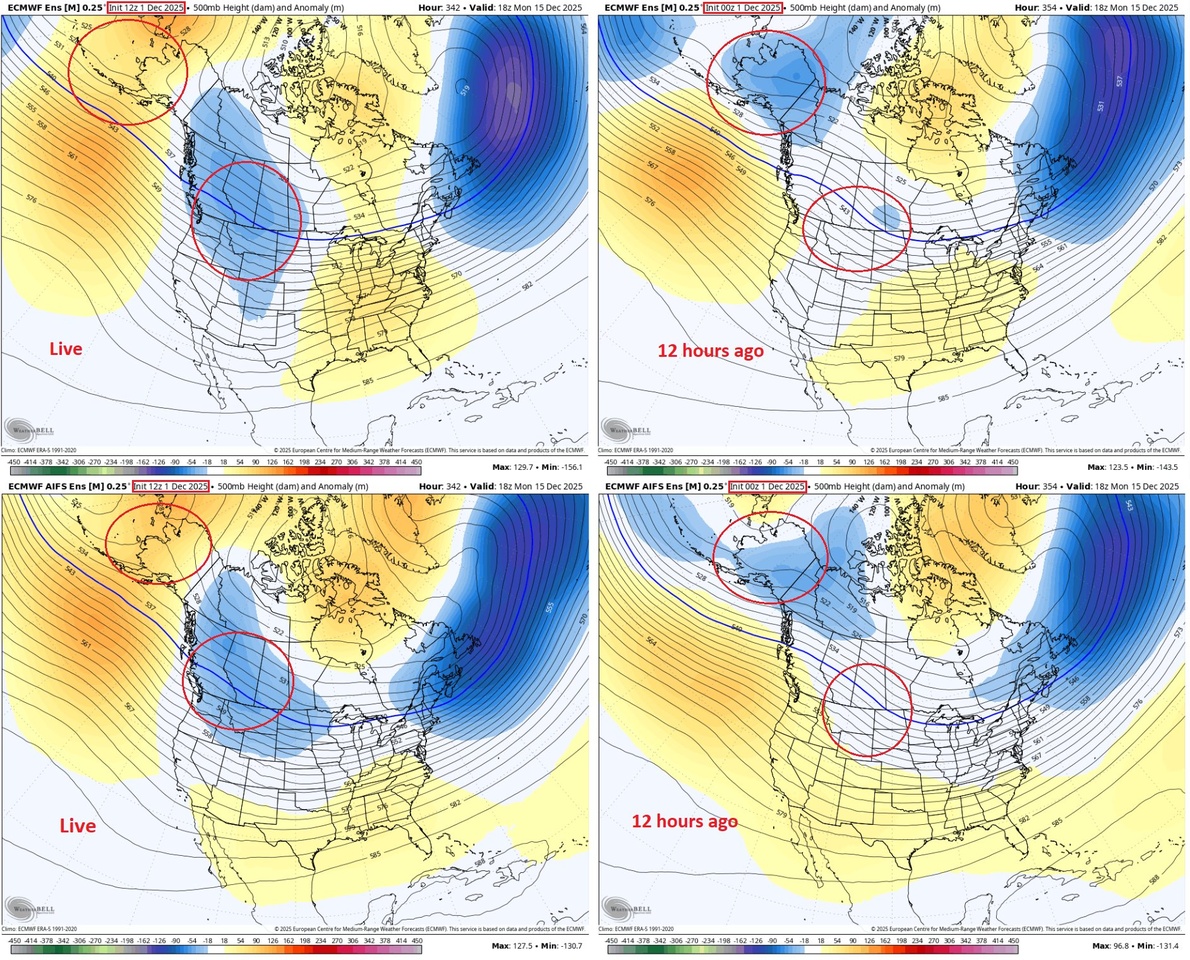
To illustrate this, I would like to explain this map to show how to recognize the ridge. If you look at the upper red circles over Alaska and the North Pacific, you can see that they are intensely orange or red in color. These are so-called positive anomalies of the 500 hPa height. In short, the ridge, which shows a strong air pressure in the middle atmosphere. All 4 models show a high prediction probability. If you now look at the lower part, with the red circles, over the central and eastern part of the USA, which is dark blue, you can see negative anomalies of the 500 hPa height. A so-called trough. This indicates very low air pressure. The jet stream is characterized by the black isolines and is pushed far to the north by the red Alaska Ridge and then forms a deep depression, the blue trough over the east. This combination is actually the mechanism that would trigger the strong demand for natural gas in the USA.
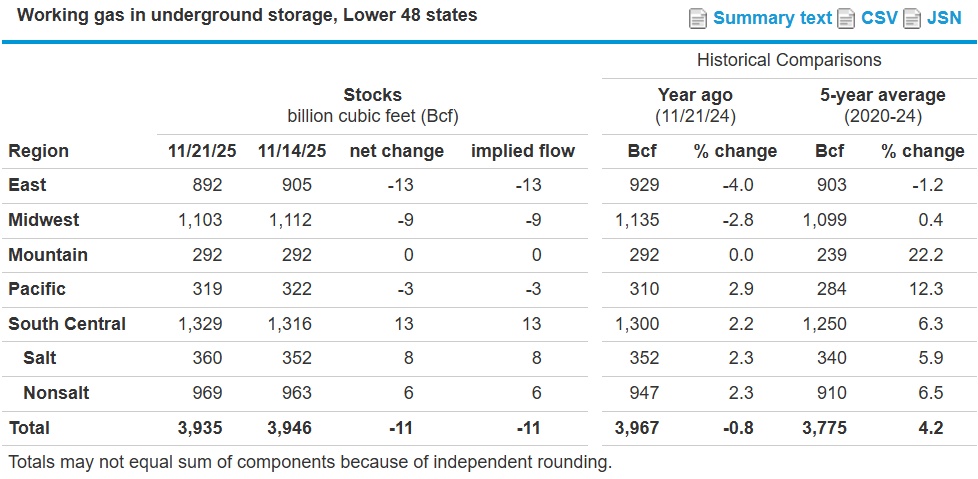
If you look at the current situation of $NGAS (-0.96%) you can see that they are filled to over +4.2% of the 5-year average. This buffer is actually a key bearish counterargument. As long as it exists, it basically prevents a real shortage. However, the market is now focusing on how quickly this buffer could be reduced by withdrawals. The first drawdown of -11 Bcf *(estimated: -9 Bcf*) was a first bullish signal due to the higher demand.
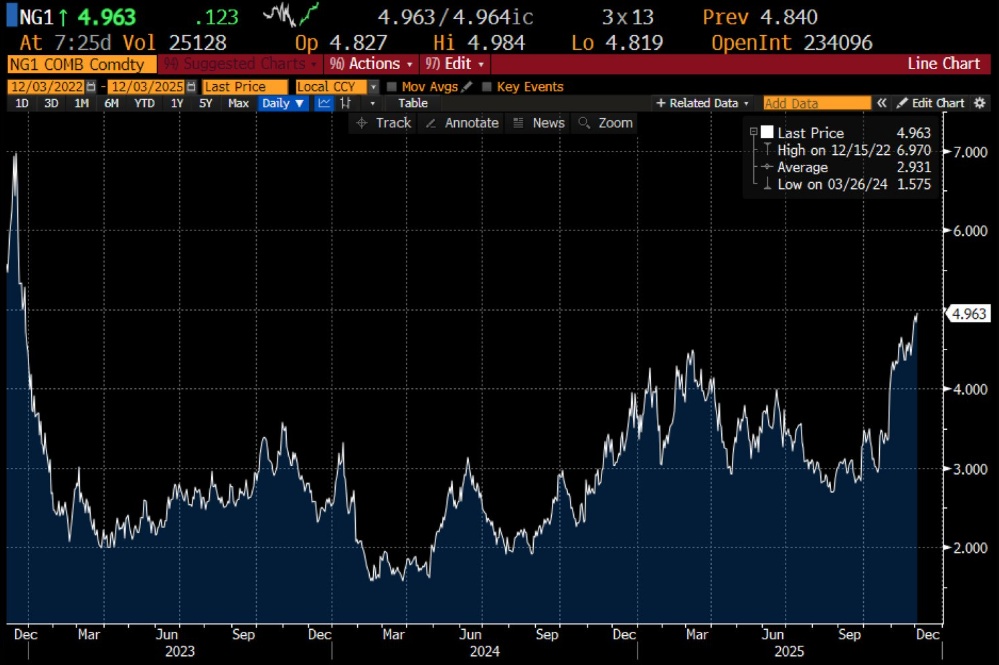
In short, the price of $NGAS (-0.96%) will test the 5USD, and with a considerable chance of breaking through that too, if for the next week, we see a constant withdrawal from storage. The weather would speak for that.