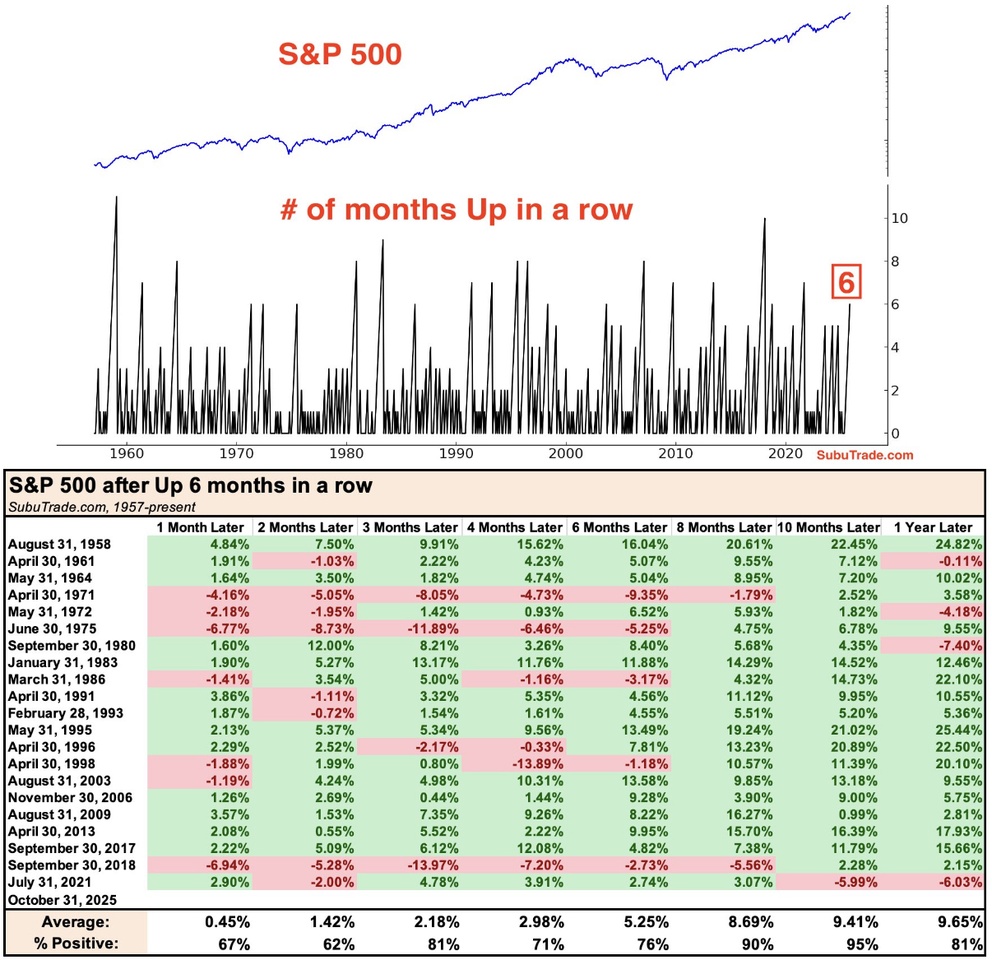
📈 The $SPY (+0.5%) or auc $CSPX (+0.04%) has risen for 6 months in a row. What happens statistically after that?
Historical data since 1957 show:
➡️ +9.6 % on average one year later
➡️ 81 % of cases positive
➡️ Only rare correction phases
The markets are running - but for how much longer?
We analyze exactly such cycles live every day at Grey Capital - with data, timing & setups before they become mainstream.
Join Grey Capital and learn how to read market cycles before they tip🤓