1Mon·

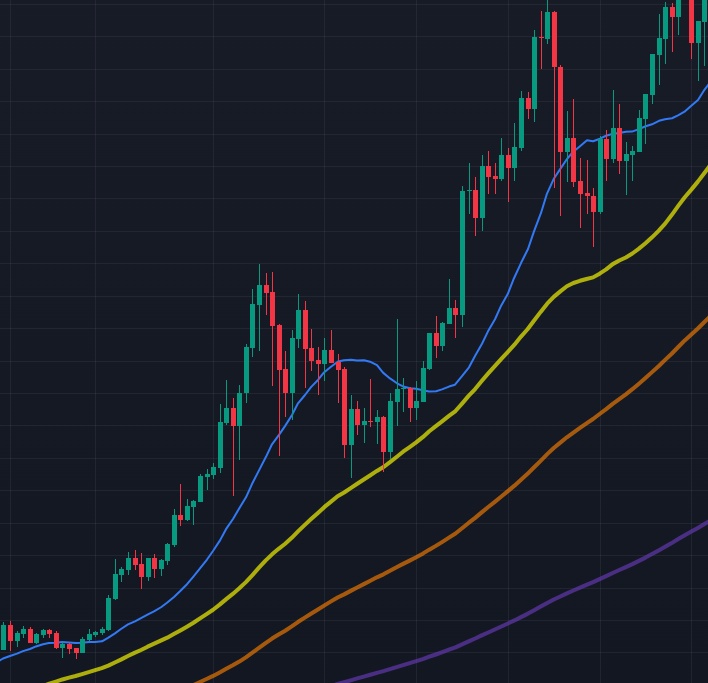
Bitcoin moves similarly to 4 years ago

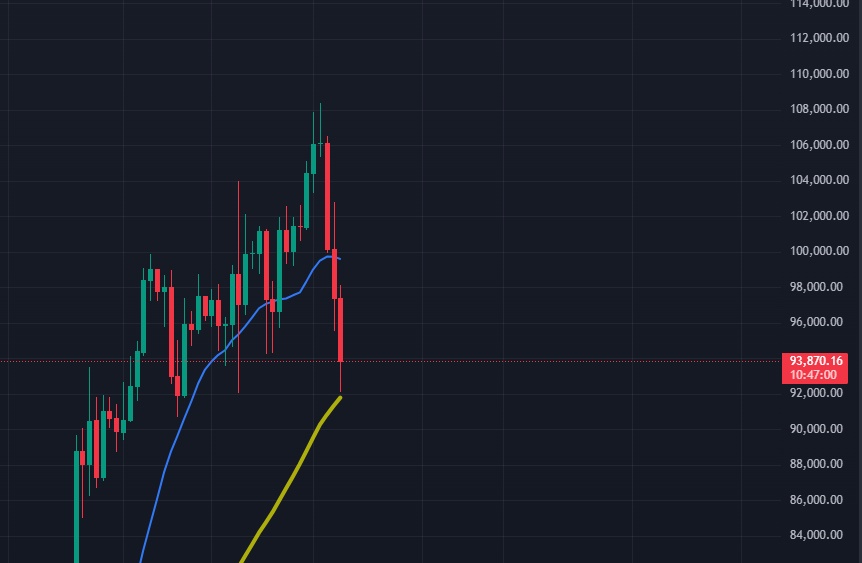
In the last bull run, Bitcoin broke through the 20 day SMA (blue) on the daily chart several times and tested the 50 day SMA (yellow) line. If we close several days above the 50 Day SMA, then we could see a similar behavior of the Bitcoin price as 4 years ago until it goes higher again in January and February. That's the theory, but of course nothing is guaranteed. Historical patterns are sometimes broken.

I remain curious and am eyeing a (re)purchase at $COIN (-2.51%) , $MSTR (-2.1%) and of course $BTC (-1.98%)

(Not Financial Advice)
attachment
attachment
15
4 Comments

So we could see further drop next week?
2
profile image
@investingbeginner We are currently sitting just over the 50 SMA on the daily chart. In the last Bullrun this was always the end of the price drop. I can't tell you the future. I can show you historic patterns though.
2
profile image
Yes, it could drop more, but also it will give us another ATH before Trump, now we know the reps or the congress wont make It easy for Trump, so we should expect a rollercoaster but mostly to the upside
profile image
Join the conversation