Hello my dears,
I have a company comparison for you today, Sunday.
As I'm also looking around Japan at the moment, there is of course a Japanese company in the list.
Which company do you like better and why?
And in your opinion, is this a growth sector?
I look forward to many comments.
@EpsEra
@Liebesspieler
@TradingHase
@All-in-or-nothing
@Klein-Anleger1
@Aktienfox
and all the rest of you dear ones.
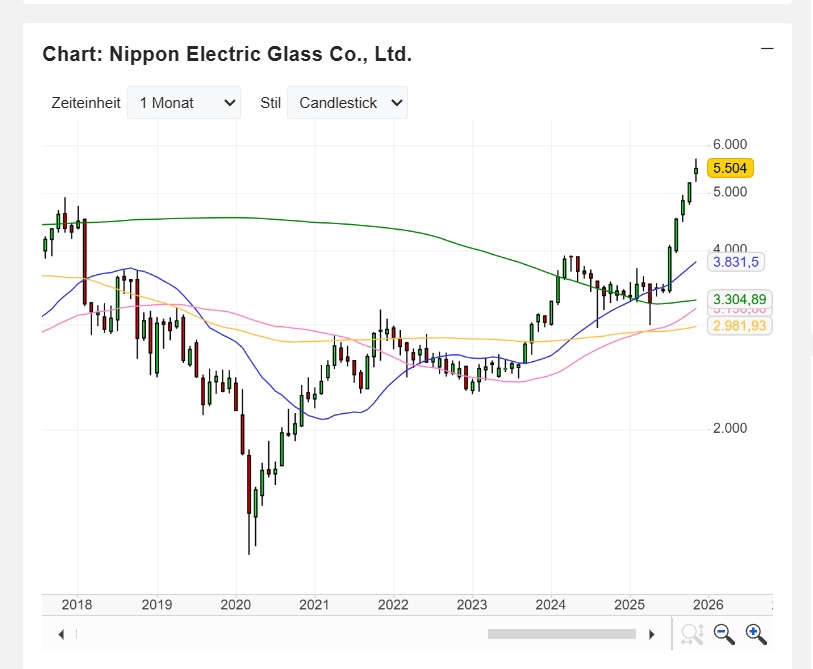
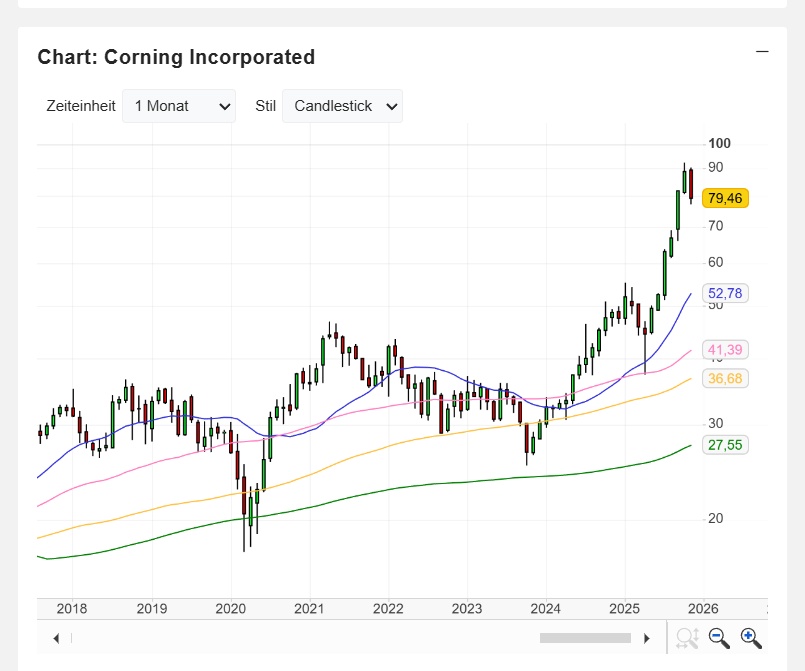
$5214 (-6.53%) and $GLW (-4.85%)
Nippon Electric Glass Co., Ltd. specializes in the development, manufacture and marketing of special glass. Net sales break down by product family as follows:
- Glasses for electronic components (52.9%): LCD screen glasses, plasma screens, cathode ray tubes, optical products, etc.;
- Performance glasses (47.1%): mainly glass fibers, heat-resistant glasses, glass tubes for lighting, glass tubes for pharmaceutical and medical purposes, glass foils and glasses for building materials.
At the end of 2021, the Group had 16 production sites worldwide.
Net sales break down geographically as follows: Japan (14.6%), China (29.7%), South Korea (16.6%), Europe (14.7%), the United States (13%) and other (11.4%).
Number of employees: 5,498
Corning Incorporated is a global leader in the manufacture and marketing of specialty glass and ceramic substrates. The breakdown of net sales by market is as follows:
- Telecommunications (35.5%): Products made of glass fiber, cables, etc. for communication networks;
- Consumer electronics (20.8%): Glass substrates for LCD screens of televisions, PCs and laptops;
- Environment (11.9%): Ceramic substrates and filters for vehicle emission control systems;
- Life sciences (7.1%): in particular optical biosensors for pharmaceutical research;
- Other (24.7%): Solutions based on specialty plastics and glasses, particularly for the semiconductor, aerospace, defense, astronomy and metrology sectors.
Number of employees: 56,300
Nippon Electric Glass Corning Incorporated
JPY in millions USD in millions
Estimates Estimates
year
Turnover
Change in
year
Turnover
change
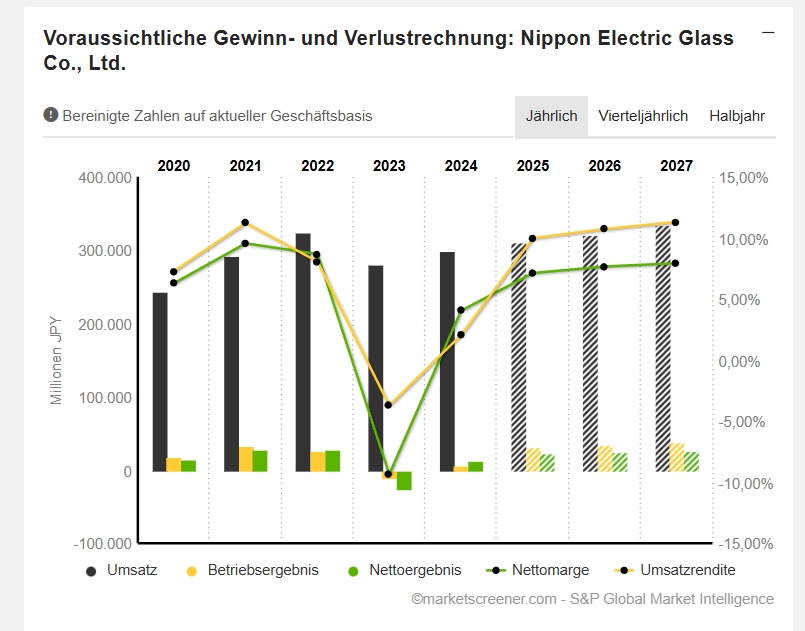
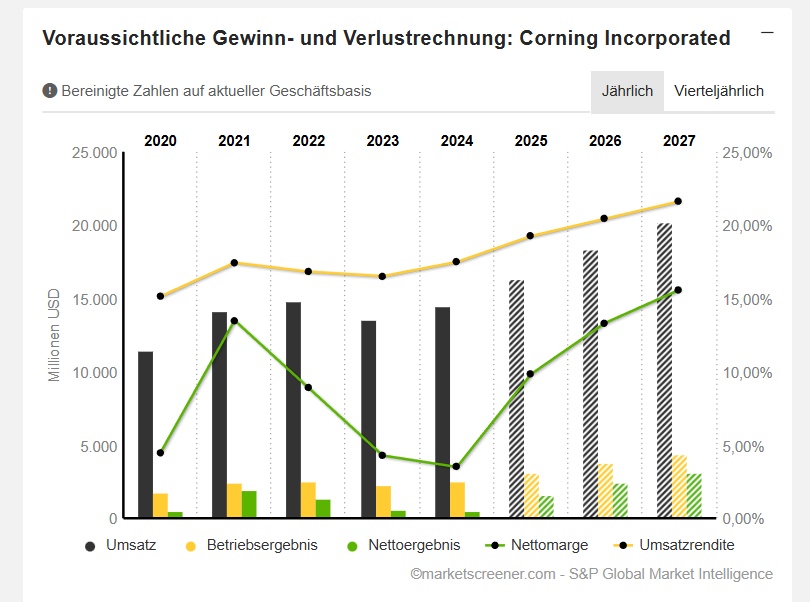
2025 310.715 3,84 % 2025 16.348 12,98 %
2026 320.191 3,05 % 2026 18.359 12,31 %
2027 334.033 4,32 % 2027 20.233 10,21 %
Year
EBIT
Change in
Year
EBIT
change
2025 31.002 406,58 % 2025 3.147 24,38 %
2026 34.329 10,73 % 2026 3.751 19,2 %
2027 37.767 10,02 % 2027 4.374 16,6 %
Year
Net energ. Change
Year
Net energy change
2025 22.123 82,97 % 2025 1.607 217,67 %
2026 24.502 10,75 % 2026 2.447 52,22 %
2027 26.483 8,09 % 2027 3.152 28,82 %
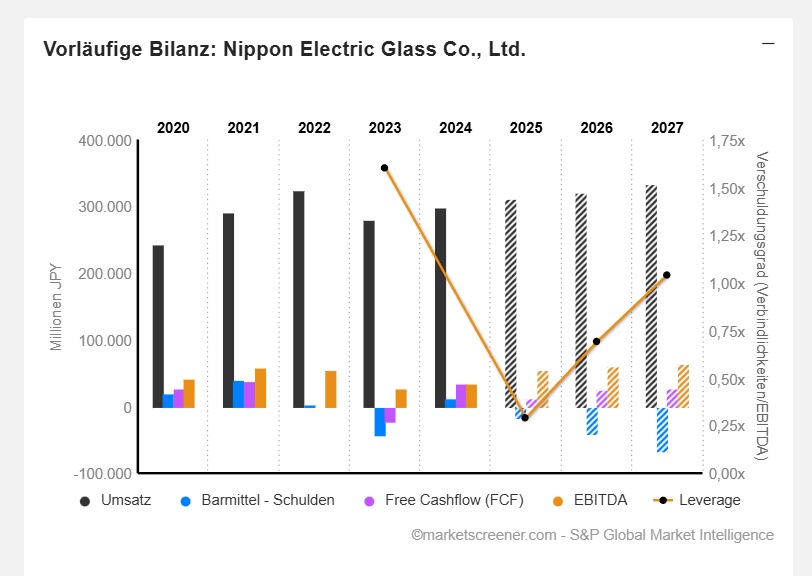
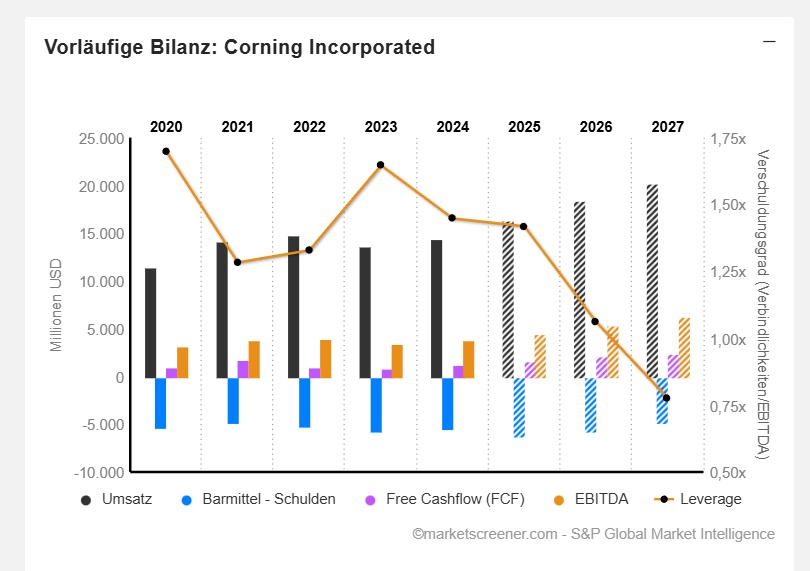
Year Net free cash flow Year Net free cash flow FreeCashf
2025 16.195 12.889 2025 6.298 1.643
2026 41.033 25.546 2026 5.714 2.076
2027 66.183 27.159 2027 4.869 2.391
Year
EBIT Margin
ROE
Year
EBIT margin
ROE
2025 9,98 % 4,58 % 2025 19,25 % 19,29 %
2026 10,72 % 5,12 % 2026 20,43 % 21,24 %
2027 11,31 % 5,59 % 2027 21,62 % 22,88 %
Year
Earnings per share
Year
Profit p share
2025 283,8 2025 1,822
2026 326,7 2026 2,629
2027 382,6 2027 3,435
Year
P/E RATIO
PEG
Year
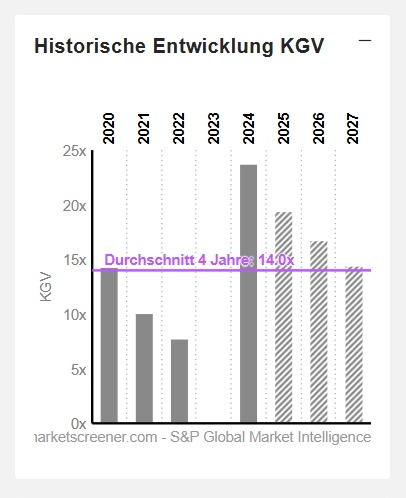
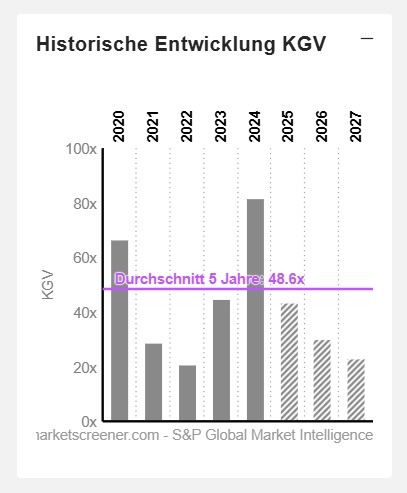
KGV
PEG
2025 19.4x 0x 2025 43.6x 0x
2026 16.8x 1.1x 2026 30.2x 0.7x
2027 14.4x 0.8x 2027 23.1x 0.8x
Year Dividend yield
Year Dividend yield
2025
2,65 % 2025 1,43 %
2026
2,83 % 2026 1,51 %
2027
3,01 % 2027 1,62 %