1Wk·

56% CAGR since 2000? Just utopian theory or actually possible? 📈🛡️ My path of single stock momentum investing

Foreword


I know what you're thinking. Is it time for finance porn again? You normally only see figures like this in dubious YouTube videos, WhatsApp or Telegram groups. But behind this theoretical performance is not a "magic trick", but a tough, quantitative set of rules. You will not only see the historical backtest returns below, but I will of course also show you the real returns that have been achieved since the start of the project. In the end, decide for yourself how realistic and how high the average annual return can be.


Introduction


Many private investors invest based on gut feeling, news headlines or "hot tips". I have decided to tune out the noise and put my trust in the bare figures. After months of development and intensive backtesting, today I present to you the logic of my S&P 500 Hybrid Momentum Model.


My goal: to motivate you to understand momentum not as "gambling" but as quantitative engineering and, of course, to get as close as possible to the returns of the backtest.


🔍 The origin: From ETF to individual stocks


It all started with classic momentum ETFs and strategies such as GTAA (Global Tactical Asset Allocation). But I wanted to know: Could this principle be transferred to individual stocks to significantly beat the market? After hundreds of backtests, analyzing various universes (SPY, QQQ) and sectors, I now have my set of rules.


💡 The basic idea: "Buy high, sell higher"


Winners" statistically continue to run, while "losers" continue to fall - Buying at the ATH is historically more profitable than buying at the ATL.


While value investors act according to the motto "buy low, sell high", momentum uses the statistical tendency: Winners keep on running.


  • An all-time high (ATH) is not a warning signal, but a sign of strength.
  • The opportunity costs (waiting on the sidelines) are historically often higher than the risk of buying at the peak.


🧩 The concept: a selective powerhouse


My approach is a purely quantitative set of rules that isolates the strongest trends in the S&P 500:


The Universe: Focus on the 500 most liquid US large caps (S&P 500).

The selection: A pool of 8 stocks is selected through a time-weighted momentum scoring filtered. More recent price developments (last 6 months) weigh more heavily in order to capture trend reversals early.

The anchors: Oil & crypto proxies flow in as strategic counterweights to generate additional performance in specific cycles (inflation/risk-on).

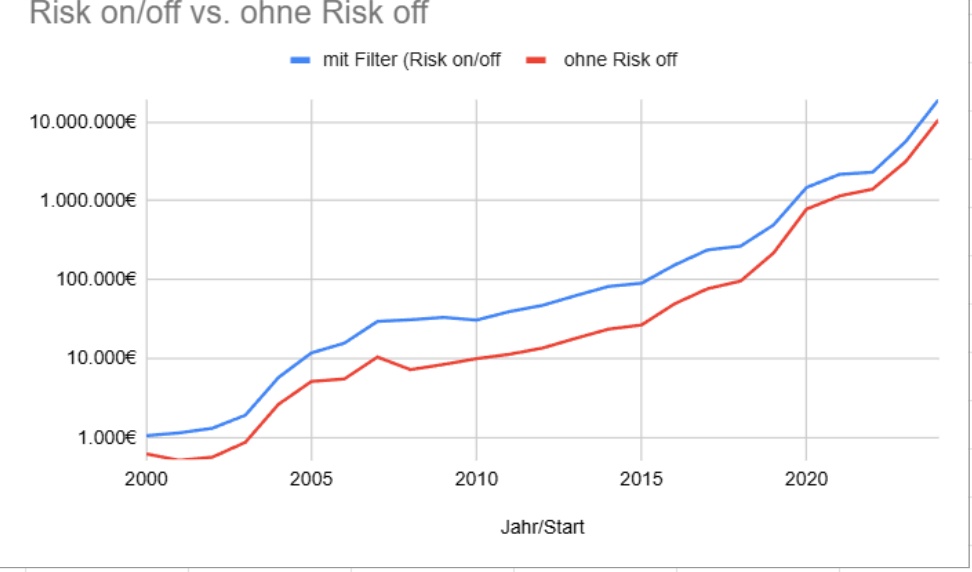
The safety belt (absolute momentum): To avoid massive drawdowns like in 2000 or 2008, the S&P 500 Index acts as a market filter. If the signal is negative, the model consistently switches to cash or money market cash or money market ETFs.


⚙️ Execution: focus on the leaders


A review takes place every month. Only the top 2 assets with the highest average score are held.


  • Why only two? The model is optimized for maximum performance. Diversification (top 3 or top 5) would reduce the maximum drawdown slightly, but would significantly dilute performance. If you prefer a more relaxed and less volatile approach, it is better to diversify here.


  • Capital preservation as a turbo: Those who lose less in crises benefit exponentially more from the next upswing due to compound interest.


📊 Performance & live results


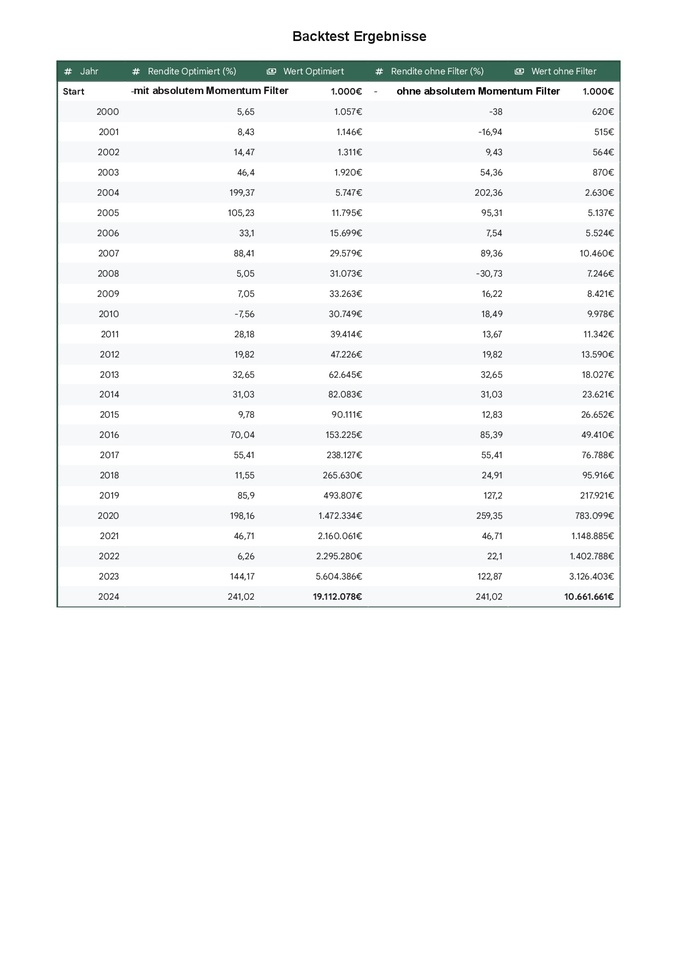
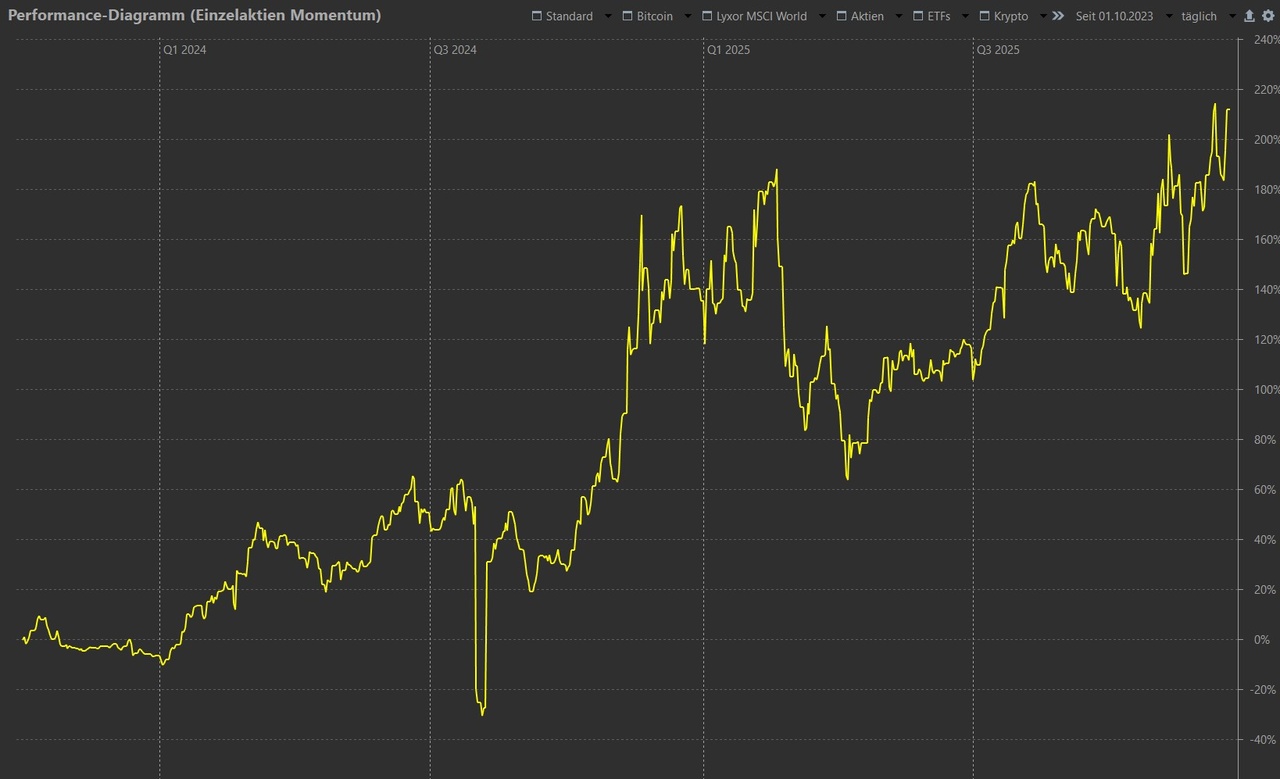
The theoretical data (2000-2024) shows an impressive CAGR of 56 %. I have been actively implementing the model since the end of 2023 - with approx. 80% of my total portfolio out of full conviction:

attachment
attachment


Returns

  • 2024 +152,1 %
  • 2025 YTD: approx. +30 %


attachment


⚠️ Transparency on risk & volatility

High potential returns require iron discipline. The strategy is not for the faint-hearted:

  • Maximum drawdown: In the backtest there were setbacks of up to -37% (dotcom bubble 2000).
  • Psychology: The biggest enemy is not the market, but deviating from the rulebook in volatile phases.
  • Costs & taxes: Since it is a theoretical model, transaction costs and taxes reduce the result in reality. Nevertheless, the alpha advantage remains massive.


Conclusion

I will provide regular updates here on how the model assesses the current phase. This is not the only way to be successful - but it is my systematic way.


Become the engineer of your own portfolio. Test, optimize and stay disciplined.


Do you have any questions about the topic or anything else? Let me know in the comments! 👇


#Momentum
#Investing
#SP500
#SystematicTrading
#Finanzen
#TradingStrategy
#Backtest
#Wealth


Risk warning: No investment advice. Historical prices do not guarantee future profits. Any investment can lead to a total loss.

38
42 Comments

profile image
Very interesting! I would be interested to know how you implement this strategy: Do you place your orders manually? What is a sell signal in your strategy? (Touching the 200/100/50 day line, or a percentage below the ATH?)
7
profile image
@Pazzzi The orders are executed manually at the beginning of the month, if it is necessary at all. A sell signal is given either when the parent index (in my case the S&P500) has negative momentum, in which case it is switched completely to cash, or when the two assets from the previous month are no longer in first or second place in the ranking because they have been overtaken by the other stocks,
2
profile image
@Krush82 Ah okay monthly. How did you calculate this strategy up to the past?
profile image
@Pazzzi was perhaps a bit of chance, or rather the luck of the brave. After trying dozens of different approaches, which stocks are suitable and which are not, I simply took the top stocks of the s&p 500 for each year and tested how they would perform in the coming year. So after many more backtests I came to the conclusion that top 2 out of top 8 + oil stock and crypto stock deliver the best performance
1
profile image
@Krush82 Really interesting, I'm looking forward to the future performance 😁🚀
1
profile image
@Pazzzi I will continue to report. For now, let's bring the year to a close
1
profile image
Interesting, the return corresponds to my expectations! However, due to my small capital, it is very difficult to implement. So I will probably stick with my high-risk approach to achieve an excess return until my portfolio has reached a relevant size in terms of volume.
4
profile image
@Multibagger what does small capital mean? i also started small and it's still manageable :-)
profile image
@Krush82 I use a maximum of 5% of the portfolio value per investment in equities. If I now imagine that Netflix is one of the best momentum stocks, I am back to 0..... % shares. And I don't want that. But at the latest when I have successfully completed my current project with €100,000, I'll come back to you.
profile image
@Multibagger ok i understand with the 5% it would be difficult :-) Then I'll keep my fingers crossed that you reach your goal quickly. until then I'll keep a place free for you. youre welcome :-)
1
profile image
Really very interesting. I look forward to the updates. 👍
4
profile image
Very interesting!

I have some questions about the math behind it:
- How exactly do you calculate the momentum score - e.g. sum[weights_time_window * normalized momentum_time_window]?
- How high do you weight which time windows?
- What method do you use to evaluate the momentum of the S&P 500 for the possible switch to cash?
4
profile image
@McZed There is a very simple and proven methodology behind it. No special weighting is required to calculate the momentum score, I have tested a lot whether it would make more sense to weight the short or longer period higher or not. In the end, I have always achieved the best results when the average time period is 4.5 - 5 months. So simply use the sum of the monthly performance from 1,3,6,9 months - Since the use of possible SMA 100, 150,200 etc. provides the wrong signals for switching to cash when evaluating the momentum of the S&P 500, the same calculation of the momentum score applies here as mentioned above for the momentum evaluation.
2
profile image
This year I also selected stocks based on momentum in my stock ideas. However, I still filtered for a falling P/E ratio and earnings growth of over 20%. And some USERS who bought after the presentation. Were grateful for that.
@Multibagger @Crash-Propheteus.
Can you perhaps tell us about your individual stocks in between?
4
profile image
@Tenbagger2024 Which individual values do you mean exactly?
profile image
@Crash-Propheteus
Z. For example, your last one 🚀. Or $FEIM
profile image
@Tenbagger2024 Oh yes: $RKLB of course
1
profile image
@Tenbagger2024 In any case, momentum is a good indicator that can certainly be combined well with your other criteria. I would be happy to share my selection here at the start of the year
5
profile image
Superb work!
What do you think is the capital framework with which the model can be implemented?
Below €1k, transaction costs are likely to have an impact, above €1m, market liquidity is likely to be difficult. Or what do you think?
3
profile image
@Epi I think the range you mentioned fits quite well. I'd be happy to tell you and the others how I did it at some point with >1 million :-)
2
profile image
Thanks for the insight. Very interesting 😊.
2
profile image
Interesting to note: There is a wikifolio that almost exactly replicates this strategy, only with Top10 instead of Top2 and without pre-selection (pool) as far as I know.
However, it has performed very lousily so far and has tended to move sideways.
ISIN: DE000LS9SHS4
Have you ever thought about publishing your strategy as a wikifolio?
1
profile image
@Simon_n Thanks, I'll take a look at that. The lousy performance may be the result of what I told you before. Top 10 and no preselection is probably counterproductive - as there is no "high conviction" And I'll think again about my own wikifolio if there is enough demand
2
profile image
@Krush82 Or too frequent a rotation. The chart looks very "jagged", i.e. always phases of good and then bad performance.
This may suggest that the lack of pre-selection means that frequent false signals lead to the temporary inclusion of stocks that are only experiencing hype.
Unfortunately, the method of calculating the relative momentum is not described in the wikifolio, but this could also be a source of error.
And I think there is demand for a post like this 💪 As far as I know, it doesn't cost anything either
profile image
@Simon_n I took a look at it. There are definitely a lot of trades he has made. Very high turnover, I haven't counted how many different shares he has bought / sold, but it seems to be quite a lot. I would also be interested to know over what period he measures the momentum. I would mostly agree with the current allocation, I think he only looks at the 6M momentum or something like that. Oh yes, what I wanted to say about the top 10 instead of top 2 or top 3. I think it would be better not to have an equally weighted allocation, but to weight them according to the momentum score
2
profile image
@Krush82 Interesting, did that come out of the backtests? In GTAA Top 3, for example, it makes no difference whether you weight the assets in descending order or equally, but there are only three of them.
I'm still generally surprised that less diversification makes such a huge difference here. Couldn't quite understand why exactly this is the case 🤔
profile image
@Krush82 and regarding the backtest: you said you do it with PV, you just need to know the stocks that are currently on: But then how did you test that since 2000? You would need the historical data for all stocks in the S&P500 at every point in time for 26 years, wouldn't you? That would be practically impossible to recalculate everything by hand
profile image
@Simon_n the simplest and most pragmatic way was to display the top stocks for each year. Only much later, for further optimization purposes, I obtained historical data of 500 stocks from period xy
1
profile image
@Simon_n Too much diversification also means sacrificing returns. Especially with such a high conviction model/strategy
1
profile image
@Krush82 How often will you replace the shares or how often will you check your system?
profile image
@Olli68 The share pool is reviewed/updated twice a year if necessary. This gives you flexibility and allows you to react to changing market conditions
1
profile image
In my opinion, the filter only protected against the drawdown of 2000. The 2008 drawdown was actually only spread over several years by the SPY filter (2008-2011), but not really prevented. In general, you can see that the outperformance of the filter was actually only stabilized in 2000 and was otherwise even better in 2003-2024 without the filter. But could it be that the risk is reduced if you install the filter? Are you currently doing this with a filter? 🤔
profile image
@Krush82 can you remove the period 2000 - e.g. 2004 from the backtest? Then it will probably be better without a filter. 🤔 or briefly calculate each 5-year period. So 2000-2005, 2005-2010 etc. All of course after Christmas then, now on vacation. :)
profile image
@theflyingsquirrel the filter definitely fulfills its purpose and prevents major losses. Without the filter, I would have been under water for almost 4 years until I made up the losses. During the crisis in 2008 and afterwards, I'd rather have 3 years of lean years than -30% to make up. It's impossible to predict whether this will happen again or not. It's also hard for me to ignore the crises and pretend it will never happen again. In fact, I have of course also looked and thought about how I can participate in the better performance "without filters". I then created a traffic light system that switches between risk on and risk off (i.e. without filter, with
filter) as soon as certain signals / indicators are given. This does not mean that you always switch at exactly the right time and thus get the maximum theoretical return, but should still allow a small increase
1
profile image
@Krush82 I'm Paddy/Patrick by the way, in case you don't recognize me by my name here on gq. :D
Are you currently running the traffic light system in your system or do you just have the filter always activated at the moment?
Tips was useless, right?
What do you think about saying that you would deactivate the filter if the momentum system had made a loss of >20% without the filter. That would have worked really well in 2008, as the drawdown would have been prevented by the filter in 2008 and then the performance without the filter would have been taken into account in 2009. However, this probably only works for short drawdown phases. In 2000, there were even greater drawdowns in the years after that without the filter, and you would then take this in full if you only deactivated the filter due to a crash...
profile image
@theflyingsquirrel May I ask which filter you are talking about? The SMA or one of the momentum filters?
profile image
@Simon_n the S&P 500 filter as an overarching barrier for the Top2 stock selection.
2
profile image
@theflyingsquirrel Oh Paddy, just say that - apart from Raul I don't know anyone under his gq account :-) The traffic light system is active on a test basis - Correct, TIPS was completely useless for the model, you could deduce that if a Velrust year >20% you act without a filter in the coming year. There are only two things that bother me. 1. I don't want to experience/realize the -20% loss and 2. it doesn't automatically mean that the whole thing won't happen again the following year. I am therefore trying to establish the new traffic light system with the selected indicators
1
profile image
@Krush82 right, I should have said that directly. :D
And your conclusion on the traffic light system so far?
Right, >20% loss is a lot and that's exactly what didn't work in 2000/2001 when, after the heavy loss in 2000, losses were made again in 2001 without the filter. :-)
profile image
@theflyingsquirrel It's probably still too early to draw any conclusions. It has only been in existence for a quarter or so and has only switched to green so far 😅
profile image
@Krush82 yes ok you're right😅 how do you track your system, i.e. what do you use to calculate the signals and collect the necessary course data and do you also track the traffic light parameters?
profile image
@theflyingsquirrel for the pool selection, i.e. all spy stocks, I use Portfolio Performance and for everything else just excel with finance function
1
Join the conversation