
Early May 2025 sees the tanker market at a crossroads. Very Large Crude Carriers (VLCCs) capitalize on China’s strategic oil stockpiling, Suezmax softens amid West African demand dips, Aframax maintains resilience, and Clean markets show mixed fortunes with LR2/LR1 weakening and MR recovering. U.S. tariffs, Houthi sanctions, and Kazakhstan’s crude surge shape the horizon, while new Norwegian fields and rerouted clean fuels offer opportunities. This sector is a tanker navigating global currents—let’s explore its journey.
⏬ VLCC Market: Buoyant on Chinese Demand
Rate Fluctuations
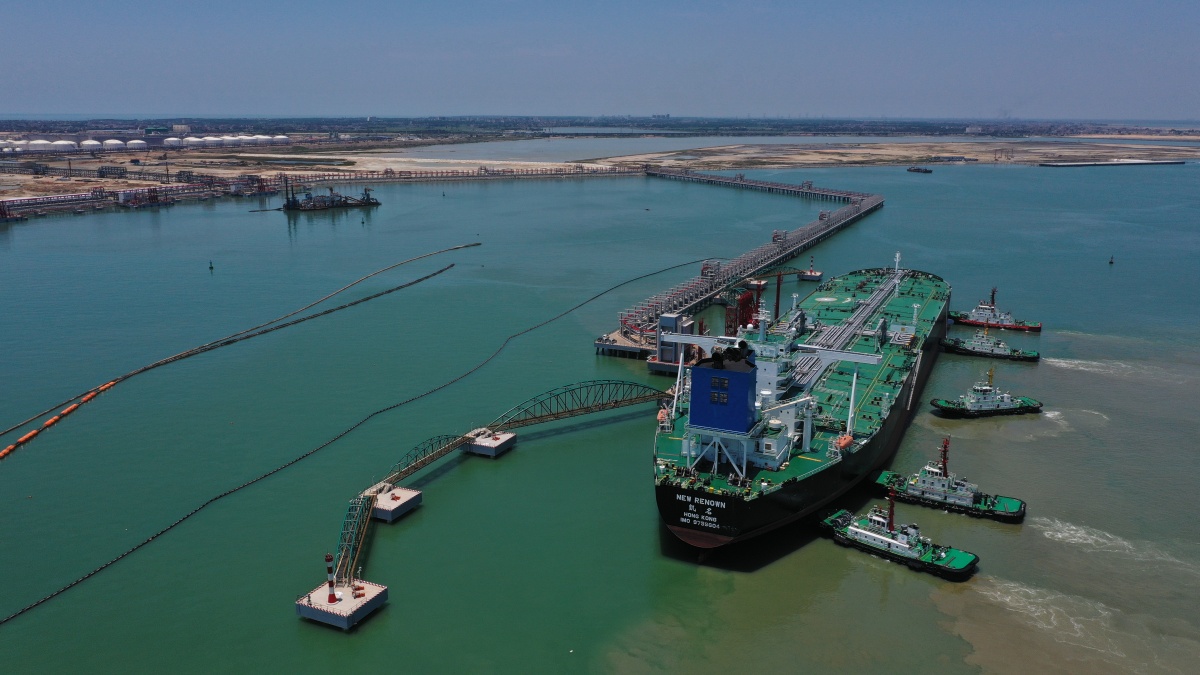
VLCCs, the giants of crude transport, ride a wave of Chinese demand but face tariff headwinds. The Baltic Exchange’s TD3C (270,000 mt Middle East Gulf-to-China) rate drops 5.5 points to WS67, yielding a round-trip time-charter equivalent (TCE) of $51,134 per day. West Africa-to-China (TD15) eases 2.5 points to WS67.13 ($51,690 per day), while U.S. Gulf-to-China (TD22) rises by $411,358, achieving a TCE of $51,054 per day. Clarksons’ fleet-weighted average hits $59,700 per day, up 9% week-on-week, despite a quiet Middle East Gulf (MEG) market post-rally (mid WS70s for MEG/East). Charterers hold back on second-decade MEG fixtures, creating uncertainty—VLCCs remain robust but cautious.
Cargo Dynamics
China’s crude imports surge to 11 million barrels per day in April, the highest since August 2023, driven by strategic stockpiling amid low crude stockpiles (six-year low) and easing Brent prices ($70 in early March). Imports from Iran (1.71 million bpd) and Russia rise, though U.S. crude faces tariff risks (125% on WTI Midland). Two VLCCs (319,000-dwt each) divert from China to Singapore and Malaysia, while a 319,000-dwt vessel discharges 1.99 million barrels in Ningbo, possibly under tariff exemptions. Middle East and West African cargoes slow for third-decade fixtures (8 million barrels covered), but OPEC’s May production boost supports sentiment. Venezuela’s “zombie” VLCCs (e.g., 320,000-dwt ship spoofing as a scrapped vessel) add risk—China’s demand drives VLCC strength, tempered by trade uncertainties.
Global Forces
U.S.-China tariffs (affecting 0.4% of seaborne oil trade) and potential exemptions (e.g., for crude) create volatility, with five VLCCs fixed for May U.S.-China voyages at risk of diversion. Houthi sanctions blacklist vessels delivering to Yemen’s Ras Isa port, impacting VLCC counts. Red Sea rerouting via the Cape of Good Hope persists, boosting tonne-miles. China’s refinery maintenance (April-May) typically curbs demand, but strategic buying defies trends. Low fleet growth (2.4% in 2026) and OPEC’s potential June output hike signal upside, though trade tensions and sanctions cloud the outlook—VLCCs sail with guarded optimism.
For illustrative purposes
⏳ Suezmax Market: Atlantic Softness
Rate Declines
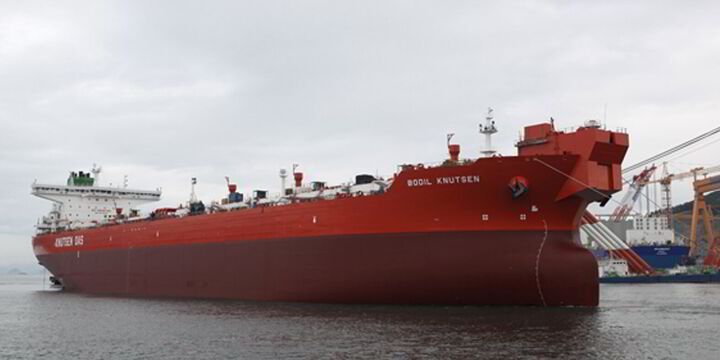
Suezmax vessels, key for West African and Black Sea crude, face softening rates. The Baltic’s TD20 (130,000 mt Nigeria-to-UK Continent) falls 10 points to WS109.17, yielding a TCE of $50,178 per day. Guyana-to-UK Continent (TD27) drops 9 points to WS107.5 ($48,939 per day), while CPC-to-Augusta (TD6) loses 4 points to WS131.55 ($63,500 per day). Middle East-to-Mediterranean (TD23) holds steady at WS91. Rates hit a 2025 high of $56,540 per day in early April, but West African demand tails off, eroding gains—Suezmax navigates a challenging Atlantic market.
Regional Trends
West Africa sees reduced enquiry, with only 20 suitable Suezmax vessels available for third-decade fixtures, signaling further softening below WS110. U.S. Gulf crude struggles eastbound, boosting transatlantic activity (WS95), but local tonnage erodes. China’s resumption of Kazakhstan CPC crude imports (240,000 bpd in April) via Novorossiysk supports TD6 stability, with nine cargoes fixed for May-June. Norwegian Johan Castberg field (135,000 bpd in May) adds demand, with a 158,000-dwt vessel loading 700,000-barrel stems. Black Sea and Mediterranean markets benefit from CPC flows, but Atlantic oversupply persists—Suezmax relies on new trade lanes.
External Pressures
U.S. port fees exempt sub-80,000 dwt vessels, sparing smaller Suezmax units, but tariffs on Venezuelan oil and Houthi sanctions increase risks. Red Sea disruptions extend voyage times, supporting TCEs. Kazakhstan’s 1.7 million bpd output sustains CPC exports, though OPEC+ cuts (down 160,000 bpd in April) temper volumes. China’s property crisis and renewable energy push may curb oil demand, per Clarksons, but Johan Castberg’s light crude offers European refiners an alternative. Low fleet growth (2.4% in 2026) and geopolitical risks (e.g., Russia-Ukraine ceasefire) shape prospects—Suezmax seeks balance amid Atlantic weakness.
For illustrative purposes
⏱️ Aframax Market: Resilient Amid Pressure
Rate Stability
Aframax vessels, versatile crude carriers, hold steady despite softening trends. The Baltic’s TD7 (80,000 mt Cross-UK Continent) slips 4 points to WS135 ($49,100 per day, Hound Point-to-Wilhelmshaven). Cross-Mediterranean (TD19) drops 4 points to WS176.61 ($54,700 per day, Ceyhan-to-Lavera). Atlantic routes weaken, with East Coast Mexico/U.S. Gulf (TD26) and Covenas/U.S. Gulf (TD9) falling 10 points to WS178-177 ($46,500 and $43,800 per day). U.S. Gulf-to-UK Continent (TD25) slides 3.5 points to WS170 ($44,517 per day). Signal Group’s pool reports $60,700 per day for May (27% fixed), reflecting strategic repositioning—Aframax remains resilient but faces downward pressure.
Market Dynamics
North Sea rates stabilize despite limited activity, with second-decade stems busier but growing tonnage lists threatening softness. Mediterranean markets soften as Libyan and Ceyhan dates advance, with North Sea competition adding pressure. U.S. Gulf sees no Aframax spillover from Suezmax, and Nigerian crude struggles limit enquiry. Signal Group’s repositioning to U.S. Gulf and Central Europe (from U.S. West Coast and Lithuania) captures market strength, achieving $43,600 per day in April (98% fixed). Kazakhstan CPC crude and Johan Castberg cargoes support rates, but Mediterranean tonnage balance weakens—Aframax holds firm, eyeing new opportunities.
Broader Forces
U.S. port fee exemptions benefit sub-80,000 dwt Aframax vessels, and Scorpio Tankers notes minimal impact from China-targeted fees due to fleet structure (South Korean-built, sub-55,000 dwt). Houthi sanctions and Venezuelan tariff risks deter operators, while Red Sea rerouting boosts tonne-miles. Clarksons forecasts 2.4% crude fleet growth in 2026, outpacing 0.5% demand, signaling rate pressure. Kazakhstan’s CPC surge and Norway’s Johan Castberg (220,000 bpd by Q2) provide upside, but trade tensions and oversupply loom—Aframax navigates with cautious confidence.
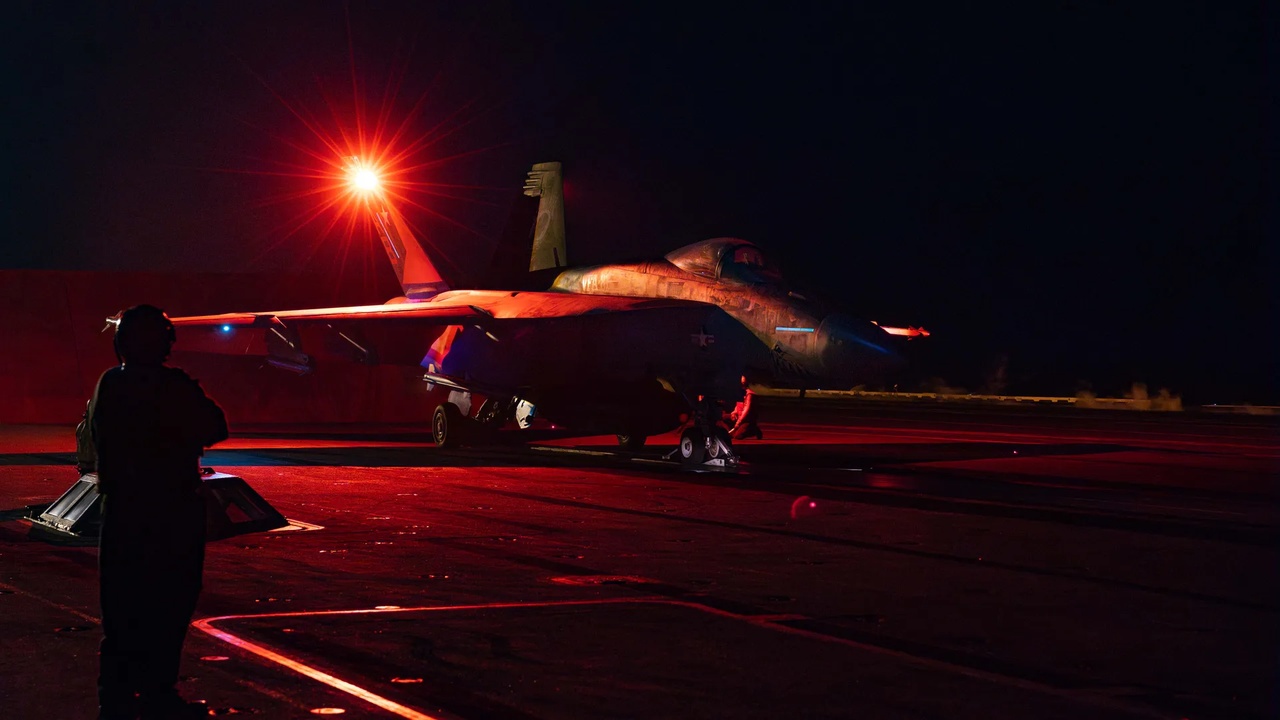
An F/A-18E Super Hornet prepares to launch off the USS Harry S. Truman - For illustrative purposes
⏸️ Clean Market: Mixed Fortunes
Rate Divergence
Clean tanker markets show varied performance. LR2 rates dip, with TC1 (75kt MEG/Japan) falling 2 points to WS124.44 and TC20 (90kt MEG/UK-Continent) dropping $85,000 to $3.5 million. LR1 rates sink further, with TC5 (55kt MEG/Japan) losing 13 points to WS134.06 and TC8 (65kt MEG/UK-Continent) falling to $2.714 million. MR markets recover, with TC17 (35kt MEG/East Africa) up 2 points to WS213.21 ($21,800 per day) and U.S. Gulf TC14 (38kt/UK-Continent) gaining 13 points to WS122.5. Handymax struggles, with TC6 (Baltic) dropping 32.5 points to WS136.94 and TC23 (30kt Cross-UK-Continent) falling 20 points to WS151.67—Clean markets reflect regional splits.
Trade Patterns
MEG LR2/LR1 rates weaken as demand softens, while UK-Continent LR1s hold at WS130 ($24,000 per day). MR markets rebound, driven by U.S. Gulf strength (TC18 up 9 points to WS166.79) and Caribbean runs (TC21 up $77,000 to $589,286). Handymax faces pressure from oversupply and weak Baltic/UK-Continent demand. A 50,000-dwt MR delivers 35,000 tonnes of Qatar’s GTL diesel to the U.S. Gulf, capitalizing on tightening diesel inventories (down 2.4 million barrels). Mediterranean and U.S. Gulf MR markets benefit from repositioning, but Handymax lags—Clean tankers navigate a fragmented landscape.
Influencing Factors
U.S. port fees minimally impact MR and Handymax (sub-55,000 dwt), but LR2 faces risks, though Scorpio notes limited U.S. exposure. Red Sea disruptions support clean tonne-miles, but Clarksons forecasts 6.3% clean fleet growth in 2026 with flat demand, pressuring rates. Qatar’s GTL shipment signals new arbitrage, while China’s potential tariff exemptions (e.g., for chemicals) could boost clean trades. Houthi sanctions and Venezuelan risks deter operators, but U.S. diesel demand offers MR upside—Clean markets balance opportunity with oversupply risks.
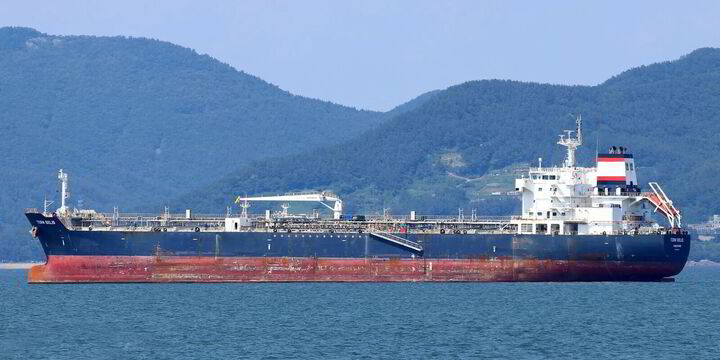
The Torm Belis - For illustrative purposes
🌐 What’s Moving It: Oil Flows and Trade Policies
Commodity Shifts
China’s 11 million bpd crude imports (April) drive VLCC demand, fueled by Iranian (1.71 million bpd) and Russian cargoes, though U.S. crude faces tariff hurdles. Kazakhstan’s CPC crude (240,000 bpd) and Norway’s Johan Castberg (135,000 bpd) boost Suezmax and Aframax. Venezuelan “zombie” tankers (e.g., spoofing scrapped VLCCs) sustain illicit flows. Clean markets see GTL diesel from Qatar to the U.S. (35,000 tonnes) and tightening U.S. diesel inventories, supporting MR. OPEC’s May output hike and potential June increase lift crude sentiment, but China’s refinery maintenance curbs upside—oil flows shape tanker dynamics.
Trade and Policy Pressures
U.S.-China tariffs (0.4% of oil trade) and potential exemptions (e.g., for crude, chemicals) create uncertainty, diverting VLCCs to Singapore/Malaysia. Houthi sanctions blacklist vessels at Yemen’s Ras Isa, impacting crude and clean trades. U.S. port fees exempt sub-55,000 dwt tankers, sparing MR/Handymax, but Venezuelan tariffs and Red Sea rerouting increase costs. Geopolitical risks (e.g., Russia-Ukraine ceasefire, Trump’s policies) and Clarksons’ 2026 forecast (2.4% crude, 6.3% clean fleet growth) signal rate pressure. Kazakhstan’s CPC surge and Qatar’s GTL trade offer opportunities—trade policies steer the tanker path.
🌐 Market and Stocks: Balancing Volatility
Stock Performance
Tanker stocks navigate trade uncertainties. Scorpio Tankers $STNG (+0.17%) reports strong Q1 earnings, beating expectations, with a $397 million cash balance and 10% loan-to-value ratio. Its MR/Handymax fleet (sub-55,000 dwt) avoids U.S. port fee impacts, and LR2s face minimal U.S. exposure. BP $BP. (-0.07%) sells six 46,000-dwt MRs for $192 million ($32 million each), possibly to Tsakos Group $TNP (-0.17%) , which secures nine Suezmax newbuildings ($1.34 billion). Scorpio’s 115,000-dwt LR2 earns $32,000 per day (two-year charter), and its 38,700-dwt Handysize fetches $24,000 per day. Clarksons notes tanker earnings at $35,000 per day (45% above 10-year average)—stocks reflect resilience amid risks.
Investor Insights
VLCC rates may soften if MEG fixtures remain quiet, but China’s stockpiling and OPEC output support sentiment. Suezmax and Aframax benefit from Kazakhstan and Norwegian crude, though Atlantic oversupply caps gains. Clean markets face 2026 headwinds (6.3% fleet growth), but MR strength (e.g., U.S. diesel demand) offers upside. Scorpio’s conservative capital allocation (minimal buybacks, $339 million in 2024) reflects geopolitical caution, while Tsakos’ fleet expansion signals long-term optimism. Low crude fleet growth (2.4%) and sanctions risks shape strategies—investors weigh trade volatility against supply constraints.
Sector Outlook
U.S. tariffs, Houthi sanctions, and Red Sea rerouting pressure rates, but China’s crude imports and new fields (e.g., Johan Castberg) drive demand. Clarksons’ 2026 forecast (crude earnings steady, clean easing) highlights oversupply risks, particularly for LR2/LR1. MR and Handymax benefit from U.S. diesel and GTL trades, while Suezmax and Aframax rely on CPC and Norwegian flows. Stocks like Scorpio (trading below net asset value) and Tsakos (expanding fleet) offer value if demand holds—investors balance short-term risks with long-term fundamentals.
🌐 Outlook: Charting Future Currents
Market Projections
VLCC ranges $50,000-$60,000 per day—China’s demand sustains strength—buoyant. Suezmax at $48,000-$63,000—Atlantic softness limits upside—cautious. Aframax at $43,000-$54,000—resilience persists, but oversupply looms—steady. Clean varies: LR2/LR1 at $15,000-$24,000 (weakening), MR at $15,000-$22,000 (recovering), Handymax at $10,000-$15,000 (pressured)—mixed. Red Sea rerouting and new trades signal volatility—2026 could soften if fleet growth outpaces demand.
Strategic Horizons
VLCCs thrive on Chinese and OPEC flows, but Suezmax needs stronger Atlantic demand. Aframax’s repositioning (e.g., Signal’s U.S. Gulf focus) ensures stability, while MR capitalizes on clean fuel arbitrage. Handymax risks stagnation without new cargoes. Tariffs, sanctions, and 2026 fleet growth (6.3% clean) challenge margins, but low crude fleet growth (2.4%) and new fields offer upside. Investors must navigate geopolitical uncertainties while betting on supply constraints—strategic moves will define tanker fortunes.
Your Call
Will VLCCs lead with Chinese demand, or can MR’s clean fuel surge steal the spotlight? Share your take—let’s master the markets! 🚢
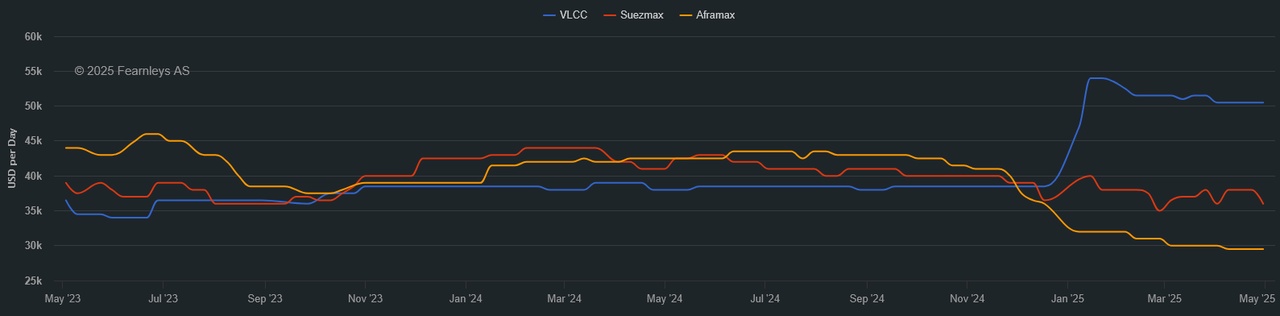
1 Year T/C - VLCC SUEZMAX AFRAMAX ECO / SCRUBBER - April 30th
*The Worldscale (WS) rate is a system used to calculate tanker freight rates, where WS 100 represents a standard base rate for a specific route. Rates above or below this benchmark indicate how much more or less a charterer will pay relative to the base cost. A higher WS rate means better earnings for shipowners, while a lower WS rate means lower transportation costs for charterers.
