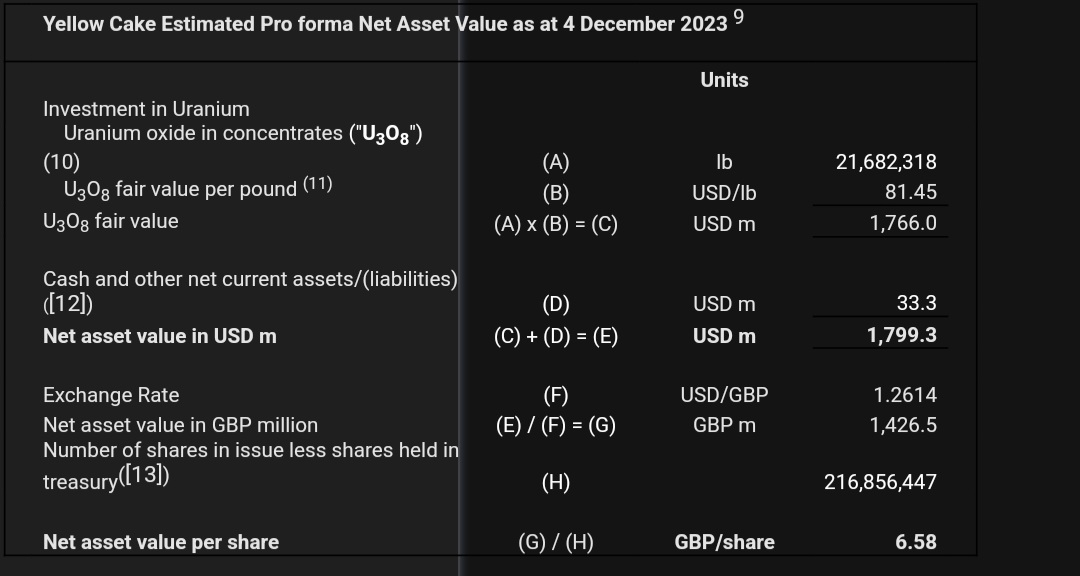
To take up the topic again briefly: Here is an example of a really good and cleanly presented annual report from $YCA (-0.31%)
I particularly like the luxury of being able to calculate the NAV directly for the shareholder. So you can see directly whether the share is currently too expensive or cheap, similar to BDC's.
A brief explanation of the NAV:
Price < NAV = Discount, also günstig
Kurs > NAV = Premium, Expensive.
In the example here, this results in a discount of ~11% at the current price of £5.80 to a NAV of £6.58
And here is the short note: this is not a free-money glitch, just a valuation metric.


