Hello dear Getquin community,
as there was a lot of interest in the Excel template for the article, here is the link to the template for you:
Cheers,
Michael Scott
Hello dear Getquin community,
as there was a lot of interest in the Excel template for the article, here is the link to the template for you:
Cheers,
Michael Scott
Reading time: approx. 12 min
1. ) INTRODUCTION
Recently, I asked you on Getquin to vote on which topic I should cover in one of my future posts. About 65% of you voted for the topic of the “fair stock price” and thus requested a post on the subject.
The question of what constitutes a fair price is, in fact, subjective at first. A common definition is that the fair price of a stock is the sum of its discounted cash flows [1]. This definition also forms the basis for the well-known discounted cash flow method (DCF method) [2], which assumes a growth phase and a terminal phase and sums up all future cash flows, discounted to determine the fair value of a stock. What exactly “discounting” means and how to apply it will be explained later in this post.
Before I explain my method in detail, however, I’d like to be sure to address its limitations. My method is just one of many—and it’s certainly not the method that allows you to determine the exact value of a stock 10 years from now to two decimal places. Every method relies on assumptions and, when in doubt, is only as good as the assumptions made. Furthermore, such models are highly sensitive to even small changes in input values, so that a change in the interest rate from 5% to 3% can already result in significant changes in the final outcome.
That is why it is always advisable to make somewhat pessimistic (or at least realistic) assumptions in all analyses and to always factor in a so-called margin of safety at the end.
2.) FREE CASH FLOW
The basis of the method is the estimation of the free cash flow of a company over the next few years. Free cash flow is a popular metric among investors because it indicates how much of the operating cash flow (=money generated by the company’s operations) is actually available to investors. For example, free cash flow can be calculated from a company’s cash flow statement by subtracting operating cash flow the so-called capital expenditures (capex) fromoperating cash flow:
Free Cash Flow = Operating Cash Flow – Capex
Capex includes all capital expenditures “for long-term fixed assets, such as machinery, buildings, as well as initial equipment, spare parts, and computer systems” [4]. Fortunately, we can derive both operating cash flow and capex from a company’s cash flow statement. For my method, I use free cash flow because it is less susceptible to accounting technicalities than, for example, EBITDA.
For the method presented here, it will be important to estimate a company’s free cash flow for the coming years. Like any estimate, a free cash flow estimate is, of course, not error-free and is subject to uncertainty. In addition, we want to keep the estimate as simple as possible. I estimate free cash flow as follows:
EBITDA
- Capex
- Taxes
+ Stock-Based Compensation
= Free Cash Flow
This is an estimate that provides a fairly accurate picture of a company’s free cash flow. Many minor details that play a role in the cash flow statement are not taken into account here, but in most cases, these are not particularly significant. As a reminder: we wanted a simple and robust estimate of free cash flow.
Now that we have a way to estimate free cash flow from EBITDA, let’s take it a step further and move on to valuing a company based on free cash flow. Personally, I like to use the so-called free cash flow yield. The free cash flow yield is calculated by dividing the free cash flow generated in a year by the market capitalization (=price):
FCF Yield = FCF / Market Cap = (FCF/share) / (price/share)
The FCF yield indicates what percentage of the market capitalization is generated annually by free cash flow. The higher the FCF yield, the lower the valuation. For example, Microsoft $MSFT (+0.16%) is valued at about a 2% FCF yield, while Apple $AAPL (+1.22%) at 3.4%, Exxon Mobil $XOM (-0.01%) at 9%, and British American Tobacco $BATS (-0.42%) at 19%. Microsoft’s business model is viewed as low-risk, secure, and generating recurring revenue, whereas so many risks and contraction scenarios are currently priced into British American Tobacco’s valuation that it results in such a high FCF yield.
The FCF yield at which a company is valued depends in particular on the security of its business model, its future growth prospects, and the risks involved. This can, of course, change over time: as recently as the early 2010s, Microsoft was valued at an FCF yield of around 10%. In the case of a declining FCF yield, we speak of a multiple expansion, since the company’s cash flows are viewed as increasingly secure. If you had bought Microsoft at a 10% FCF yield and Microsoft were still generating exactly the same cash flow today as it did at that time, you would still have fivefold.
3.) MY METHOD
The basis for any company’s earnings or losses is always revenue first and foremost: if revenue rises, there is a chance to earn more money in the future; if it falls, it becomes harder to earn more money. How much profit a company generates can be determined by the so-called EBITDA (earnings before interest, taxes, depreciation, and amortization). The ratio of EBITDA to revenue is known as the EBITDA margin. If a company improves its EBITDA margin, it becomes more efficient, and a proportionally larger share of each dollar earned remains as EBITDA. As mentioned in the section on free cash flow, we can estimate free cash flow from EBITDA by accounting for Capex, taxes, and stock-based compensation.
Example: A company generates €1,000 in revenue and achieves an EBITDA of €400. In addition, it incurs Capex of €100 and taxes of €50. The company spends €5 on stock-based compensation. The company then has an EBITDA margin of 40% and an approximate free cash flow of
FCF = €400 - €100 - €50 + €5 = €255.
If the company’s current market capitalization is €10,000, it would have an FCF yield of €255 / €10,000 = 2.55%.
If we now estimate future revenue growth, the future EBITDA margin, and future expenditures for capex, taxes, and stock-based compensation, we can estimate future free cash flow. If we can then estimate the FCF yield at which a share could be sold in X years, we can use that to estimate the company’s future market capitalization. If we also take into account the number of outstanding shares and any share buybacks by the company, we can also estimate the price per share in X years.
4.) EXAMPLE: PHILIP MORRIS $PM (-0.98%)
To better understand the method, it’s helpful to look at a specific example. For this, I’ve specifically chosen Philip Morris ($PM). Before we begin, however, it’s important to define the investment horizon. Since I want to invest for the long term, I’m setting the investment horizon at 10 years. This is entirely arbitrary at first, but as a general rule: the shorter or longer the time horizon, the greater the inaccuracies. With shorter time horizons, we are too heavily subject to cyclical fluctuations in free cash flow, and with too-long time horizons, the model becomes less accurate due to its high sensitivity.
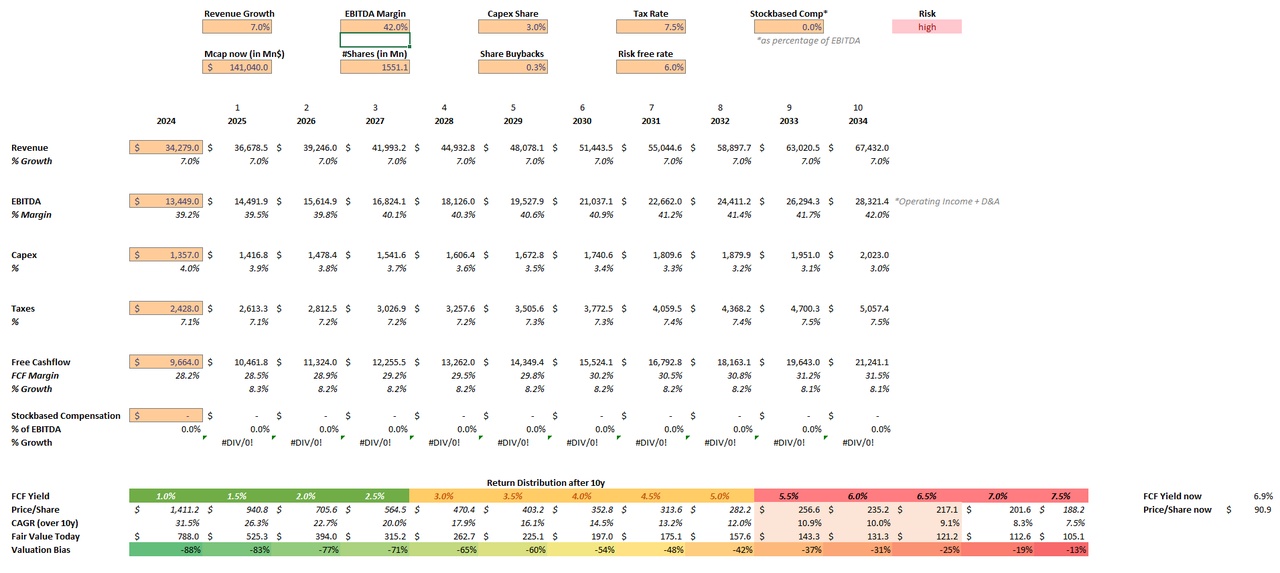
Warning: There are many numbers and estimates to follow, which are difficult (to put it euphemistically) to present in a suitable format here on Getquin. I’ve attached a screenshot of my personal Excel spreadsheet so you can better understand much of this there. The following data is taken from [5]:
i. The Snapshot (TTM, all figures in millions):
Market capitalization = 145,040 USD
Number of shares = 1,551.1
EBITDA = 13,449 USD
Capex = 1,357 USD
Taxes = 2,428 USD
Stock-Based Compensation = 0 USD
ii. Calculation of Free Cash Flow & Margins:
Free Cash Flow = 13,449 - 1,357 - 2,428 + 0 = 9,664 USD
EBITDA Margin = 39.2%
Capex / Revenue = 4.0%
Taxes / Revenue = 7.1%
We now have an overview of the current situation of Philip Morris. We now want to estimate what these figures will look like in about 10 years. To do this, we estimate:
Revenue growth (annual)
EBITDA margin (in 10 years)
Capex / Revenue (in 10 years)
Taxes / Revenue (in 10 years)
Share buybacks as a percentage (annual)
Stock-Based Compensation / EBITDA (in 10 years)
As we can see, we have to make some estimates here, and depending on how they turn out, the final result massively . If we’re too optimistic, we can make almost any future price—no matter how high—look reasonable. If we’re too pessimistic, then almost any price today will seem too expensive to us.
iii. The company’s development:
A detailed discussion of my assessment of Philip Morris’s business development would be too extensive at this point and would provide enough material for a separate post (feel free to comment if you’d like). So here is a summary of my assessment:
Philip Morris is struggling with declining cigarette volumes. For years, there has been an annual decline in volume of about 2%, which has so far been offset by price increases. In principle, I expect cigarette sales to decline by about 1% per year over the next 10 years. In the area of risk-reduced products—primarily IQOS and snus—Philip Morris is growing at a rate of 15–20% annually, and IQOS is set to enter the U.S. market in 2024. Management itself anticipates overall group revenue growth of 7–9% annually.
The new risk-reduced products also have higher margins than traditional cigarettes, so as their share of total revenue grows, it can be assumed that the EBITDA margin will even increase slightly in the future.
Recent years have been characterized by high capital expenditures (capex), particularly in new product categories. The products are now market-ready, and we are entering a phase in which capex will be somewhat lower. I also expect tax expenses to remain roughly in line with the average of recent years, and that, with rising cash flows and lower investments, share buybacks will resume.
Overall, my long-term estimates are as follows:
Revenue growth = 7% annually
EBITDA margin = 42%
Capex / Revenue = 3%
Taxes / Revenue = 7.5%
Share buybacks as a % = 0.3%
Stock-Based Compensation / EBITDA = 0%
iv. Possible price in 10 years:
After a bit of percentage math and a few Excel formulas, we see that Philip Morris is estimated to be worth 21,241.1 million USD in free cash flow in 10 years. In addition, the number of outstanding shares has increased to 1,505.8 .
Philip Morris is currently trading at an FCF yield of 6.9% . If this valuation remains unchanged over the next 10 years, the market capitalization in 10 years will be 307,842 million USD. Dividing this by the number of shares outstanding in 10 years yields a price per share of approximately 204 USD. At a current price of about 90 USD, this would represent an annual return of about 8.6% .
This calculation does not yet take into account a possible multiple expansion or deflation—that is, an increase or decrease in the FCF yield. Furthermore, we must discount the future stock price to determine the fair value today.
5.) FAIR VALUE WITH A MARGIN OF SAFETY
The final variable in our estimates is the so-called risk-free rate . This is the risk-free or low-risk interest rate that one receives, for example, on investments in government bonds, fixed-term deposit accounts, or similar instruments. For example, if you earn 5% annually on a 10-year fixed-term deposit, you would need to invest approximately €614 today to receive €1,000 after 10 years: the money you’ll receive in 10 years is discounted at an annual rate of 5% discounted (€614 = €1,000 / (1.05)^10).
In the same way, we must also future stock price, since we could also invest the money today in a fixed-income instrument for 10 years. Of course, this leaves a lot of room for interpretation in the valuation: if we assume a low risk-free rate, today’s stock prices automatically increase; if we assume a high risk-free rate, today’s stock prices decrease. Incidentally, this is also why the stock market generally reacts sensitively to changes in interest rates.
Let’s assume (conservatively!) an average risk-free rate of 6% , we arrive at the following fair value for Philip Morris today:
204 USD / (1.06)¹⁰ = 114 USD
After all the estimates, calculations, and discounting, we have now arrived at a fair value of $114 per share. As mentioned several times, however, this is a model that relies on many assumptions, estimates, and idealizations. Therefore, it is always advisable to maintain a margin of safety . To do this, I deduct a flat 20% from my calculated fair value, resulting in a total of:
Fair Value w/ MoS = 91 USD
This figure is quite close to today’s stock price of about 90 USD per share, so our estimates and assumptions should, in principle, not be too far off the mark.
To conclude this section, here are a few examples showing how sensitive our model is to changes in certain estimates. All examples assume that the other estimates and parameters remain the same:
6.) SUMMARY & OUTLOOK
Based on the company’s current balance sheet and our estimates for its business performance, we can use this method to determine a fair value for a share. One factor that has not yet been considered is a possible multiple expansion/contraction—that is, a change in the FCF yield over the next 10 years—has not been taken into account. In the screenshot attached to this post, you can see an overview of how this parameter influences today’s valuation (return distribution).
If you’re interested, I’d be happy to provide a corresponding Excel template. Just leave a comment below the post, and I’ll figure out a way to share the template with you.
Finally, let me reiterate: take the final result with a healthy dose of caution . There are no guarantee that my model even comes close to accurately describing reality, since there are many subjective assessments on my part. As a small consolation, there will soon be a post that will show you that, in many cases, a stock’s price isn’t nearly as important as you might think.
As always, I’m open to questions, suggestions, and criticism.
Stay tuned,
Yours, Michael Scott
Sources:
[1] Wikipedia: https://de.wikipedia.org/wiki/Abzinsung_und_Aufzinsung
[2] Wikipedia: https://de.wikipedia.org/wiki/Discounted_Cash-Flow
[3] Business Administration Dictionary: https://www.bwl-lexikon.de/wiki/free-cash-flow/#berechnung-direkte-methode
[4] Business Encyclopedia: https://wirtschaftslexikon.gabler.de/definition/capex-52700
[5] SeekingAlpha: https://seekingalpha.com/